

Research on the verifying method of allowable discharge in printing and dyeing industry based on different discharge reduction scenarios: a case study in Nantong City of Jiangsu Province
-
摘要:
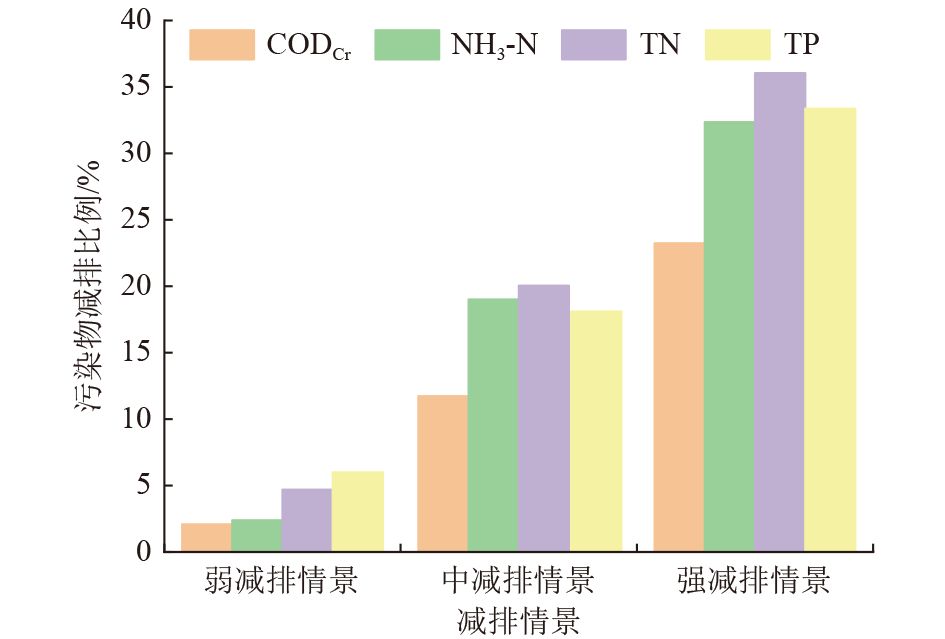
针对我国排污许可制度中许可排放量限值合理确定的需求,以南通市88家间排印染企业为研究对象,采用传统的排放绩效核算方法和基准线设定方法,对印染企业进行基于实际排放水平的排放绩效确定;同时,从假设定量的角度确定印染企业强、中、弱3种减排情景的许可限值,并预测了3种减排情景下化学需氧量(CODCr)、氨氮(NH3-N)、总氮(TN)、总磷(TP)的减排量。结果表明:1)88家印染企业CODCr、NH3-N、TN、TP实际排放量占许可排放量比例平均值最大不超过34.46%,印染企业主要水污染物许可排放量有较大核减潜力;2)88家印染企业4种污染物由分位值法得到的95%分位值和99%分位值与由正态分布分析法得到的P95和P99对应绩效相当;3)对比分析分位值法、正态分布分析法所得基准线及88家印染企业实际排放平均绩效、标准绩效发现,对于4种污染物,至少有71.59%企业的实际排放绩效在平均绩效之下,17.05%企业的实际排放绩效在平均绩效与95%分位基准线之间,2.33%企业的实际排放绩效在95%分位基准线与标准绩效之间;4)基于弱、中、强3种减排情景的4种污染物预计减排比例分别为2.08%~5.99%、11.73%~20.05%和23.24%~36.04%。
Abstract:In view of the need for reasonable determination of allowable emission limits in China's emission permit system, 88 printing and dyeing enterprises in Nantong City were taken as the research object, and the traditional discharge performance accounting methods and baseline setting methods were adopted to determine the discharge performance of printing and dyeing enterprises based on the actual emission level. Meanwhile, the allowable limits of printing and dyeing enterprises were determined under three scenarios of strong, medium and weak discharge reduction from a hypothetical quantitative perspective. The discharge reductions of chemical oxygen demand (CODCr), ammonia nitrogen (NH3-N), total nitrogen (TN) and total phosphorus (TP) under the three scenarios were projected. The results showed as follows: 1) The maximum average value of the actual discharges of CODCr, NH3-N,TN and TP in 88 printing and dyeing enterprises did not exceed 34.46% of the allowable discharges, the permissible discharge of major water pollutants in Nantong printing and dyeing enterprises had great potential for verification and reduction. 2) 95% and 99% quantile values of the 4 pollutants from 88 printing and dyeing enterprises obtained by the quantile value method were equivalent to the corresponding performance values of P95 and P99 obtained by the normal distribution analysis method. 3) Comparing the numerical reference lines obtained by the quantile value method and the normal distribution analysis method with the actual average and standard performances of 88 printing and dyeing enterprises, it was found that as to the four pollutants, at least 71.59% of the enterprises were below the average performances, 17.05% of the enterprises were between the average performances and the 95% quintile, and 2.33% of the enterprises were between the 95% quintile and the standard performances. 4) Based on the three discharge reduction scenarios of weak, medium, and strong, the projected discharge reductions for four pollutants were 2.08%-5.99%, 11.73%-20.05% and 23.24%-36.04%, respectively.
-

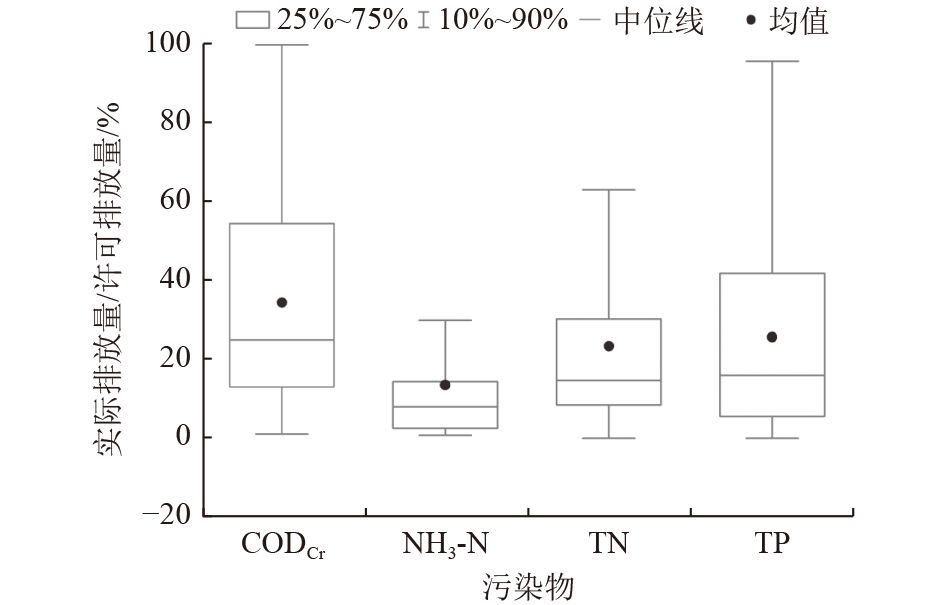
图 1 88家企业各污染物实际排放量与许可排放量比值
Figure 1. The ratio between actual discharge and permitted discharge of each pollutant of 88 enterprises

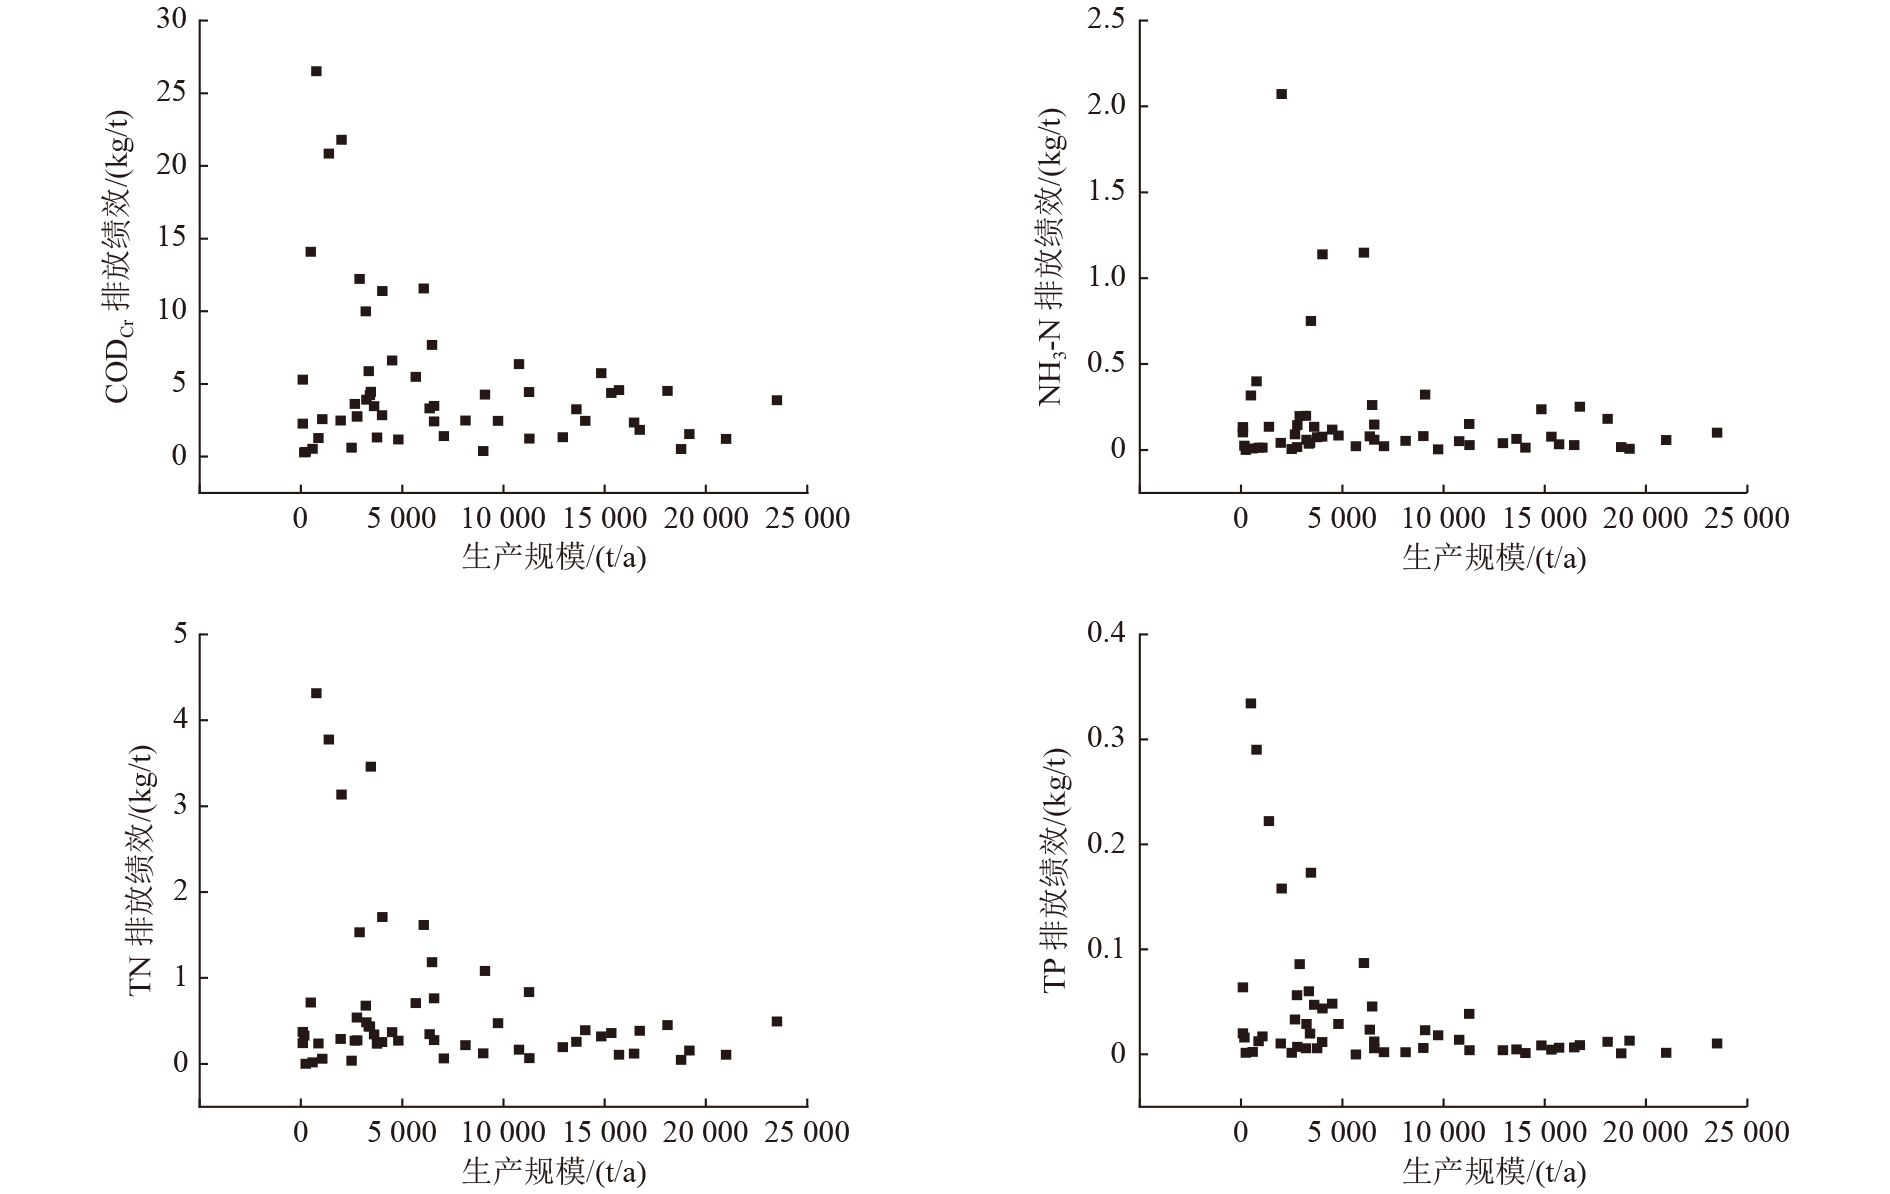
图 2 企业规模与排放绩效关系
Figure 2. Relationship between enterprise size and discharge performance

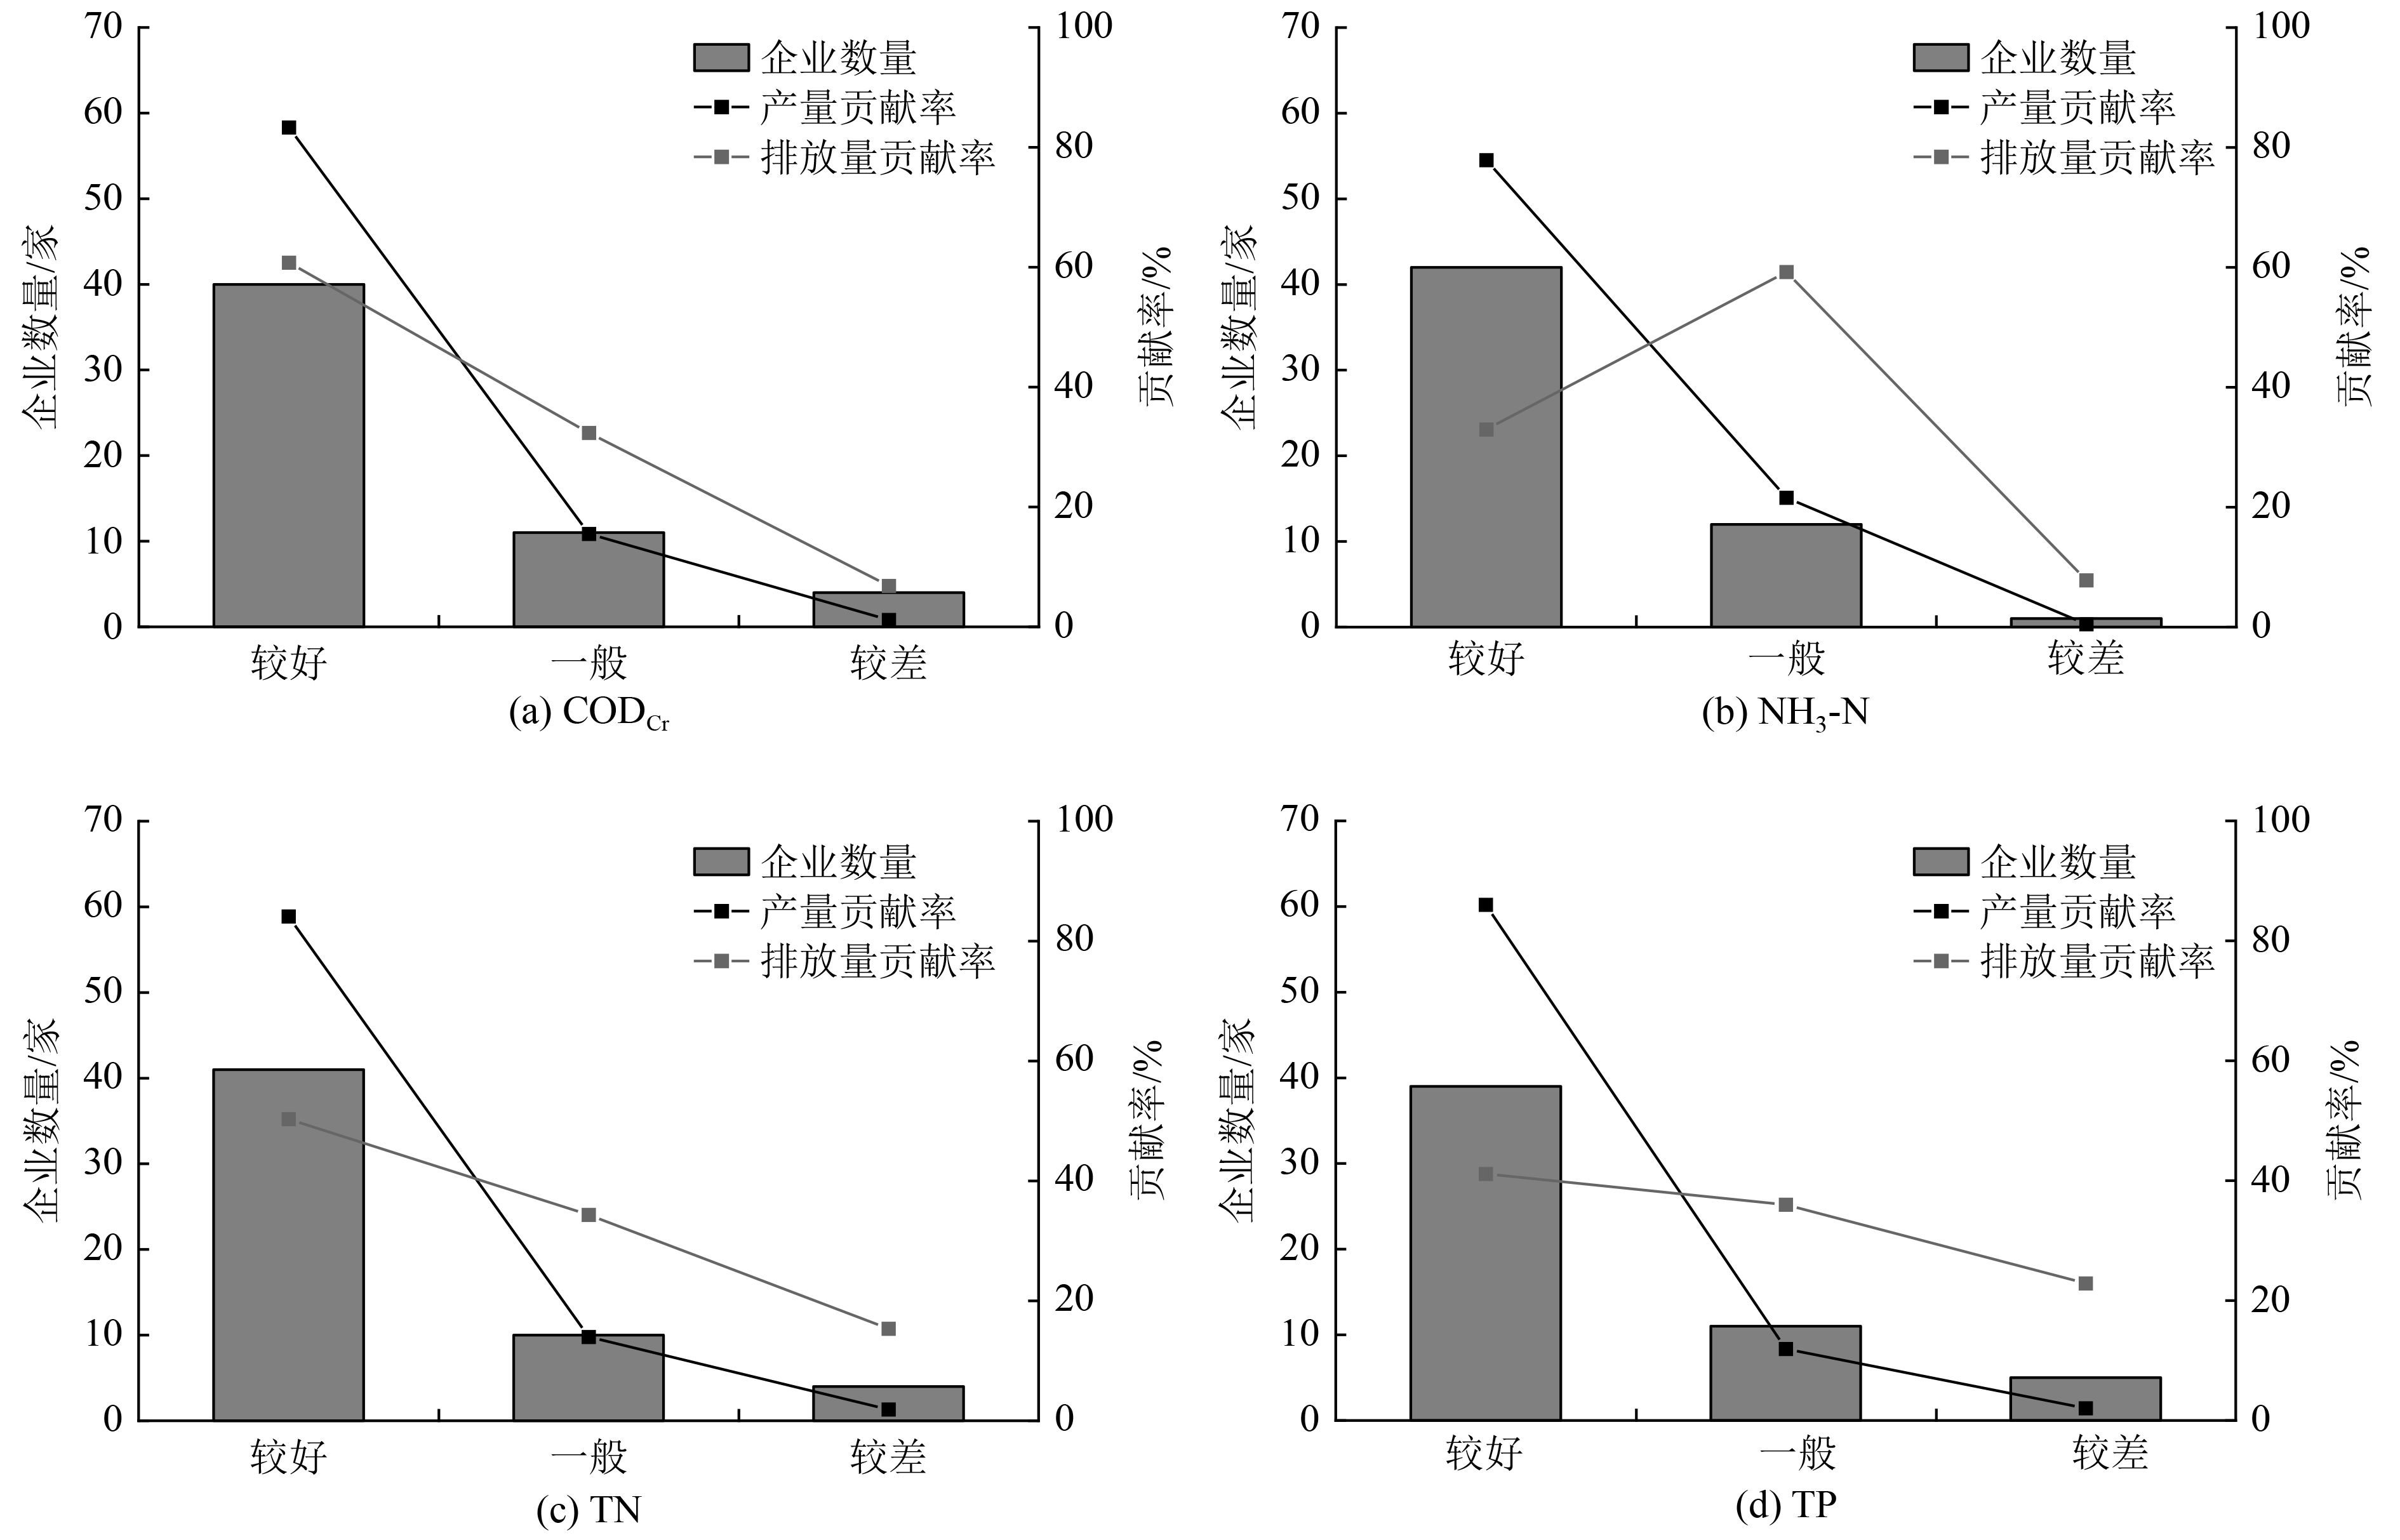
图 3 不同水污染物排放绩效等级与企业数量、贡献率关系
Figure 3. Relationship between different discharge performance levels of water pollutants and the number and contribution rate of enterprises

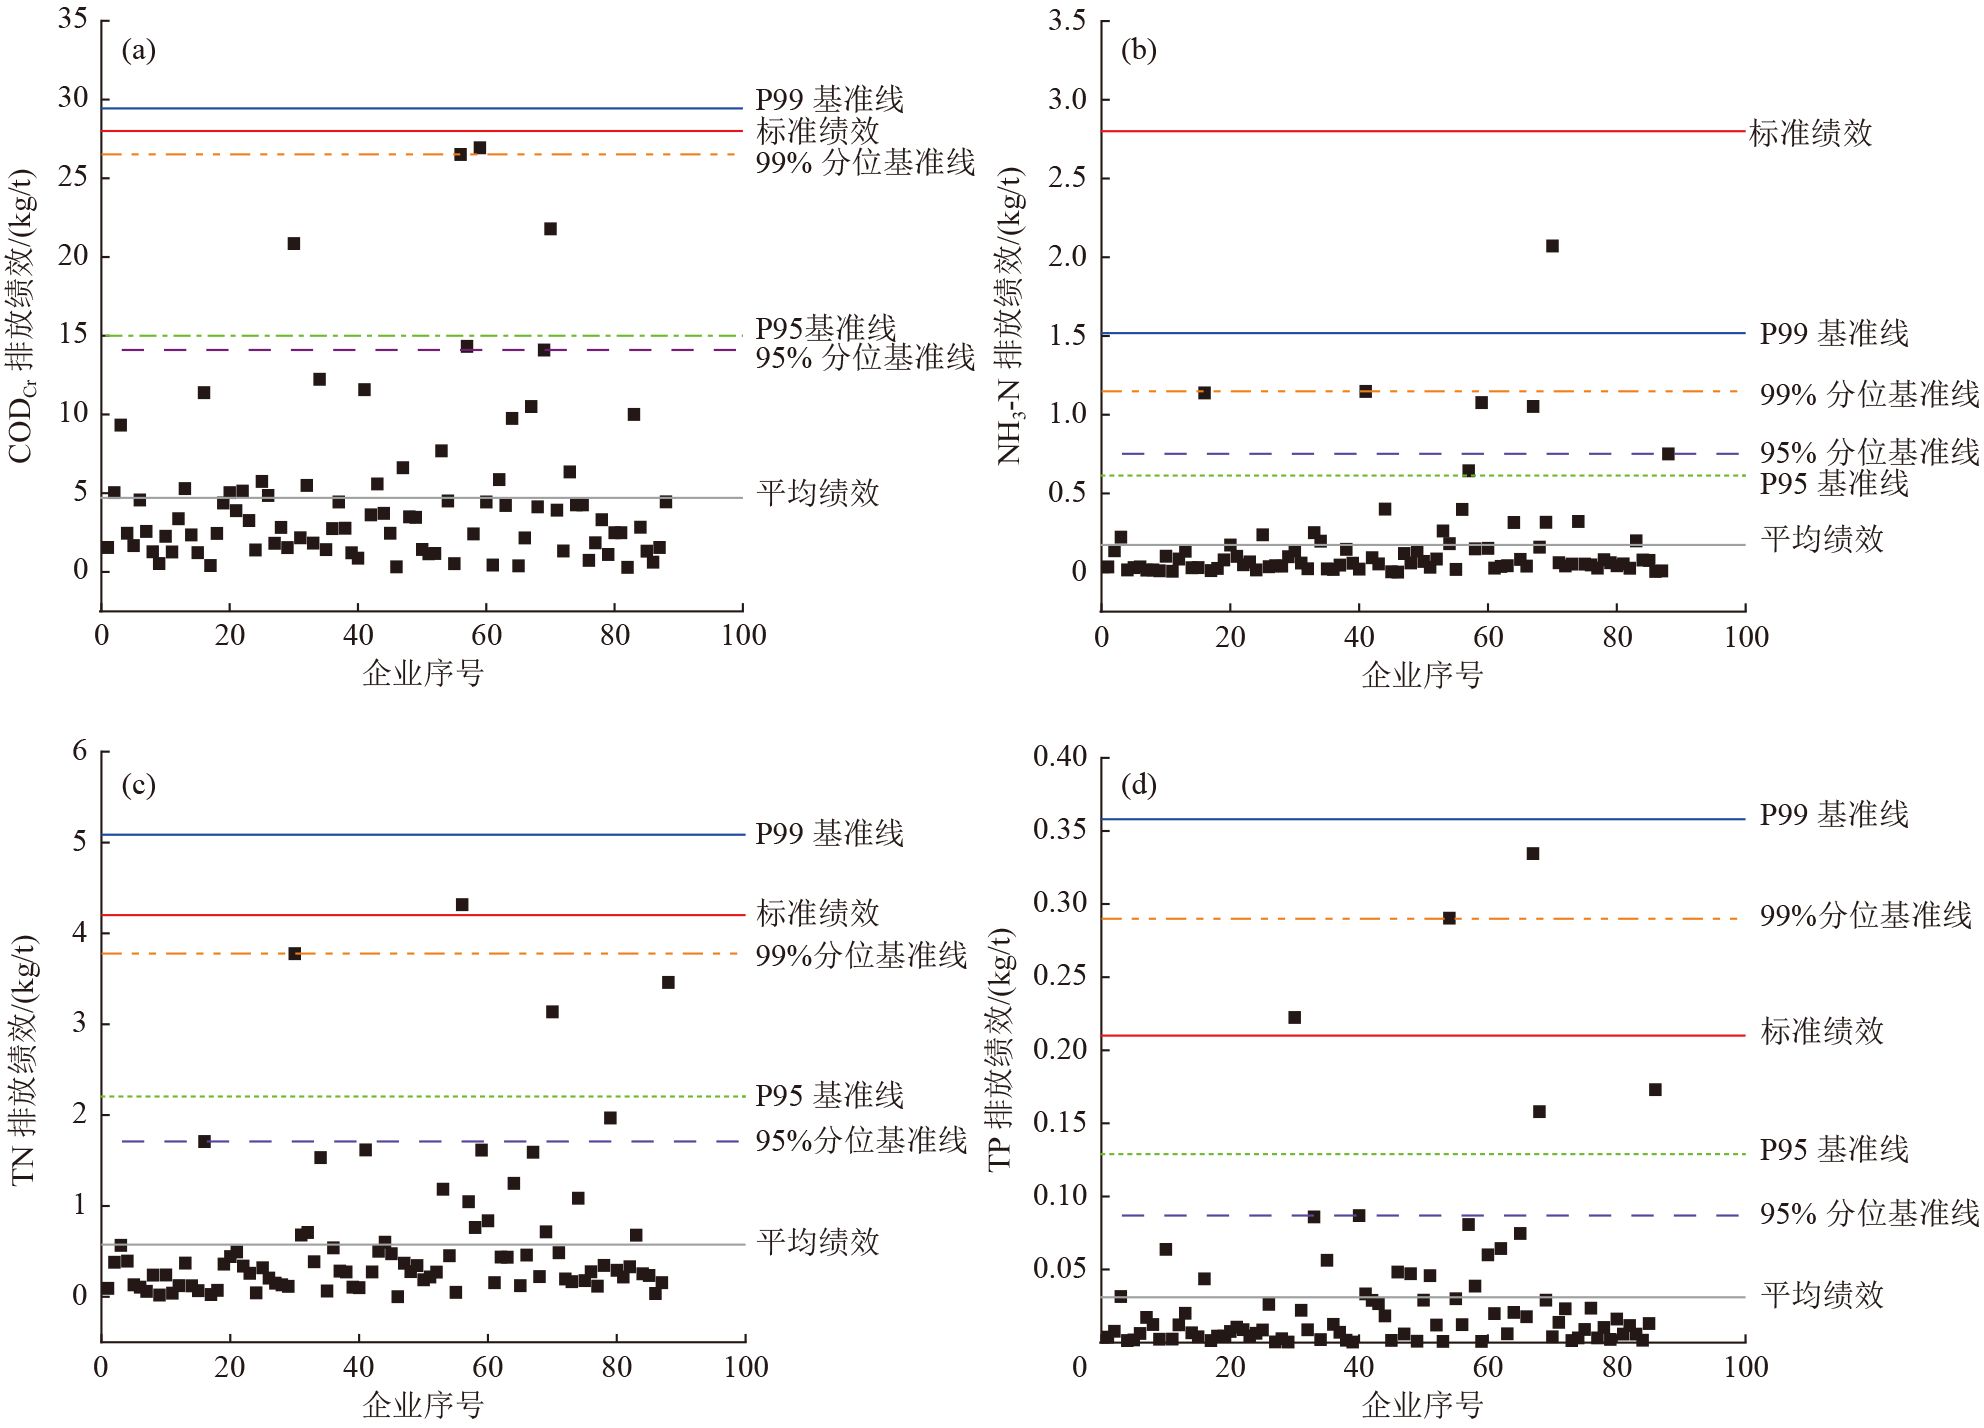
图 4 88家印染企业主要水污染物实际排放绩效及基准线
Figure 4. Major water pollutant discharge performance and baseline of 88 printing and dyeing enterprises

图 5 不同减排情景下4种污染物预计减排的比例
Figure 5. Projected discharge reduction ratio of 4 pollutants under different discharge reduction scenarios
表 1 污染物排放限值及标准绩效
Table 1. Pollutant discharge limits and standard performances
污染物 排放限值1)/(mg/L) 标准绩效/(kg/t) CODCr 200 28 NH3-N 20 2.8 TN 30 4.2 TP 1.5 0.21 1)GB 4287—2012《纺织染整工业水污染物排放标准》。  下载: 导出CSV
表 2 企业不同生产规模的污染物实际排放量与许可排放量比值
Table 2. The ratio between actual discharge and permitted discharge of pollutants for different enterprise sizes
% 生产规模/(万t/a) CODCr NH3-N TN TP ≤0.60 1.06~99.64 0.74~60.77 1.00~49.02 1.40~77.69 0.60~1.20 6.53~99.43 1.42~98.19 2.82~92.19 1.82~99.20 1.20~1.80 7.44~94.02 1.04~41.70 2.26~96.50 3.54~99.24 >1.80 5.39~55.61 1.21~19.78 6.13~62.93 2.00~30.62
下载: 导出CSV
表 3 企业主要水污染物排放绩效分级
Table 3. Classification of discharge performance of major water pollutants in enterprises
污染物 绩效等级 绩效区间/(kg/t) 企业数量/家 产量/(万t/a) 排放量/(t/a) 总数 大型 中型 小型 CODCr 较好 0~4.709 40 5 7 28 33.21 878.28 一般 4.709~14.099 11 0 1 10 6.18 467.93 较差 14.099~29.433 4 0 0 4 0.46 99.03 NH3-N 较好 0~0.173 42 4 6 32 31.04 17.51 一般 0.173~1.710 12 1 2 9 8.60 31.47 较差 1.710~2.8 1 0 0 1 0.20 4.15 TN 较好 0~0.574 41 8 5 28 33.52 87.30 一般 0.574~2.205 10 0 0 10 5.57 59.58 较差 2.205~5.086 4 0 0 4 0.76 26.63 TP 较好 0~0.031 39 5 8 26 34.28 2.88 一般 0.031~0.129 11 0 0 11 4.76 2.52 较差 0.129~0.358 5 0 0 5 0.81 1.60 注:绩效区间较好等级最大值取自2.3节平均绩效(88家企业的实际排放绩效平均值),一般等级最大值取95%分位排放绩效,较差等级最大值取标准绩效(当实际排放绩效超过标准绩效时,则取超标值作为较差等级最大值)。
下载: 导出CSV
表 4 分位值法和正态分布法基准线划定
Table 4. Delimiting for the baseline by quantile value method and normal distribution method
kg/t 污染物 分位值法 正态分布分析法 95%分位基准线 99%分位基准线 P95基准线 P99基准线 CODCr 14.099 26.521 15.003 29.433 NH3-N 0.752 1.149 0.614 1.518 TN 1.710 3.777 2.205 5.086 TP 0.087 0.290 0.129 0.358
下载: 导出CSV
表 5 88家印染企业4种污染物不同减排情景排放绩效基准线设定
Table 5. Setting of discharge performance baseline of 4 pollutants under different discharge reduction scenarios of 88 printing and dyeing enterprises
kg/t 减排情景 排放绩效基准线 CODCr NH3-N TN TP 弱减排情景 95%分位基准线 14.099 0.752 1.710 0.087 中减排情景 85%分位基准线 6.625 0.238 0.837 0.046 强减排情景 平均绩效 4.709 0.165 0.574 0.031
下载: 导出CSV
表 6 不同减排情景下污染物实际排放绩效高于基准线的企业数量占比
Table 6. Proportion of actual pollutant discharge performance above the baseline under different discharge reduction scenarios
% 情景 CODCr NH3-N TN TP 弱减排情景 5.68 5.68 5.68 5.68 中减排情景 15.91 15.91 15.91 15.91 强减排情景 27.06 20.00 23.53 21.18
下载: 导出CSV
-
[1] 宋国君, 张震. 美国工业点源水污染物排放标准体系及启示[J]. 环境污染与防治,2014,36(1):97-101.SONG G J, ZHANG Z. Effluent standards system for industrial point sources in USA and its implimentation to China[J]. Environmental Pollution & Control,2014,36(1):97-101. [2] TABLER S K. EPA's program for establishing national emission standards for hazardous air pollutants[J]. Journal of the Air Pollution Control Association,1984,34(5):532-536. doi: 10.1080/00022470.1984.10465771 [3] PAHL D. EPA's program for establishing standards of performance for new stationary sources of air pollution[J]. Journal of the Air Pollution Control Association,1983,33(5):468-482. doi: 10.1080/00022470.1983.10465594 [4] 叶维丽, 周海洋, 张金辉, 等. 基于水质目标的排污许可限值管理体系思考与建议[J]. 环境保护,2021,49(9):23-25.YE W L, ZHOU H Y, ZHANG J H, et al. Thoughts and suggestions on the management system of pollutant discharge permit limit based on water quality objectives[J]. Environmental Protection,2021,49(9):23-25. [5] 王焕松, 周添, 贾学桦, 等. 衔接水质目标与管控现状的水污染物许可排放量核算方法研究: 以造纸和纸制品业为例[J]. 环境保护,2022,50(13):28-34.WANG H S, ZHOU T, JIA X H, et al. Study on accounting method of allowable discharge of water pollutants linking water quality objectives with control status: taking paper and paper products industry as an example[J]. Environmental Protection,2022,50(13):28-34. [6] 胡颖, 邓义祥, 郝晨林, 等. 我国应逐步实施基于水质的排污许可管理[J]. 环境科学研究,2020,33(11):2507-2514.HU Y, DENG Y X, HAO C L, et al. Gradual implementation of pollutant discharge permit management based on water quality targets in China[J]. Research of Environmental Sciences,2020,33(11):2507-2514. [7] 长江经济带生态环境保护规划[N]. 中国能源报, 2017-07-24(19). [8] 田涛, 高海龙, 张冰洁. 基于先进技术的印染行业企业许可排放量核定方法研究: 以太湖流域为例[J]. 环境工程,2022,40(10):176-182.TIAN T, GAO H L, ZHANG B J. Verification method of the permitted emissions of printing and dyeing enterprises based on advanced technologies: a case study of the Taihu Lake basin[J]. Environmental Engineering,2022,40(10):176-182. [9] 邓义祥, 郝晨林, 李子成, 等. 基于技术和水质相结合的排污许可限值核定技术研究[J]. 环境科学研究,2020,33(11):2515-2522.DENG Y X, HAO C L, LI Z C, et al. Revision and determination of wastewater discharge permit limit based on technology and water quality target[J]. Research of Environmental Sciences,2020,33(11):2515-2522. [10] 张月, 蔡木林, 邢敏, 等. 控制单元污染源排污许可总量限值优化研究: 以永定河流域为例[J]. 环境工程技术学报,2023,13(1):431-437.ZHANG Y, CAI M L, XING M, et al. Optimization of total discharge permit limit of pollution sources in control units: a case study of Yongding River watershed[J]. Journal of Environmental Engineering Technology,2023,13(1):431-437. [11] QU Y, YUAN Y M, GUO L L, et al. Initial allocation of SO2 emission rights based on the combination weighting method: evidence from China's thermal power plants[J]. Environmental Science and Pollution Research,2022,29(10):14743-14753. doi: 10.1007/s11356-021-15745-x [12] QIN T L, YAN D H, YU Z L, et al. Research on the overall framework of total quantity control of water pollutants in the strategic environmental assessment of basin[M]//Advances in Energy Equipment Science and Engineering. Boca Raton: CRC Press, 2015: 717-723. [13] ZHOU Z B, LIU C J, ZENG X M, et al. Carbon emission performance evaluation and allocation in Chinese cities[J]. Journal of Cleaner Production,2018,172:1254-1272. doi: 10.1016/j.jclepro.2017.10.208 [14] United States Environmental Protection Agency. Federal Water Pollution Control Act[A/OL]. (2002-11-27)[2023-05-10]. https://www.epa.gov/sites/production/files/2017-08/documents/federal-water-pollution-control-act-508full. [15] 金之杰. 碳排放权交易下企业碳履约成本分析:基于多案例的比较[D]. 杭州: 杭州电子科技大学, 2023. [16] 李嘉. 基于行业排污特性的排污许可限值核定方法研究: 以沙颍河典型行业为例[D]. 郑州: 郑州大学, 2020. [17] 刘添涛, 张怀东. 印染行业“十三五”清洁生产潜力分析研究[J]. 染整技术,2016,38(8):59-62.LIU T T, ZHANG H D. Analysis and research on cleaner production potential of printing and dyeing industry in the 13th Five-Year Plan[J]. Textile Dyeing and Finishing Journal,2016,38(8):59-62. ◇ -

 下载:
下载:

 点击查看大图
计量
- 文章访问数: 120
- HTML全文浏览量: 39
- PDF下载量: 32
- 被引次数: 0