

Prediction of carbon emissions in Shanxi Province based on PSO-BP neural network
-
摘要:
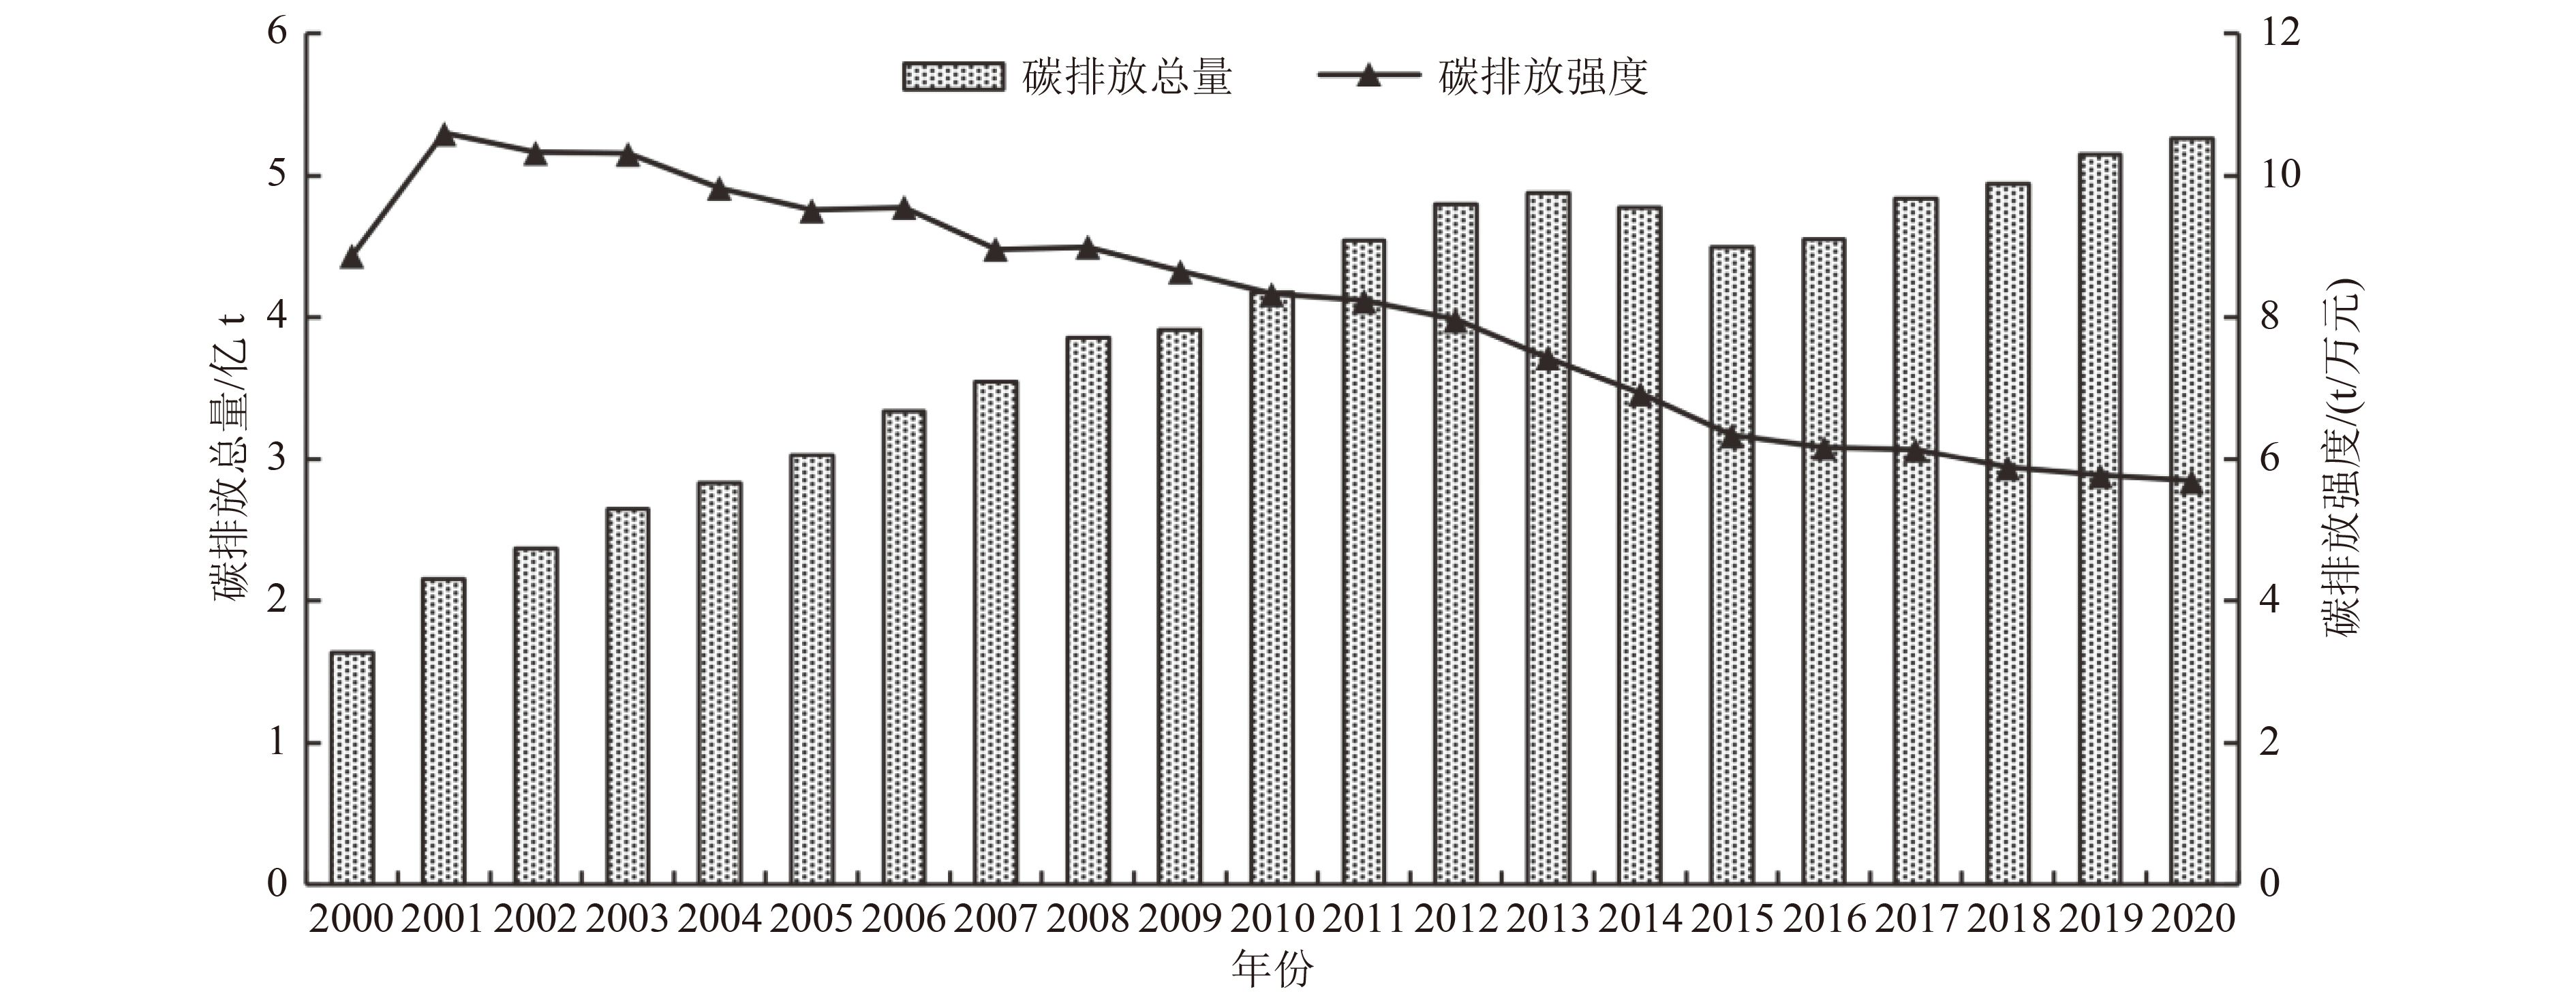
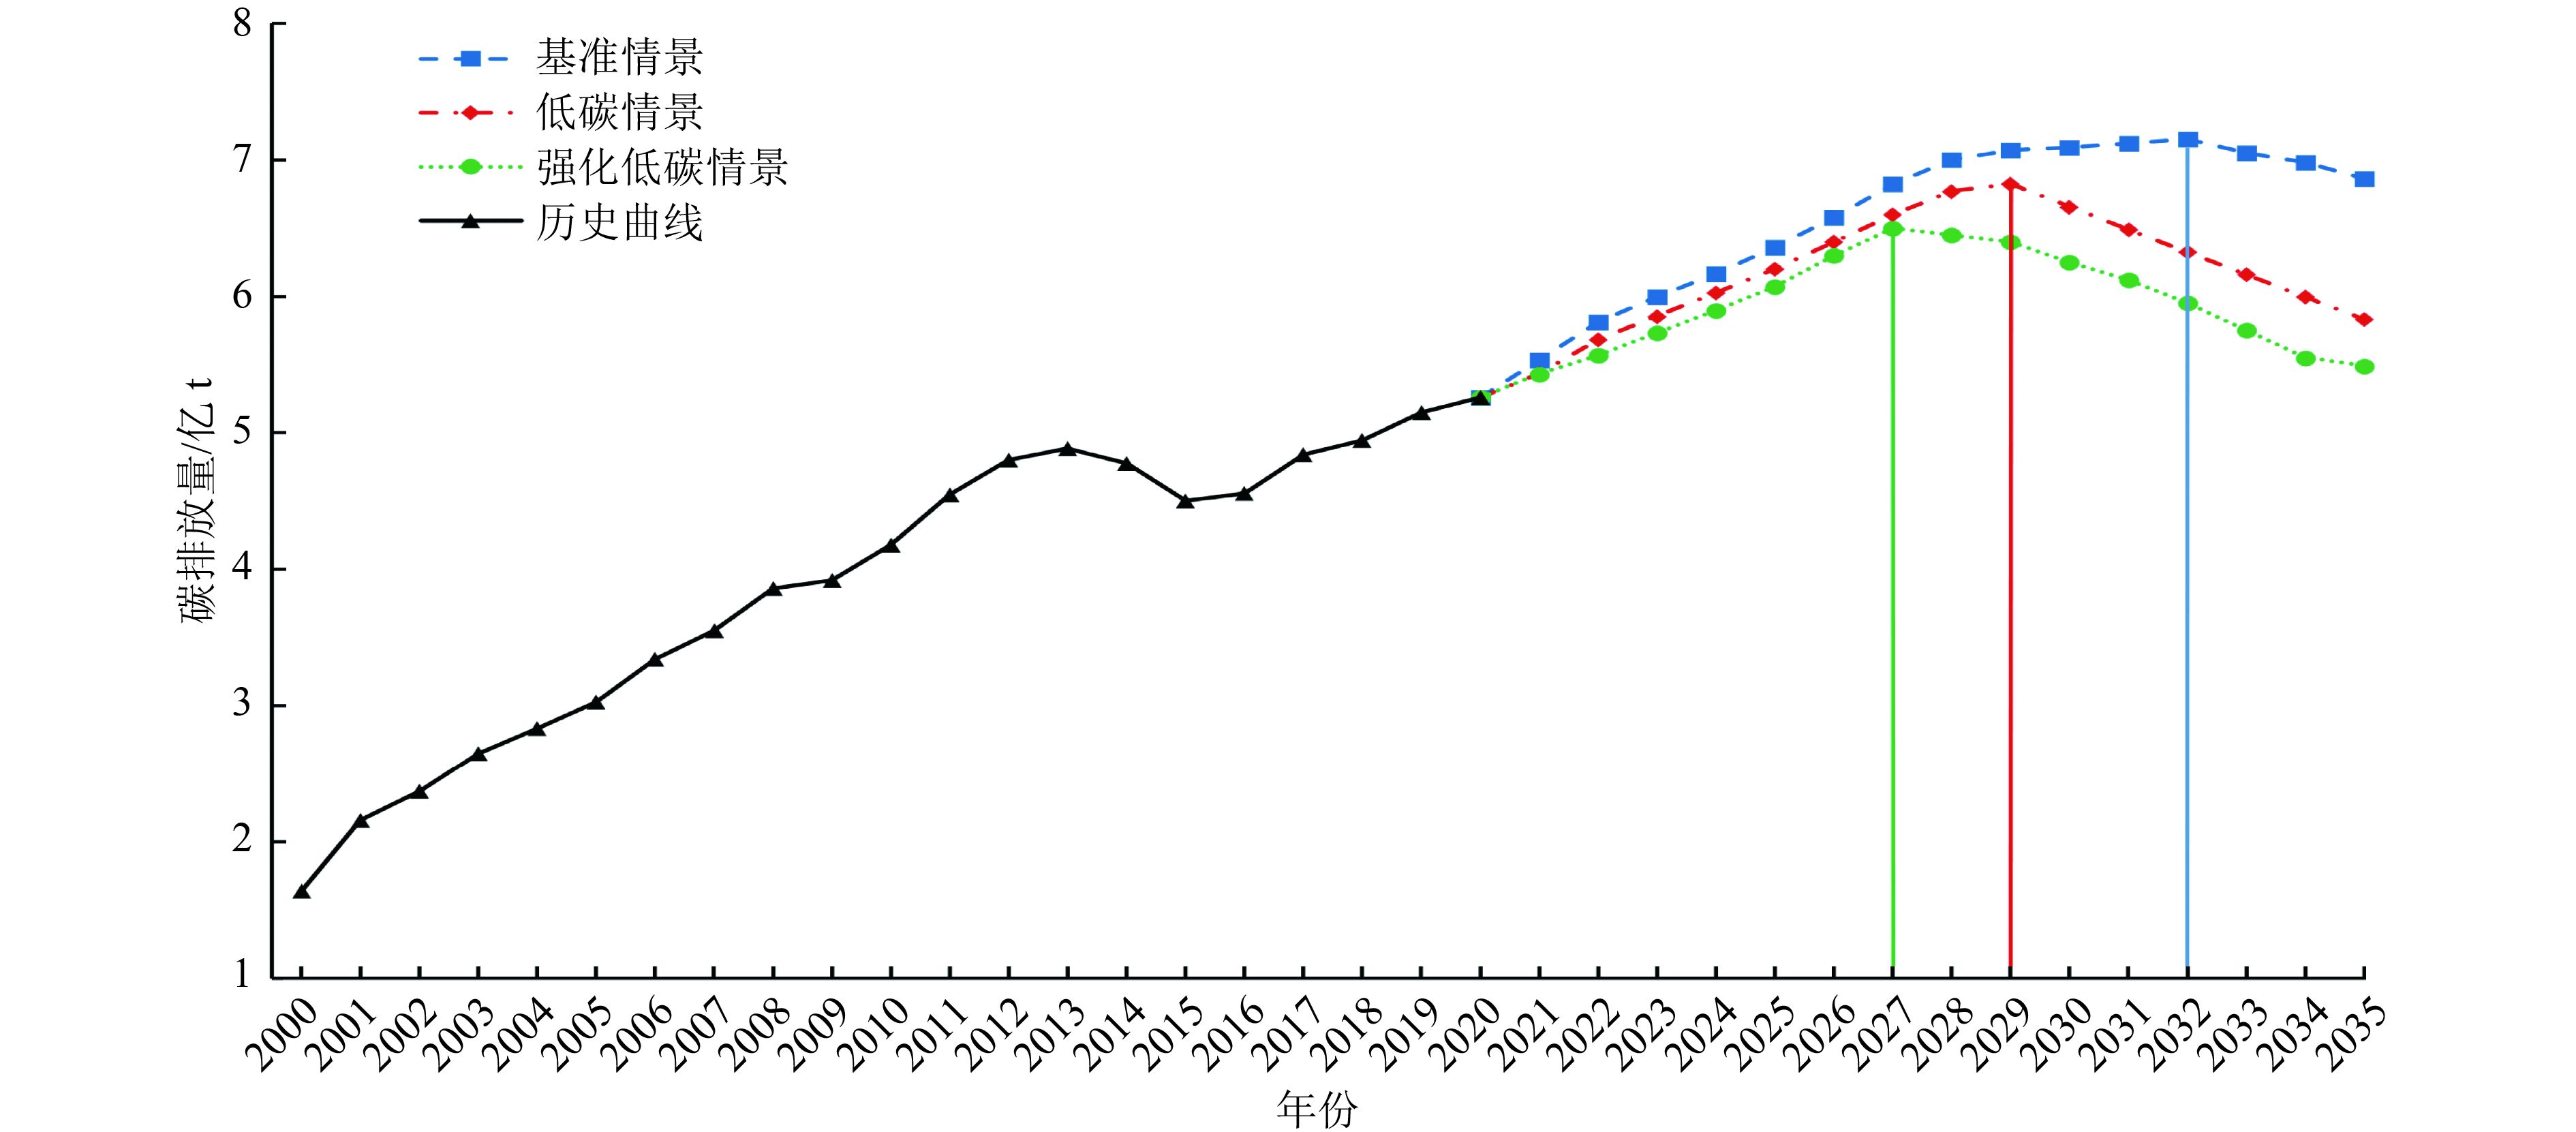
山西作为能源使用和碳排放大省,推动“双碳”战略对全国具有重要示范意义。基于IPCC(政府间气候变化专门委员会)排放系数法测算山西省2000—2020年的碳排放量,运用Tapio脱钩模型分析碳排放与经济发展之间的脱钩关系,利用LMDI法对影响碳排放变化的因素进行分解,采用PSO-BP神经网络模型对山西省的碳排放量进行模拟和预测。结果表明:2000—2020年山西省碳排放量呈增长趋势,碳排放强度呈下降趋势,脱钩系数为0.585,整体处于弱脱钩状态。经济增长是碳排放量增长的决定因素,而产业结构与能源强度的优化调整是抑制碳排放的主导因素。引入PSO(粒子群优化算法)有效提高了BP神经网络的预测精度。预测结果显示,在基准情景、低碳情景和强化低碳情景下,山西省碳排放分别于2032年、2029年和2027年达峰。针对预测结果,提出了相关政策建议。
-
关键词:
- BP神经网络 /
- 粒子群优化算法(PSO) /
- 碳排放 /
- 预测 /
- 山西省
Abstract:Shanxi, as a major province of energy use and carbon emission, has an important demonstration significance for the whole country to promote the "dual carbon" strategy. The carbon emissions of Shanxi Province from 2000 to 2020 were calculated based on IPCC emission coefficient method. Tapio decoupling model was used to analyze the decoupling relationship between carbon emissions and economic development, LMDI method was used to decompose the factors affecting carbon emission changes, and PSO-BP neural network model was used to simulate and forecast the carbon emissions of Shanxi Province. The results showed that the carbon emission in Shanxi Province increased during 2000-2020, while the carbon emission intensity decreased, and the decoupling coefficient was 0.585, indicating a weak decoupling state as a whole. Economic growth was the determining factor of carbon emission growth, and the optimization and adjustment of industrial structure and energy intensity was the leading factor to restrain carbon emission. The introduction of particle swarm optimization (PSO) improved the prediction accuracy of BP neural network effectively. The predicted results showed that carbon emissions in Shanxi Province would peak in 2032, 2029 and 2027 under three scenarios: baseline scenario, low carbon scenario and intensive low carbon scenario, respectively. In view of the forecast results, relevant policy suggestions were put forward.
-
Key words:
- BP neural network /
- particle swarm optimization (PSO) /
- carbon emissions /
- prediction /
- Shanxi Province
-
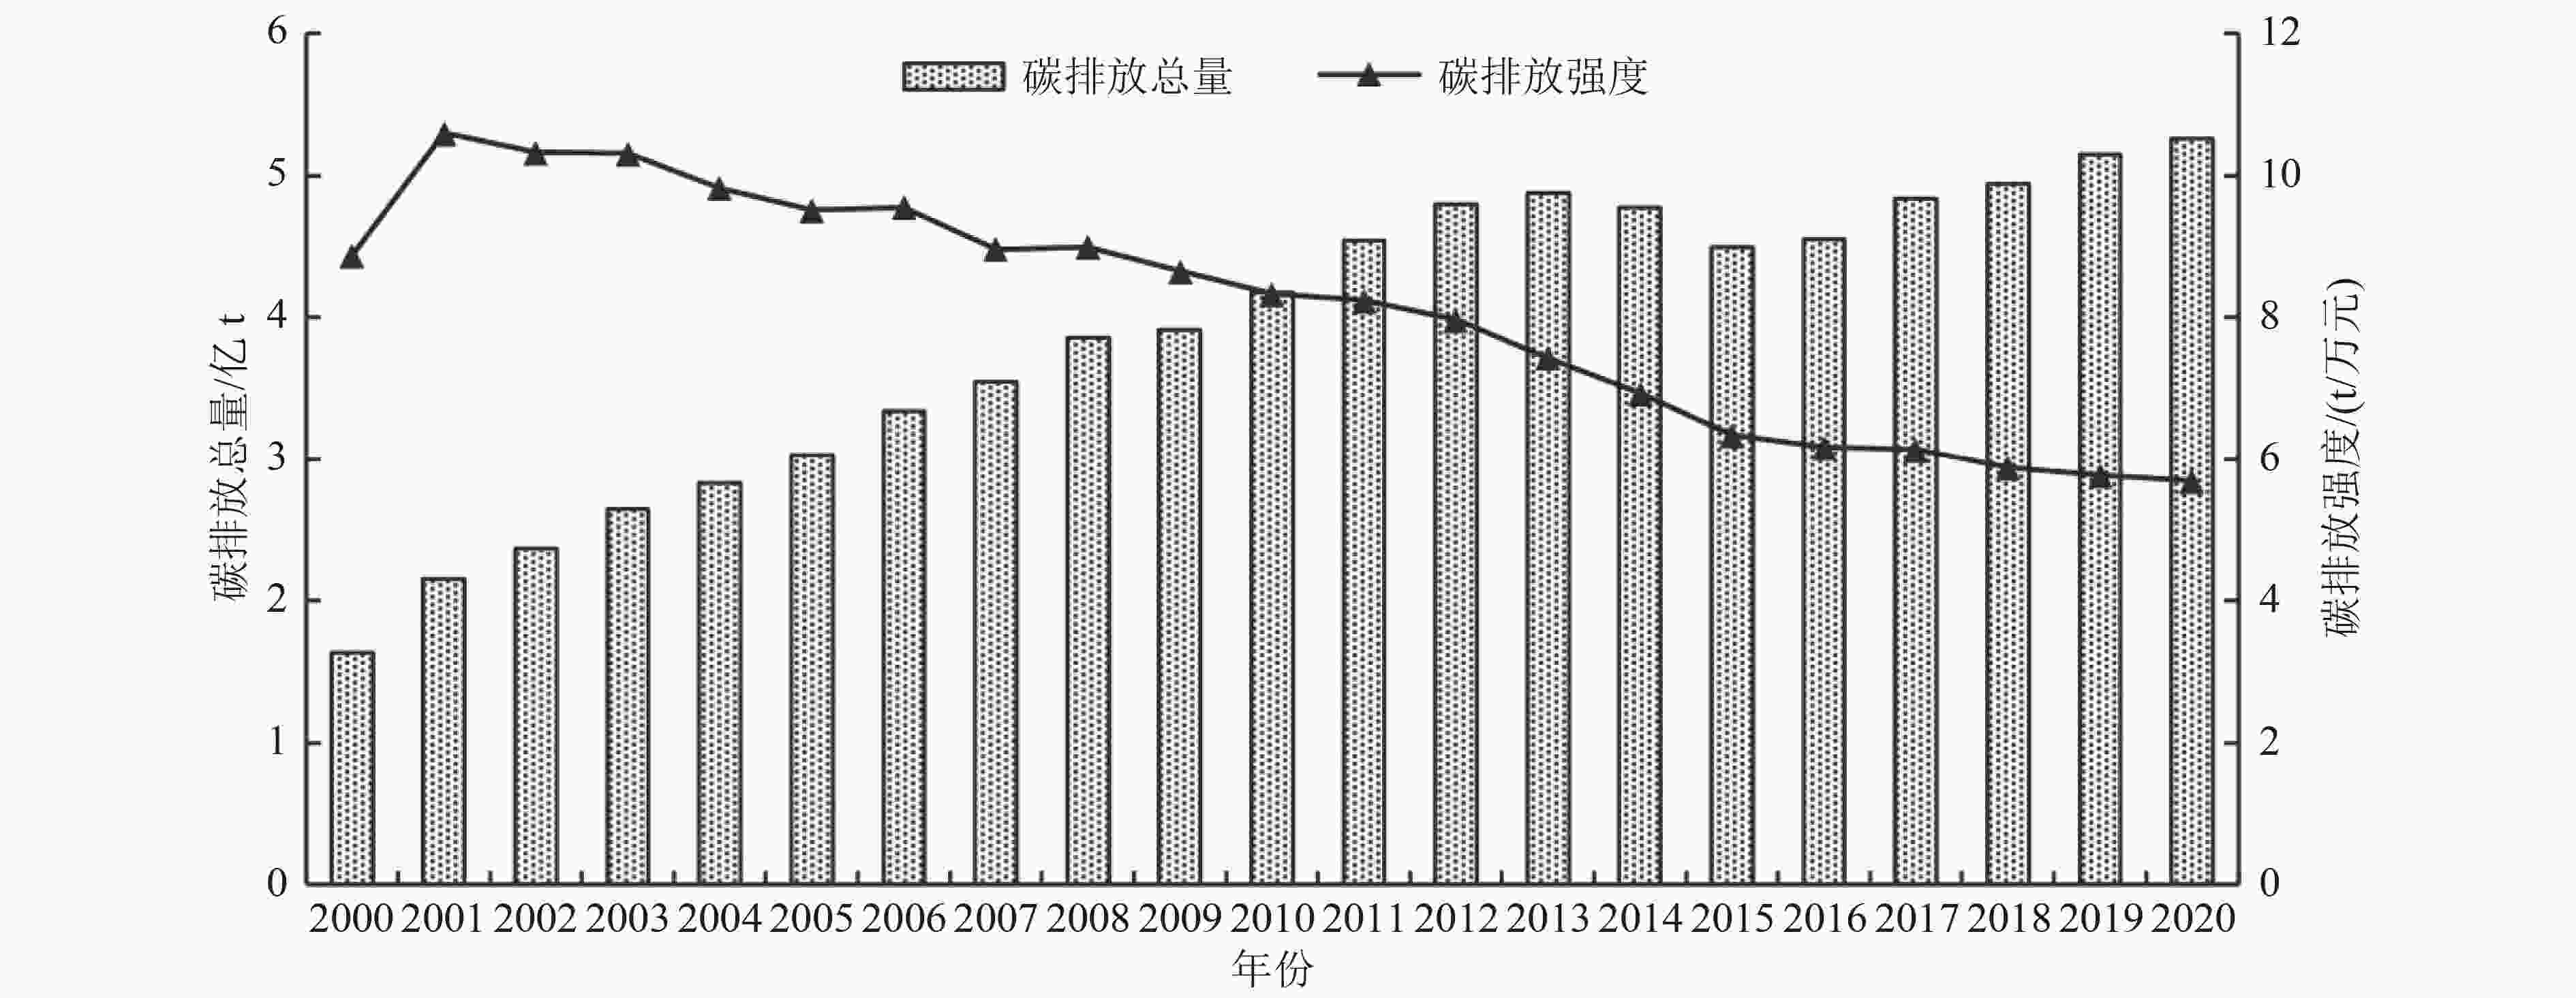
图 2 2000—2020年山西省碳排放情况
Figure 2. Carbon emissions in Shanxi Province from 2000 to 2020

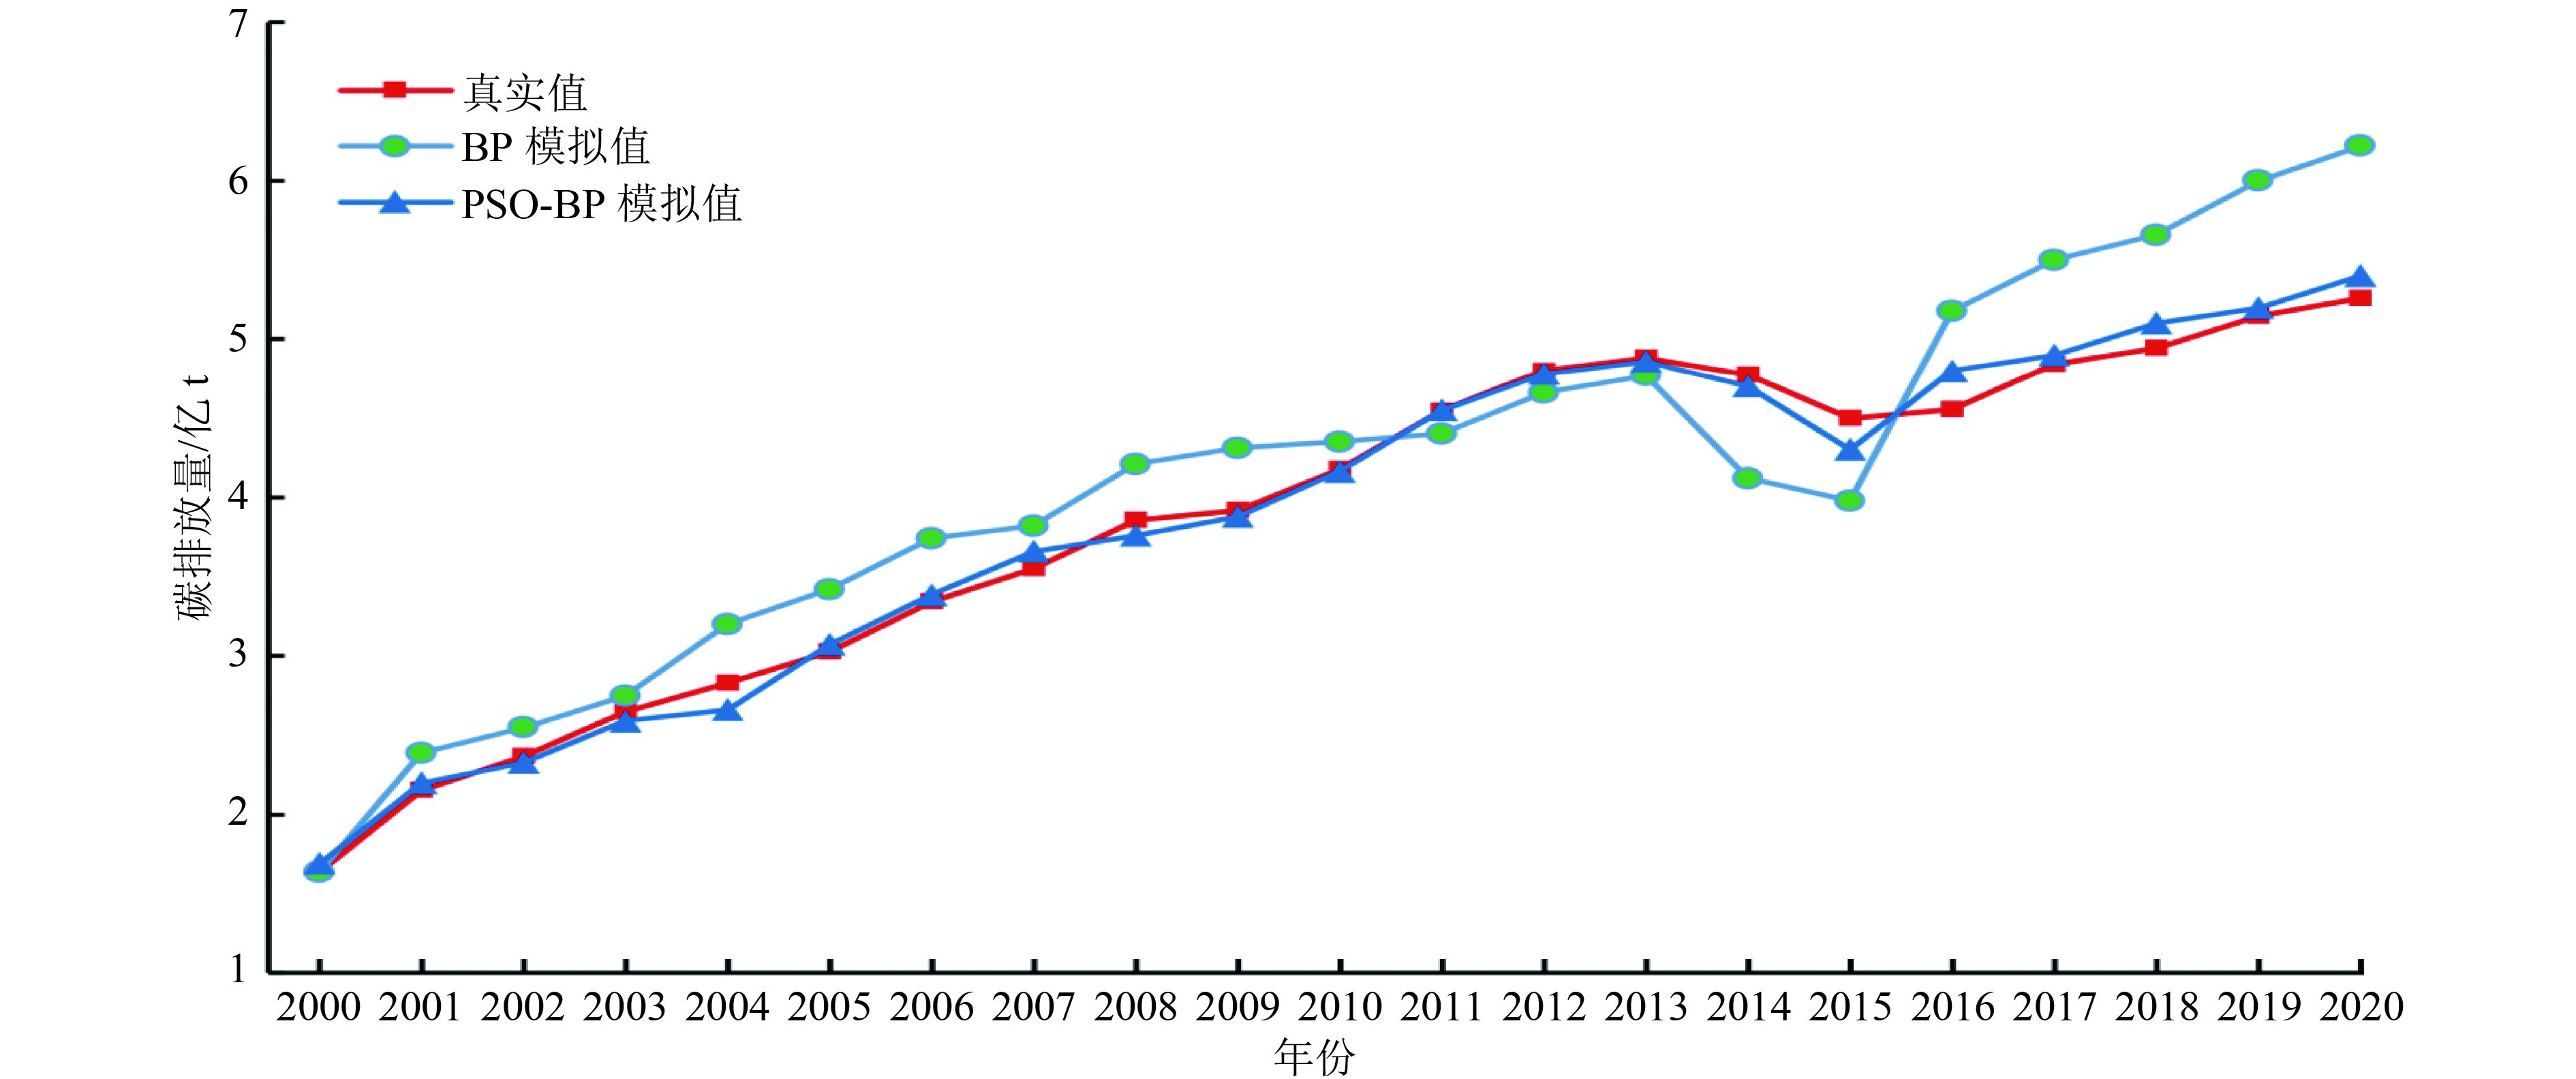
图 3 山西省碳排放量模拟值与真实值
Figure 3. Comparison of simulated and real carbon emissions in Shanxi Province
表 1 脱钩状态分类
Table 1. Decoupling status classification
类型 状态 $\Delta C$ $\Delta G$ UGC 含义 脱钩 强脱钩 − + (−∞,0) 经济增长,碳排放量减少 弱脱钩 + + [0,0.8) 碳排放量增速低于经济增速 衰退脱钩 − − (1.2,+∞) 碳排放量降低速度高于
经济衰退速度负脱钩 强负脱钩 + − (−∞,0) 经济衰退,碳排放量增加 弱负脱钩 − − [0,0.8) 碳排放量降低速度低于
经济衰退速度增长负脱钩 + + (1.2,+∞) 碳排放量增速快于经济增速 连接 增长连接 + + [0.8,1.2] 经济增长,碳排放量增加 衰退连接 − − [0.8,1.2] 经济衰退,碳排放量减少  下载: 导出CSV
表 2 不同能源的碳排放系数
Table 2. Carbon emission coefficient of different energy sources
类型 平均低位
发热值1)单位热值含碳
量/
(t/TJ)碳氧化
率/%碳排放系数/
(t/t)原煤 20 908 26.4 94 1.900 3 洗精煤 26 340 25.4 98 2.405 0 其他洗煤 8 360 25.4 90 0.701 0 型煤 15 440 33.6 90 1.712 0 焦炭 28 440 29.5 93 2.860 9 焦炉煤气 16 746 13.6 99 0.825 2 其他煤气 9 796 12.2 99 0.433 6 其他焦化产品 33 450 29.5 93 3.364 9 汽油 43 070 18.9 98 2.925 1 煤油 43 070 19.6 98 3.033 4 柴油 42 650 20.2 98 3.095 8 燃料油 41 820 21.1 98 3.170 8 液化石油气 50 180 17.2 98 3.101 4 其他石油制品 41 820 20.0 98 3.005 5 天然气 38 460 15.3 99 2.136 0 液化天然气 49 030 15.3 99 2.723 1 1)固体、液体单位为kJ/kg,气体单位为kJ/m3。
下载: 导出CSV
表 3 山西省经济增长与碳排放脱钩状态
Table 3. Status of decoupling between economic growth and carbon emissions in Shanxi Province
年份 $ \Delta C $ $ \Delta G $ UGC $ \mathrm{脱}\mathrm{钩}\mathrm{状}\mathrm{态} $ 2001 0.314 0.101 3.113 扩张负脱钩 2002 0.099 0.129 0.771 弱脱钩 2003 0.118 0.119 0.990 增长连接 2004 0.069 0.122 0.566 弱脱钩 2005 0.070 0.105 0.666 弱脱钩 2006 0.104 0.099 1.046 增长连接 2007 0.062 0.132 0.472 弱脱钩 2008 0.086 0.083 1.041 增长连接 2009 0.015 0.055 0.282 弱脱钩 2010 0.066 0.108 0.613 弱脱钩 2011 0.088 0.100 0.885 增长连接 2012 0.056 0.092 0.606 弱脱钩 2013 0.017 0.090 0.192 弱脱钩 2014 −0.022 0.049 −0.455 强脱钩 2015 −0.057 0.030 −1.913 强脱钩 2016 0.012 0.041 0.295 弱脱钩 2017 0.063 0.068 0.924 增长连接 2018 0.022 0.066 0.329 弱脱钩 2019 0.041 0.061 0.668 弱脱钩 2020 0.022 0.036 0.611 弱脱钩 均值 0.062 0.084 0.585 弱脱钩
下载: 导出CSV
表 4 LMDI碳排放因素分解结果
Table 4. Decomposition results of LMDI carbon emission factors
万t 年份 人口效应
$(\Delta p)$经济增长效应
$(\Delta g) $产业结构效应
$(\Delta v) $能耗强度效应
$(\Delta e) $能源结构效应
($ \Delta s $)综合效应
$(\Delta C) $2001 137.38 1 670.81 148.46 2 766.86 431.27 5 154.78 2002 276.06 4 002.48 657.27 1 667.27 695.15 7 298.23 2003 422.41 6 455.76 1 985.77 649.49 574.49 10 087.92 2004 571.56 9 022.75 2 660.15 −955.58 617.88 11 916.76 2005 721.40 11 361.13 3 760.77 −3 229.73 1 333.27 13 946.84 2006 896.05 14 068.00 4 234.19 −3 000.66 834.51 17 032.09 2007 1 050.07 17 328.72 4 886.46 −5 084.95 936.48 19 116.78 2008 1 224.60 19 878.65 4 907.45 −5 246.53 1 419.84 22 184.00 2009 1 360.21 21 303.15 3 852.04 −5 266.43 1 532.43 22 781.40 2010 2 503.27 23 621.86 4 958.97 −6 374.13 664.17 25 374.14 2011 2 526.67 27 385.98 5 792.55 −7 490.51 853.90 29 068.59 2012 2 496.53 30 873.70 4 914.36 −7 638.88 958.75 31 604.46 2013 2 397.21 33 496.29 3 973.19 −8 293.88 861.60 32 434.40 2014 2 307.26 34 336.78 2 754.11 −9 095.35 1 042.10 31 344.89 2015 2 144.90 33 903.57 −1 090.63 −7 721.92 1 369.01 28 604.94 2016 2 146.28 35 556.41 −1 783.74 −7 399.25 629.95 29 149.65 2017 2 192.75 38 748.05 −313.96 −8 928.03 311.70 32 010.51 2018 2 144.78 40 924.88 −1 108.29 −9 332.00 431.82 33 061.19 2019 2 134.40 43 363.64 −1 316.55 −9 822.89 667.72 35 026.31 2020 2 107.94 44 999.20 −1 665.93 −9 936.84 703.39 36 207.76 累计贡献率/% 5.82 124.28 −4.60 −27.44 1.94 100
下载: 导出CSV
表 5 相关性分析结果
Table 5. Correlation analysis results
驱动因素 含义 |r| 人口 人口数量 0.863** 经济增长 人均GDP 0.962** 产业结构 第二产业增加值/GDP 0.878** 能耗强度 能源消耗量/GDP 0.924** 能源结构 煤炭消费量/能源消耗量 0.955** 注:**表示在 0.01 水平相关性显著。
下载: 导出CSV
表 6 2种模型预测效果对比
Table 6. Comparison of prediction effects of two models
预测模型 BP PSO-BP R2 0.953 4 0.990 6 MAE/亿t 0.392 8 0.080 0 RMSE/亿t 0.228 7 0.102 9 MAPE/% 9.59 2.15
下载: 导出CSV
表 7 山西省各驱动因素变化率
Table 7. Change rate of various driving factors in Shanxi Province
情景 变化速率 p g v e s 基准情景 高 高 低 低 低 低碳情景 中 中 中 中 中 强化低碳情景 低 中 高 高 高
下载: 导出CSV
-
[1] ZHAO L T, ZHAO T, YUAN R. Scenario simulations for the peak of provincial household CO2 emissions in China based on the STIRPAT model[J]. Science of the Total Environment,2022,809:151098. doi: 10.1016/j.scitotenv.2021.151098 [2] 韩楠, 罗新宇.多情景视角下京津冀碳排放达峰预测与减排潜力[J]. 自然资源学报,2022,37(5):1277-1288. doi: 10.31497/zrzyxb.20220512HAN N, LUO X Y. Carbon emission peak prediction and reduction potential in Beijing-Tianjin-Hebei region from the perspective of multiple scenarios[J]. Journal of Natural Resources,2022,37(5):1277-1288. doi: 10.31497/zrzyxb.20220512 [3] 李建豹, 黄贤金, 揣小伟, 等. “双碳”背景下长三角地区碳排放情景模拟研究[J]. 生态经济, 2022,38(11):13-18. LI J B, HUANG X J, CHUAI X W, et al. Scenario simulation of carbon emissions in the Yangtze River Delta under the background of "dual carbon" [J]. Ecological Economy, 2022,38(11):13-18. [4] 刘茂辉, 翟华欣, 刘胜楠, 等.基于LMDI方法和STIRPAT模型的天津市碳排放量对比分析[J]. 环境工程技术学报,2023,13(1):63-70.LIU M H, ZHAI H X, LIU S N, et al. Comparative analysis of carbon emissions in Tianjin based on LMDI method and STIRPAT model[J]. Journal of Environmental Engineering Technology,2023,13(1):63-70. [5] 左朝晖, 李绍康, 杨津津, 等.基于GA-BP神经网络的页岩气开发区域水资源承载力研究[J]. 环境工程技术学报,2021,11(1):194-201.ZUO Z H, LI S K, YANG J J, et al. Research on water resources carrying capacity of shale gas development area based on GA-BP neural network[J]. Journal of Environmental Engineering Technology,2021,11(1):194-201. [6] 张梦迪, 徐庆, 刘振鸿, 等.基于动态滑动窗口BP神经网络的水质时间序列预测[J]. 环境工程技术学报,2022,12(3):809-815.ZHANG M D, XU Q, LIU Z H, et al. Prediction of water quality time series based on the dynamic sliding window BP neural network model[J]. Journal of Environmental Engineering Technology,2022,12(3):809-815. [7] 赵金辉, 李景顺, 王潘乐, 等. 基于 Lasso-BP神经网络模型的河南省碳达峰路径研究[J]. 环境工程, 2022,40(12):151-156. ZHAO J H, LI J S, WANG P L, et al. A study of carbon peak paths in Henan Province based on Lasso regression - BP neural network model[J]. Environmental Engineering, 2022,40(12):151-156. [8] 董聪, 董秀成, 蒋庆哲, 等.《巴黎协定》背景下中国碳排放情景预测: 基于BP神经网络模型[J]. 生态经济,2018,34(2):18-23.DONG C, DONG X C, JIANG Q Z, et al. Scenarios prediction of the carbon dioxide emissions in China under the background of the Paris agreement based on BP neural network[J]. Ecological Economy,2018,34(2):18-23. [9] 习立洋, 吴娜, 吉永军, 等.基于PSO-BP神经网络的船体分段任务包工时定额模型[J]. 船舶工程,2020,42(2):135-141.XI L Y, WU N, JI Y J, et al. Man-hour quota model of hull block working package based on PSO-BP neural network[J]. Ship Engineering,2020,42(2):135-141. [10] 田野. 基于神经网络和粒子群优化算法的供热负荷预测研究[D]. 北京: 北京建筑大学, 2022. [11] 赵江燕, 朱宇恩, 马建超, 等.山西省能源消费碳排放清单和影响因素研究[J]. 太原理工大学学报,2022,53(6):989-996.ZHAO J Y, ZHU Y E, MA J C, et al. Research on carbon emission inventory based on energy activities and the driving factors in Shanxi[J]. Journal of Taiyuan University of Technology,2022,53(6):989-996. [12] 郭沛, 连慧君, 丛建辉.山西省碳排放影响因素分解: 基于LMDI模型的实证研究[J]. 资源开发与市场,2016,32(3):308-312.GUO P, LIAN H J, CONG J H. Decompose of carbon emissions influence factors in Shanxi Province: empirical research based on LMDI model[J]. Resource Development & Market,2016,32(3):308-312. [13] 关敏捷, 袁艳红, 冉木希, 等.基于STIRPAT模型的山西省能源碳排放影响因素及峰值预测[J]. 中国煤炭,2021,47(9):48-55.GUAN M J, YUAN Y H, RAN M X, et al. Influencing factors and peak forecast of energy carbon emission in Shanxi based on STIRPAT model[J]. China Coal,2021,47(9):48-55. [14] 杜俊慧, 张克勇, 张雪姣.山西省碳排放影响因素分解及峰值预测[J]. 中北大学学报(自然科学版),2018,39(3):334-343.DU J H, ZHANG K Y, ZHANG X J. Study on influence factors of carbon emission and prediction of peak value in Shanxi Province[J]. Journal of North University of China (Natural Science Edition),2018,39(3):334-343. [15] 朱宇恩, 李丽芬, 贺思思, 等.基于IPAT模型和情景分析法的山西省碳排放峰值年预测[J]. 资源科学,2016,38(12):2316-2325.ZHU Y E, LI L F, HE S S, et al. Peak year prediction of Shanxi Province’s carbon emissions based on IPAT modeling and scenario analysis[J]. Resources Science,2016,38(12):2316-2325. [16] IPCC. 2006 IPCC guidelines for national greenhouse gas inventories[EB/OL]. (2019-09-12)[2023-03-01]. http://www.ipcc-nggip.iges.or.jp/public/2006gl/chinese/index.html. [17] 蔡博峰, 朱松丽, 于胜民, 等.《IPCC 2006年国家温室气体清单指南2019修订版》解读[J]. 环境工程,2019,37(8):1-11.CAI B F, ZHU S L, YU S M, et al. The interpretation of 2019 refinement to the 2006 IPCC guidelines for national greenhouse gas inventory[J]. Environmental Engineering,2019,37(8):1-11. [18] PETRI T. Towards a theory of decoupling: degrees of decoupling in the EU and the case of road traffic in Finland between 1970 and 2001 [J]. Transport Policy, 2005, 12 (2). [19] 张型芳, 罗宏, 吕连宏.碳排放与经济增长的协调性分析[J]. 环境工程技术学报,2017,7(4):517-524.ZHANG X F, LUO H, LÜ L H. Coordination analysis on carbon emission and economic growth[J]. Journal of Environmental Engineering Technology,2017,7(4):517-524. [20] 谌伟, 李荷华.LMDI分解方法在碳排放领域用法探讨[J]. 生态经济,2015,31(8):93-96.CHEN W, LI H H. Discussion on application of LMDI for carbon emissions[J]. Ecological Economy,2015,31(8):93-96. [21] ANG B W. Decomposition analysis for policy making in energy: which is the preferred method[J]. Energy Policy,2004,32(9):1131-1139. doi: 10.1016/S0301-4215(03)00076-4 [22] 杨存满, 鞠佳伟, 袁芳, 等.基于PSO-BP神经网络的水厂智能消毒预测模型[J]. 中国给水排水,2022,38(3):57-61.YANG C M, JU J W, YUAN F, et al. Research on intelligent disinfection prediction model of waterworks based on PSO-BP neural network[J]. China Water & Wastewater,2022,38(3):57-61. [23] 唐晓灵, 刘嘉敏.基于PSO-LSTM网络模型的建筑碳排放峰值预测[J]. 科技管理研究,2023,43(1):191-198.TANG X L, LIU J M. Forecast of peak carbon emissions of buildings based on PSO-LSTM model[J]. Science and Technology Management Research,2023,43(1):191-198. [24] PAO H T, TSAI C M. Modeling and forecasting the CO2 emissions, energy consumption, and economie growth in Brazil[J]. Energy,2011,36(5):2450-2458. doi: 10.1016/j.energy.2011.01.032 [25] 李心萍, 苏时鹏, 张雅珊, 等.福建省碳排放预测与碳达峰路径分析[J]. 资源开发与市场,2023,39(2):139-147.LI X P, SU S P, ZHANG Y S, et al. Carbon emission prediction and carbon peak path analysis in Fujian Province[J]. Resource Development & Market,2023,39(2):139-147. [26] 秦艳, 王东燕, 杨美艳, 等.山西省“十四五”煤炭消费总量控制目标与对策研究[J]. 中国煤炭,2021(9):41-47.QIN Y, WANG D Y, YANG M Y, et al. Discussion on the goals and countermeasures of total coal consumption control in Shanxi during the 14th Five-Year Plan[J]. China Coal,2021(9):41-47. ⊕ -

 下载:
下载:

 点击查看大图
计量
- 文章访问数: 393
- HTML全文浏览量: 149
- PDF下载量: 88
- 被引次数: 0