

Spatio-temporal variation characteristics and influencing factors of ozone in three major urban agglomerations in China from 2015 to 2020
-
摘要:
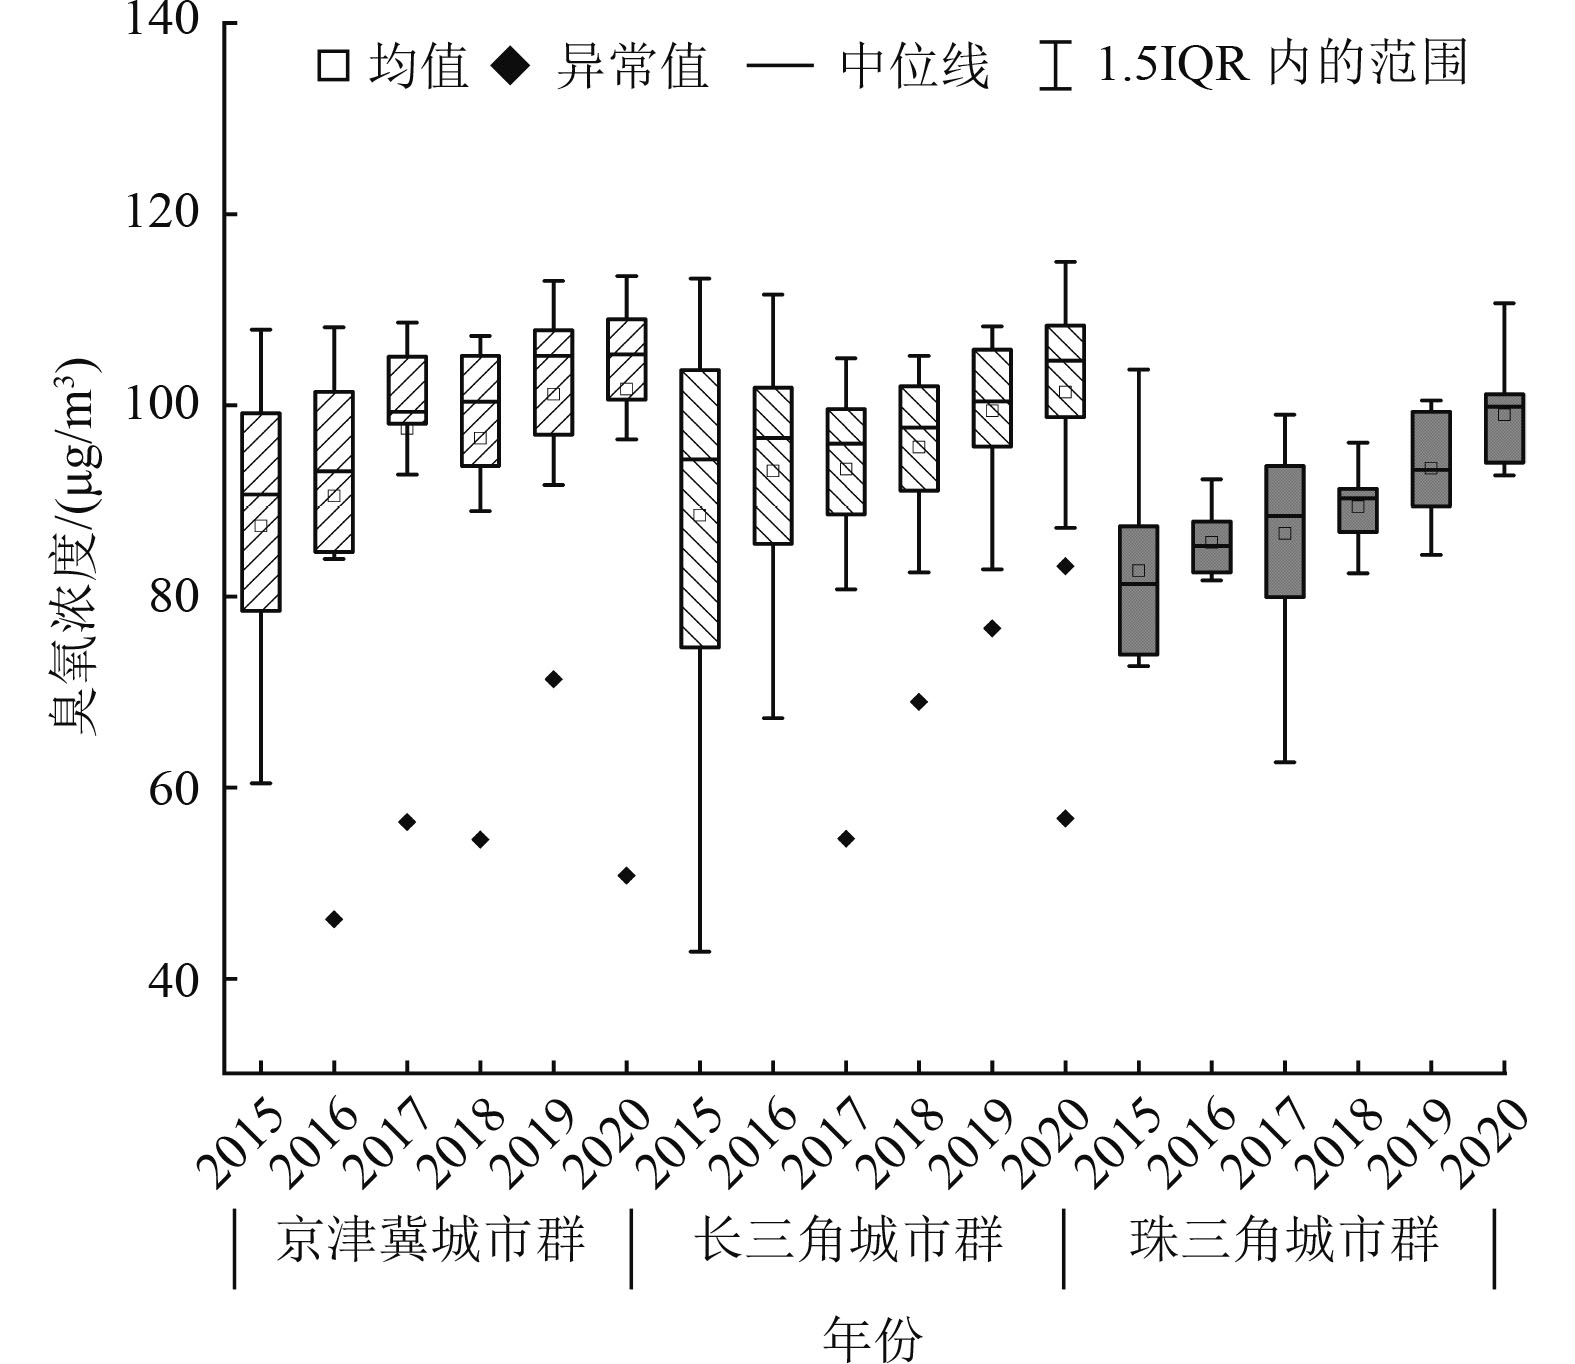
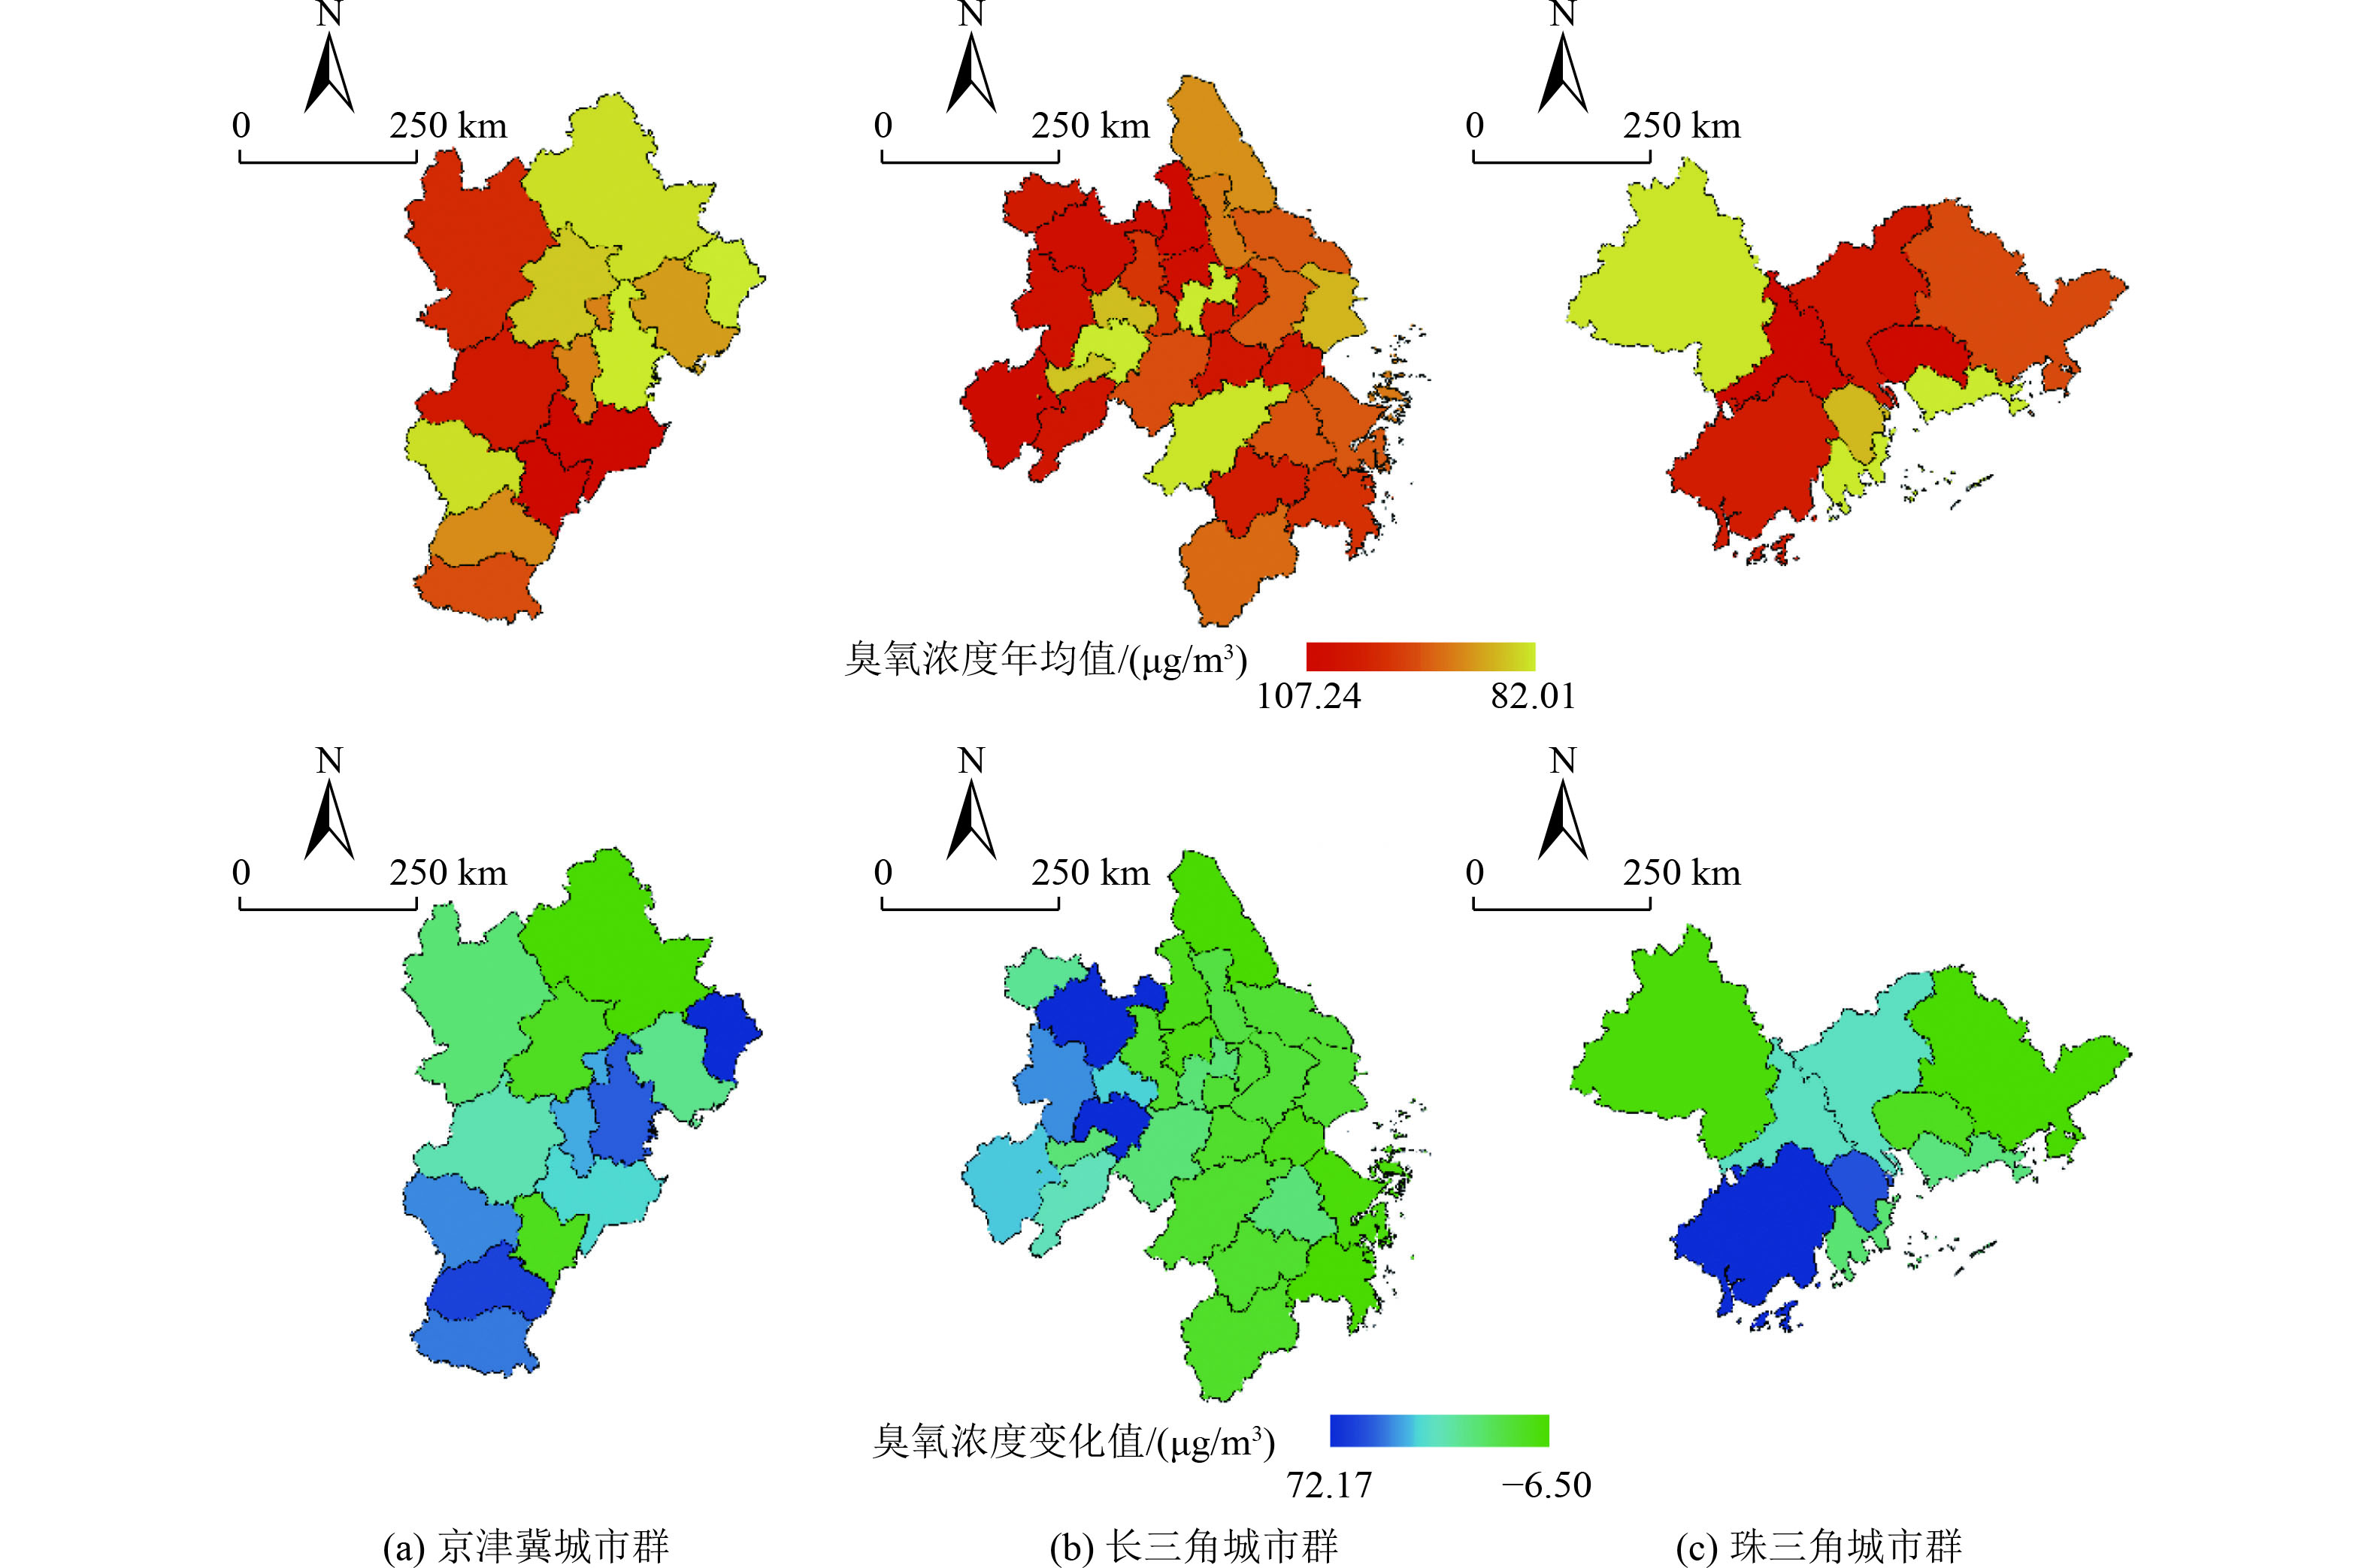
针对中国京津冀、长三角、珠三角三大城市群,分析了2015—2020年三大城市群的臭氧浓度时空变化特征,基于随机森林模型和地理探测器模型分别研究了影响其时间变化和空间变化的主要因子。结果表明:1)2015—2020年三大城市群臭氧浓度整体呈逐年升高的时空演变特征。其臭氧变化率存在中部向南北递减的趋势,即长三角(3.4%)>京津冀(2.9%)>珠三角(2.1%);臭氧浓度平均值呈北高南低的空间变化特征,即京津冀(98.3 μg/m3)>长三角(96.7 μg/m3)>珠三角(90.5 μg/m3)。2)温度、风速、人均GDP和能源消耗量不仅是影响三大城市群臭氧浓度时间变化的主要因子,而且与臭氧浓度存在着阈值效应。3)能源消耗量和人均GDP是影响三大城市群臭氧浓度空间变化的主要因子,其对臭氧浓度空间变化的解释率均超过36%。今后关于城市群臭氧的防控应更关注经济发达地区,并通过重点监测和预警高耗能区等手段,达到城市群臭氧防治效果。
Abstract:The spatio-temporal variation characteristics of ozone concentration in the three major urban agglomerations of Beijing-Tianjin-Hebei, Yangtze River Delta, and Pearl River Delta in China from 2015 to 2020 were analyzed, and the main factors affecting temporal and spatial changes were studied based on random forest model and geographical detector model. The results showed that: 1) From 2015 to 2020, the temporal and spatial evolution characteristics of ozone concentration values of the three urban agglomerations showed an increasing trend year by year, and the ozone variation rate showed a trend of "decreasing from the central to the south": Yangtze River Delta (3.4%) > Beijing-Tianjin-Hebei (2.9%) > Pearl River Delta (2.1%). The spatial variation characteristics of the average ozone concentration were "high in the north and low in the south": Beijing-Tianjin-Hebei (98.3 μg/m3) > Yangtze River Delta (96.7 μg/m3) > Pearl River Delta (90.5 μg/m3). 2) Temperature, wind speed, GDP, and energy consumption were not only the main factors affecting the temporal variation of ozone in the three urban agglomerations, but also had a threshold effect on ozone concentration. 3) Energy consumption and GDP were the main factors affecting the spatial change of ozone concentration in the three urban agglomerations, and their interpretation rates were more than 36%. Therefore, for ozone prevention and control in urban agglomerations more attention should be paid to economically developed areas, and key monitoring and early warning should be carried out in high energy consuming areas to achieve the effectiveness of ozone prevention and control in urban agglomerations.
-
Key words:
- urban agglomerations /
- ozone /
- machine learning /
- geographical detector /
- spatio-temporal changes
-

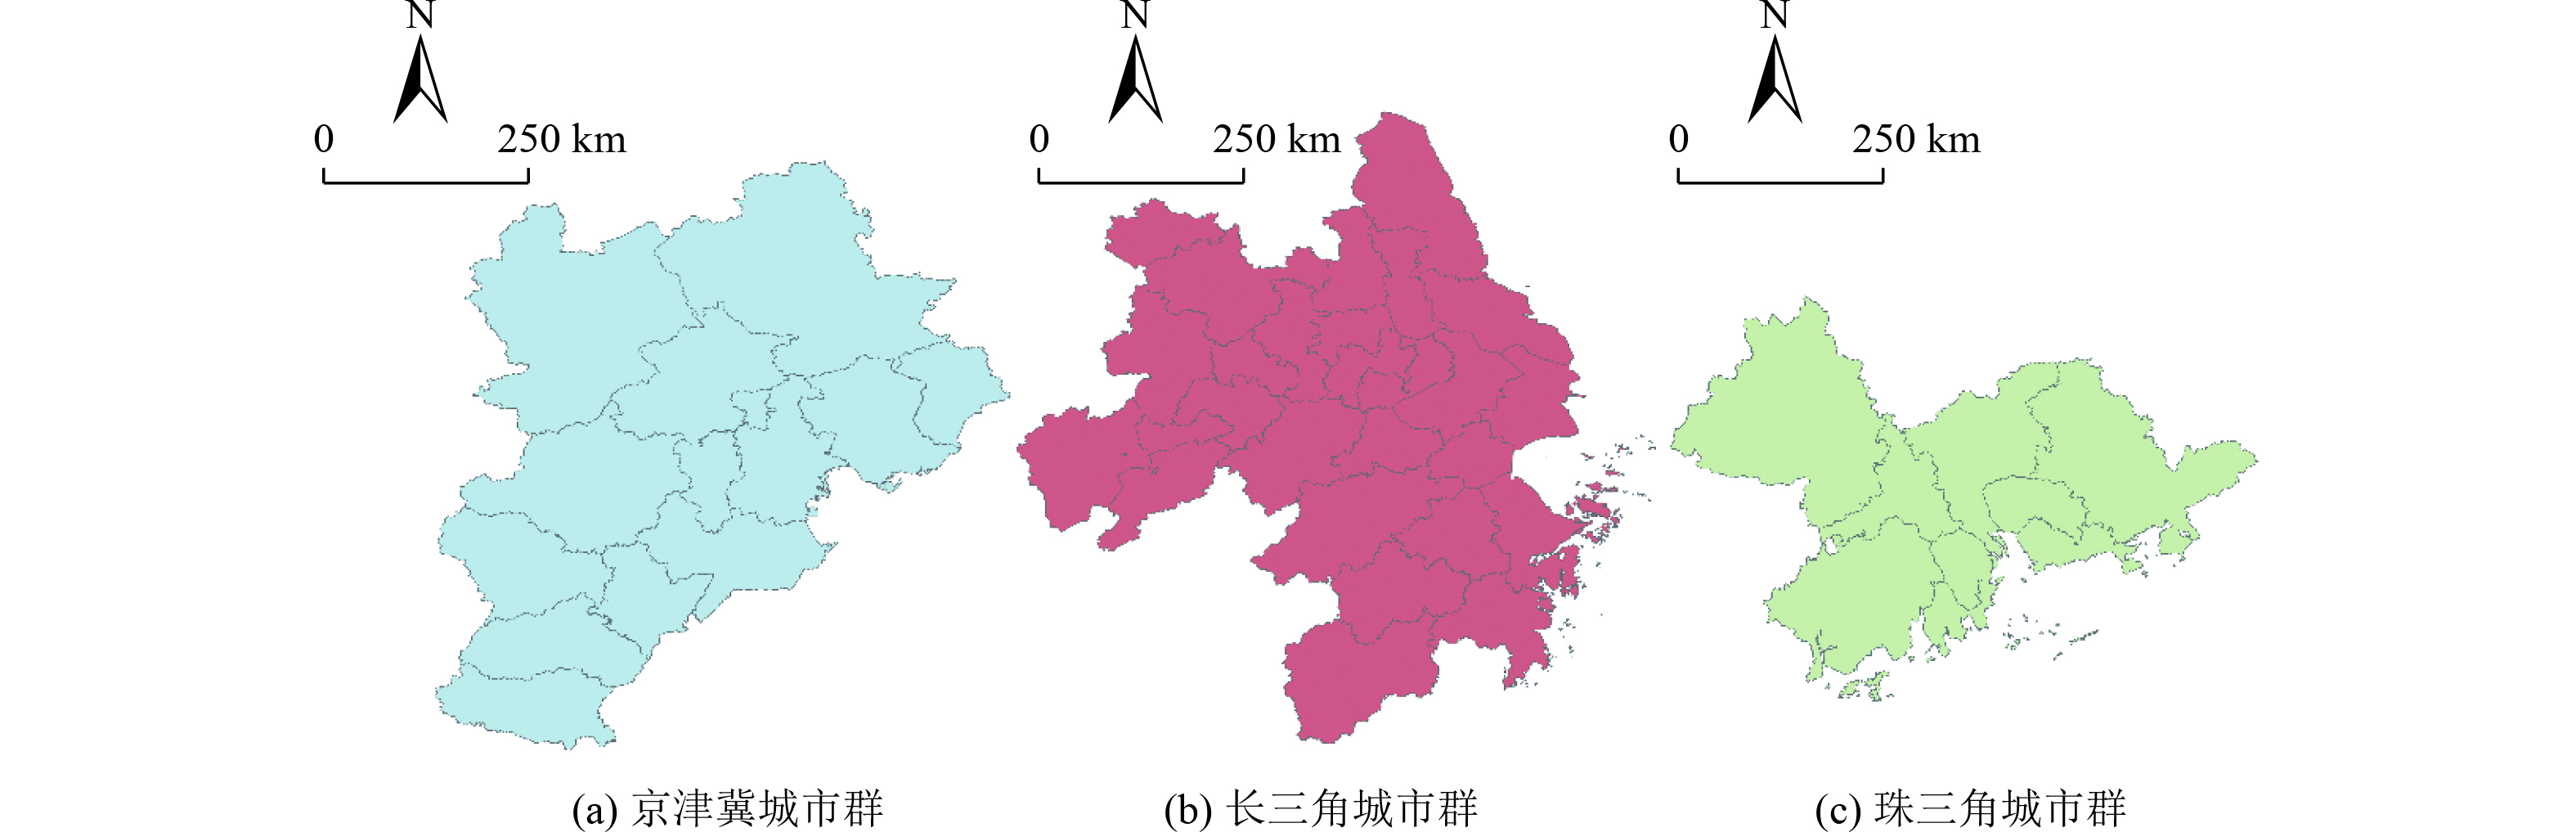
图 1 三大城市群的研究区域
Figure 1. Map of the study area of the three major urban agglomerations

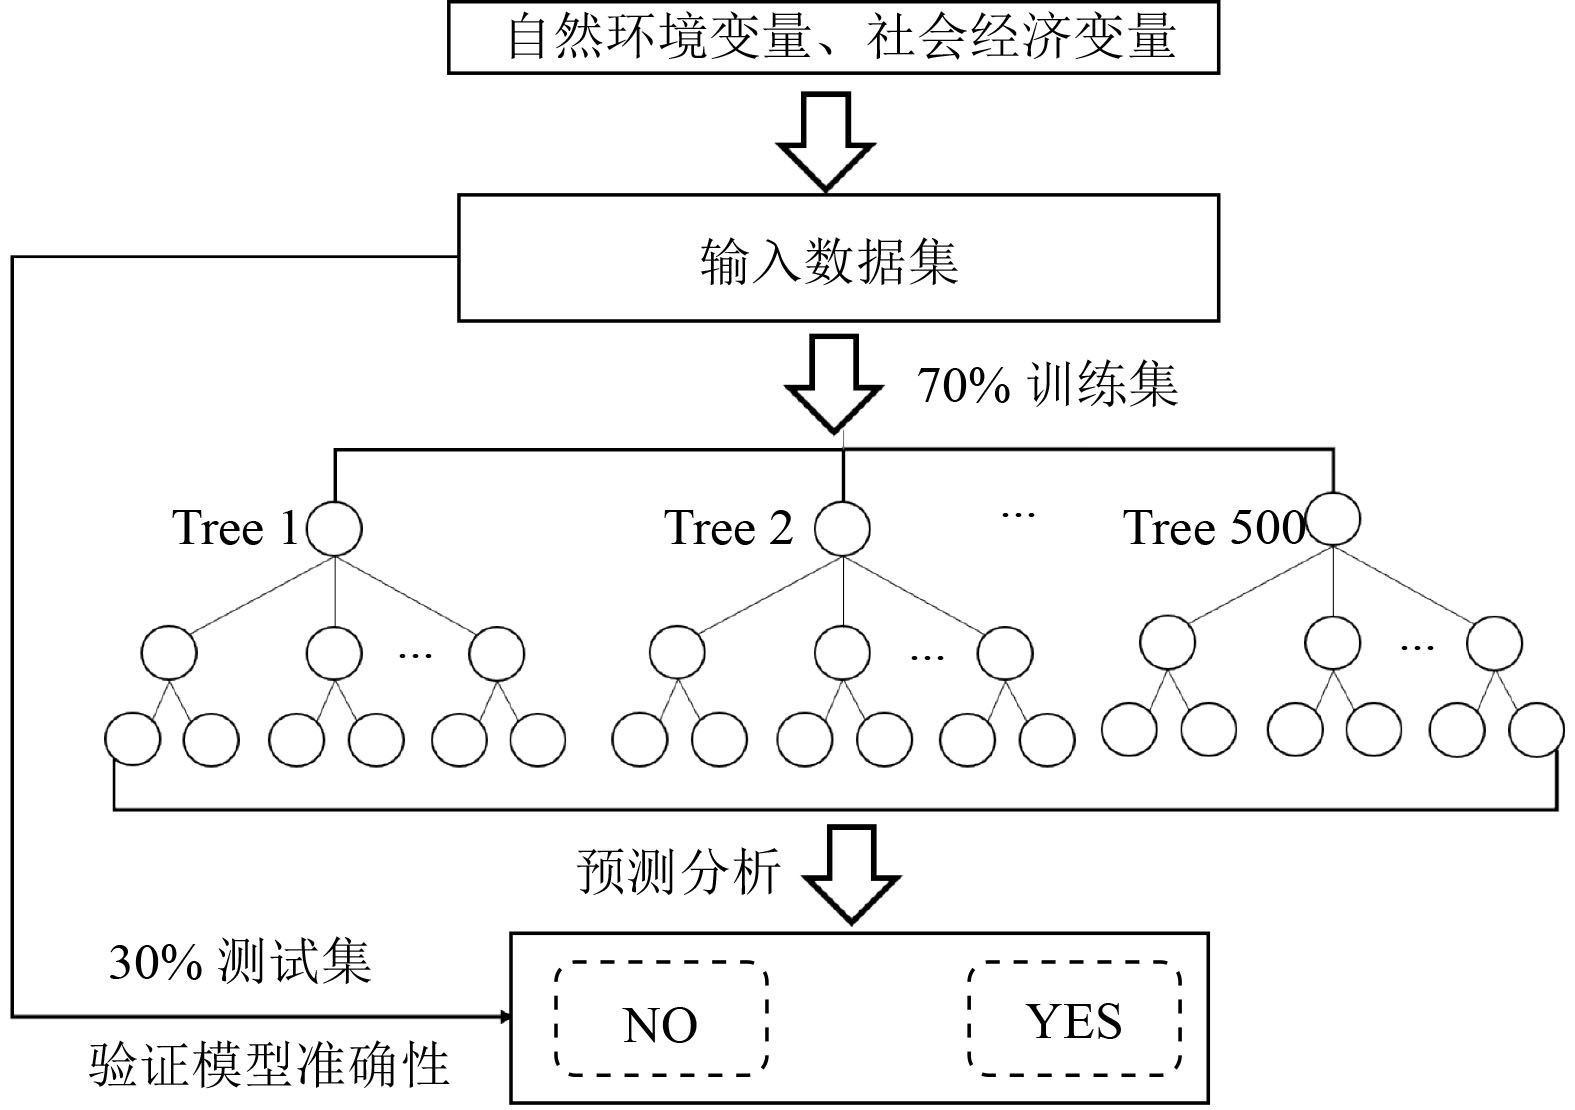
图 2 三大城市群臭氧浓度随机森林模型示意
Figure 2. Schematic diagram of ozone random forest model in the three major urban agglomerations

图 3 2015—2020年三大城市群臭氧浓度时间变化
Figure 3. Temporal changes of ozone in the three major urban agglomerations from 2015 to 2020

图 4 2015—2020年三大城市群臭氧浓度空间变化
Figure 4. Spatial changes of ozone in the three major urban agglomerations from 2015 to 2020

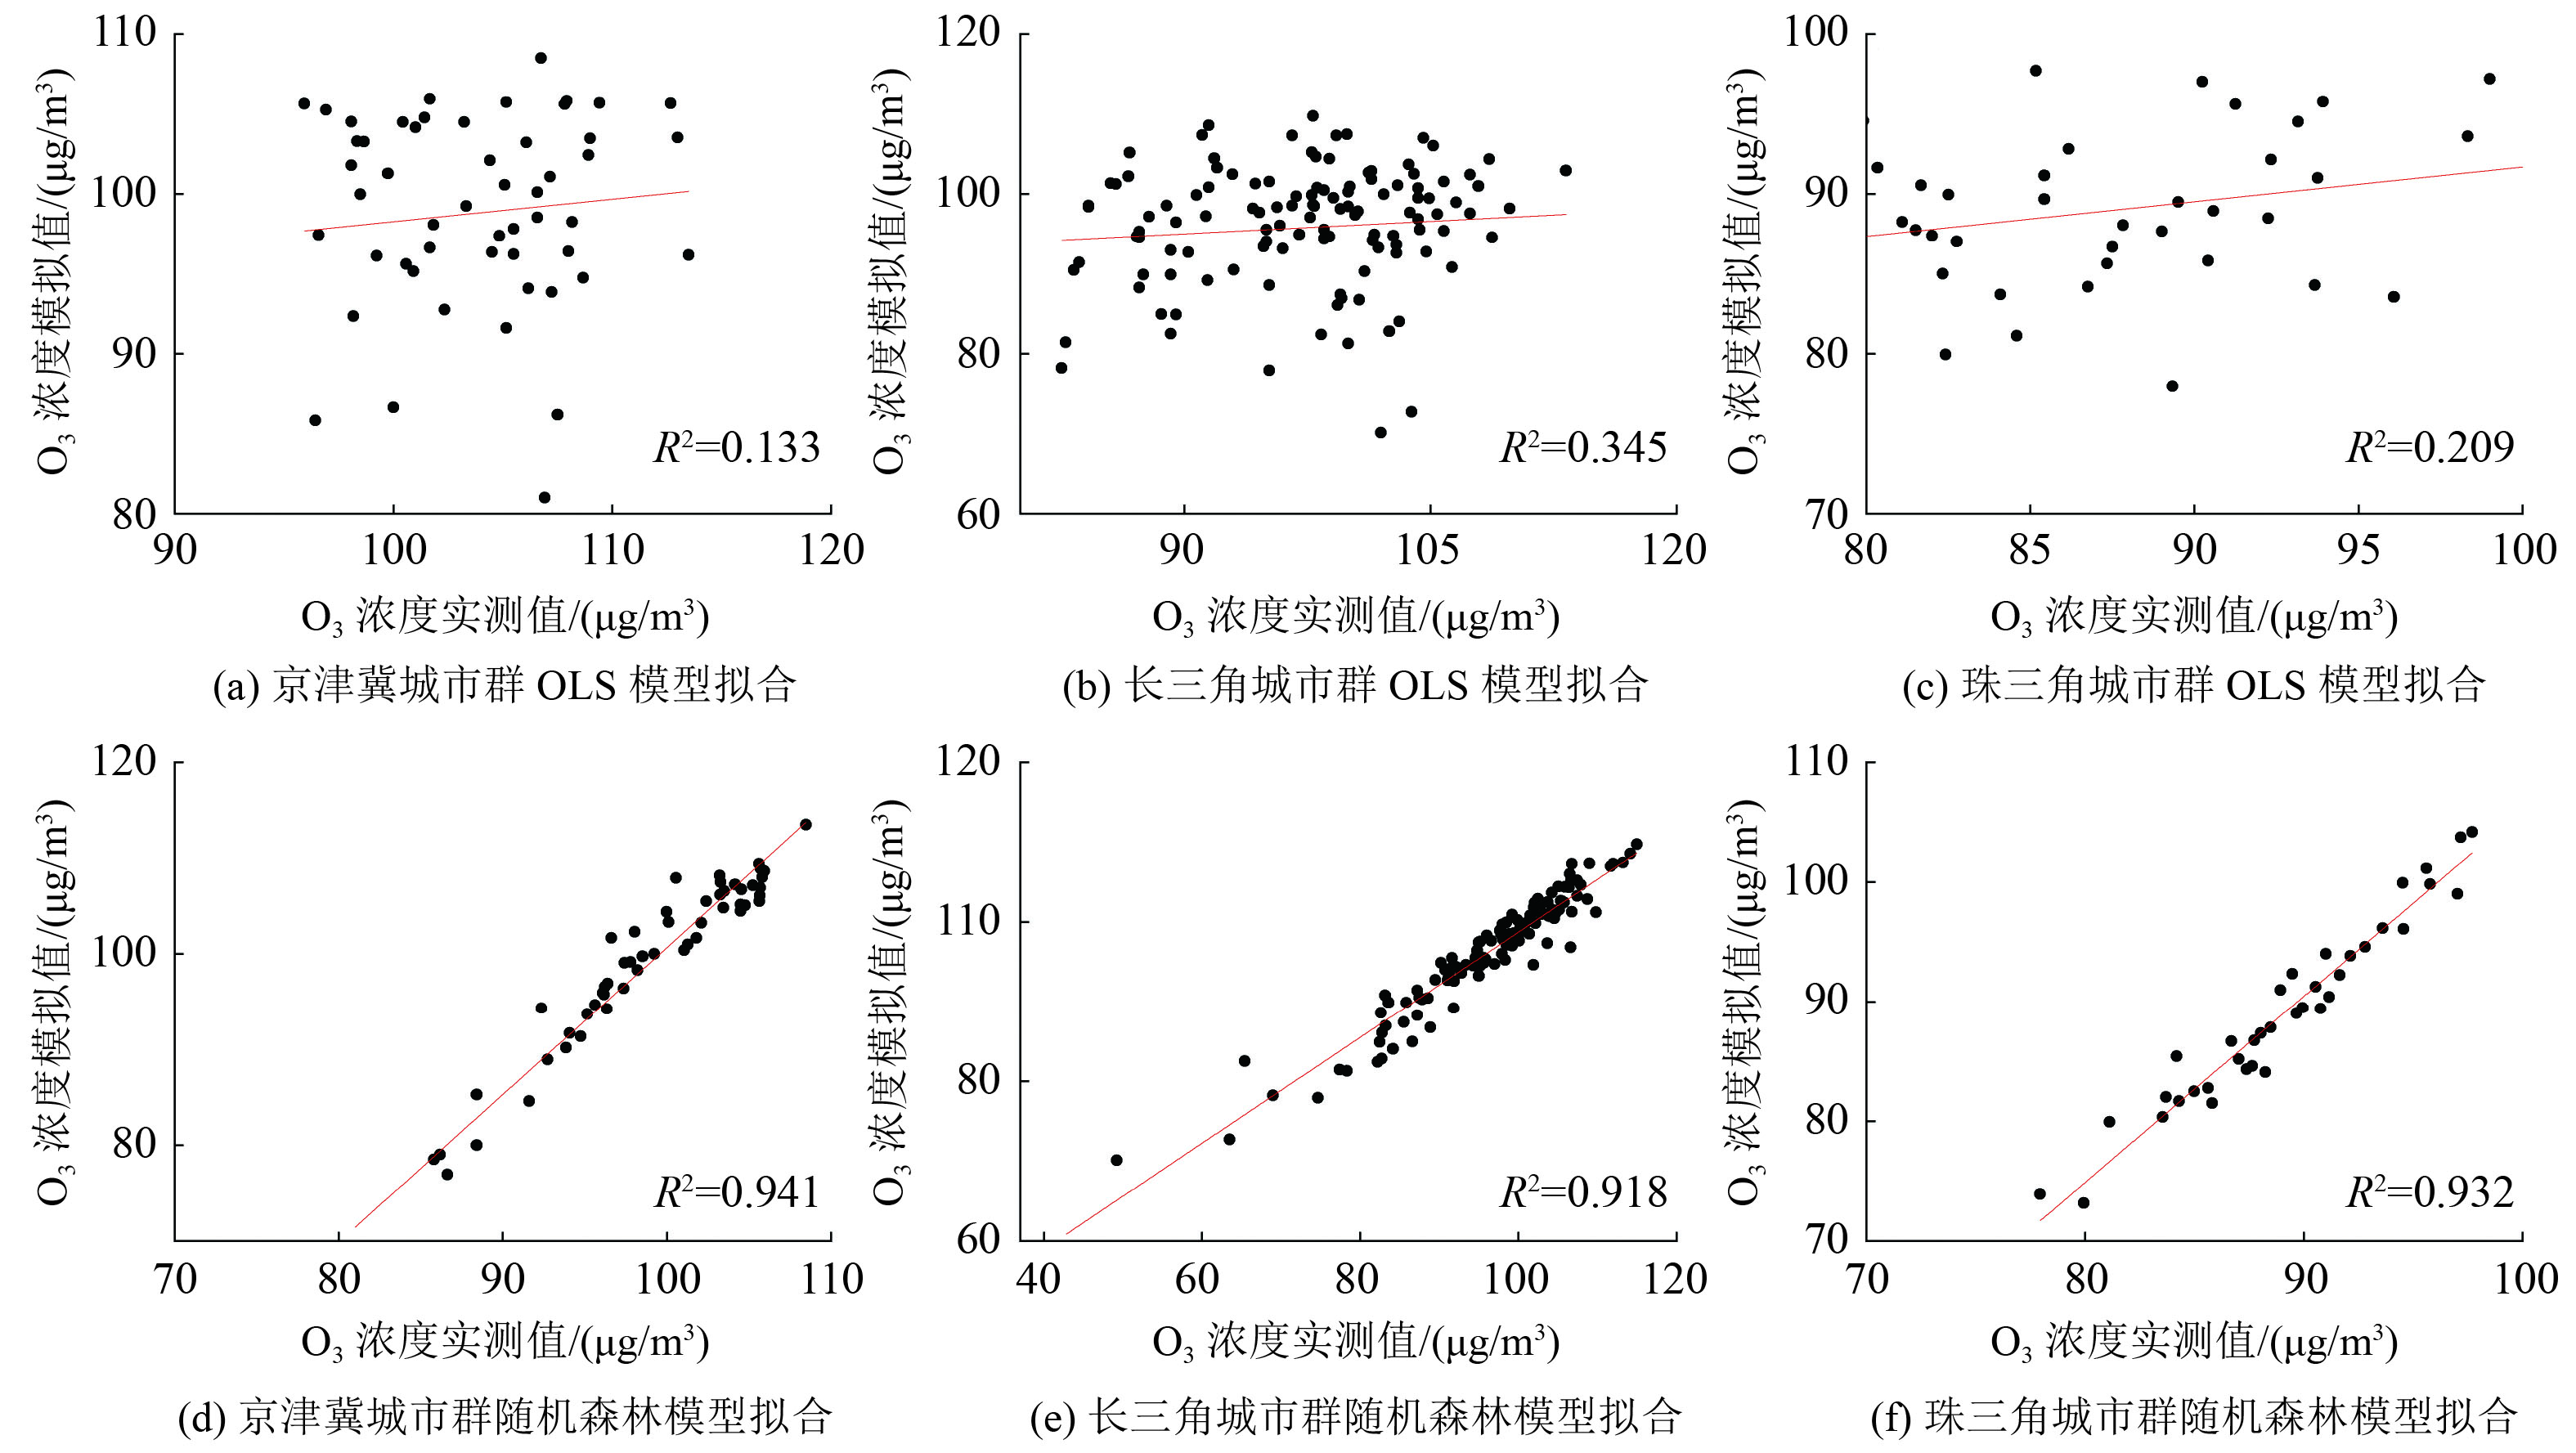
图 5 多元线性回归与随机森林回归拟合
Figure 5. Fitting with multiple linear regression and random forest regression
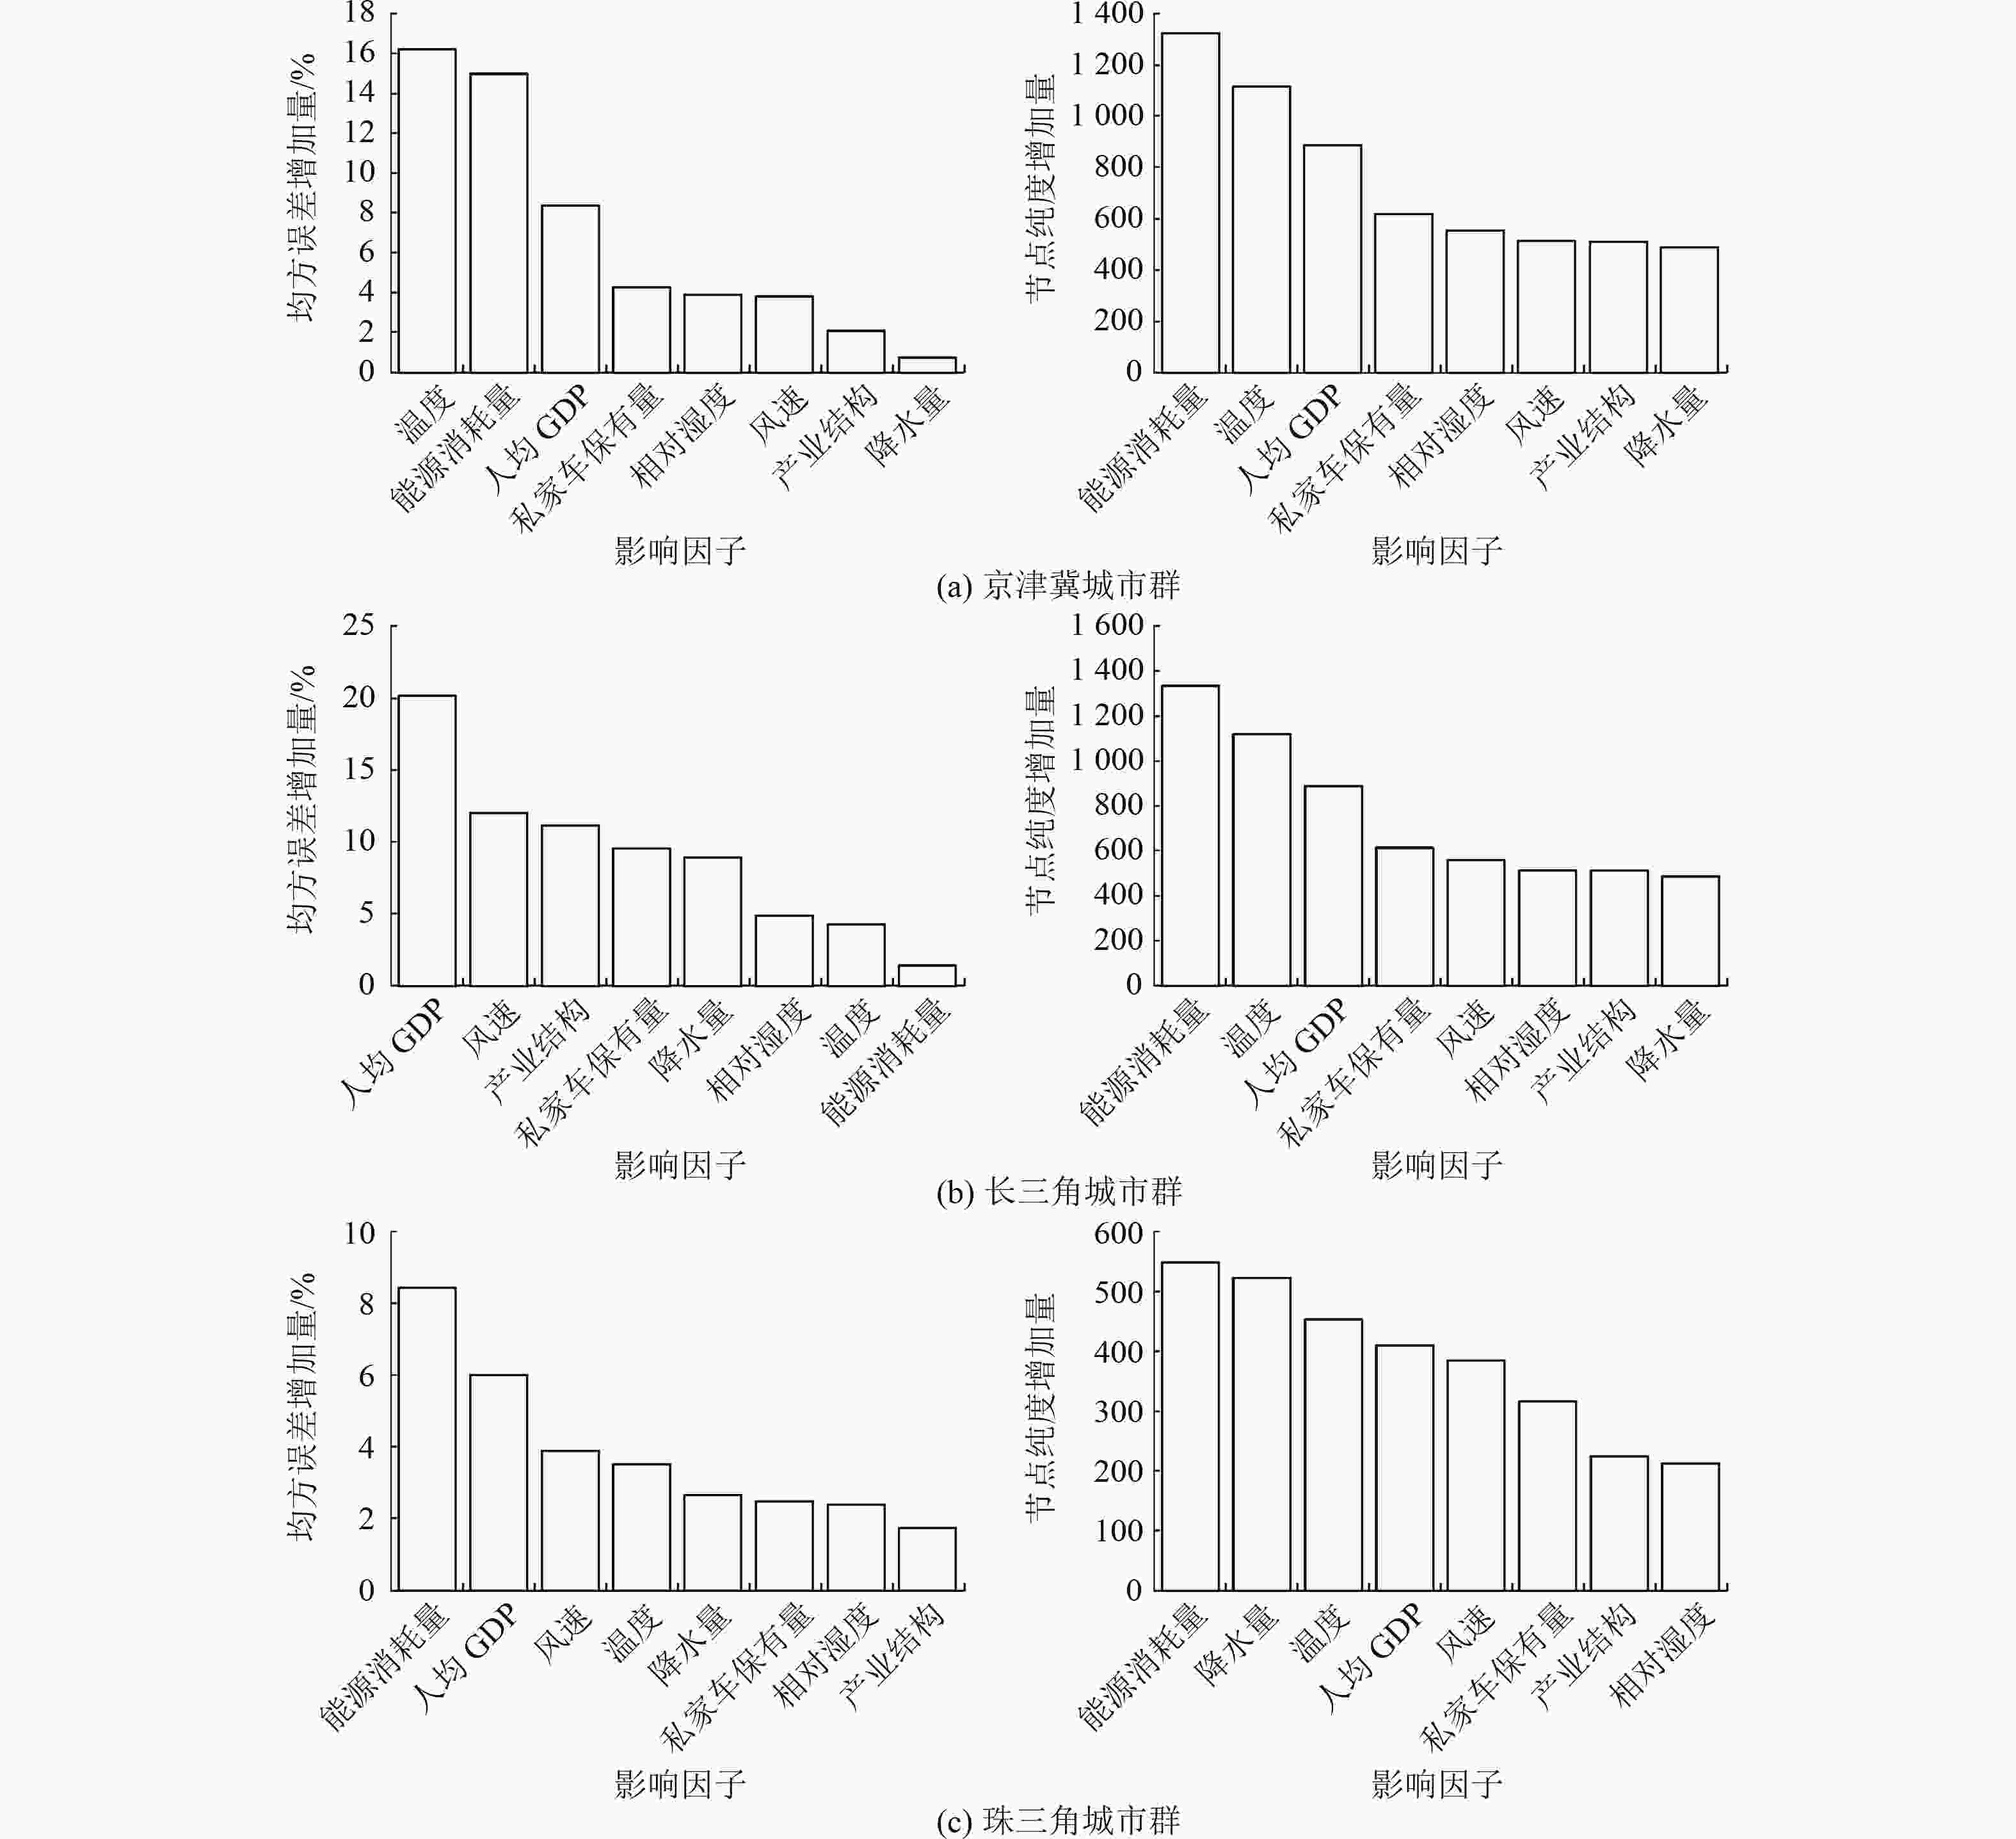
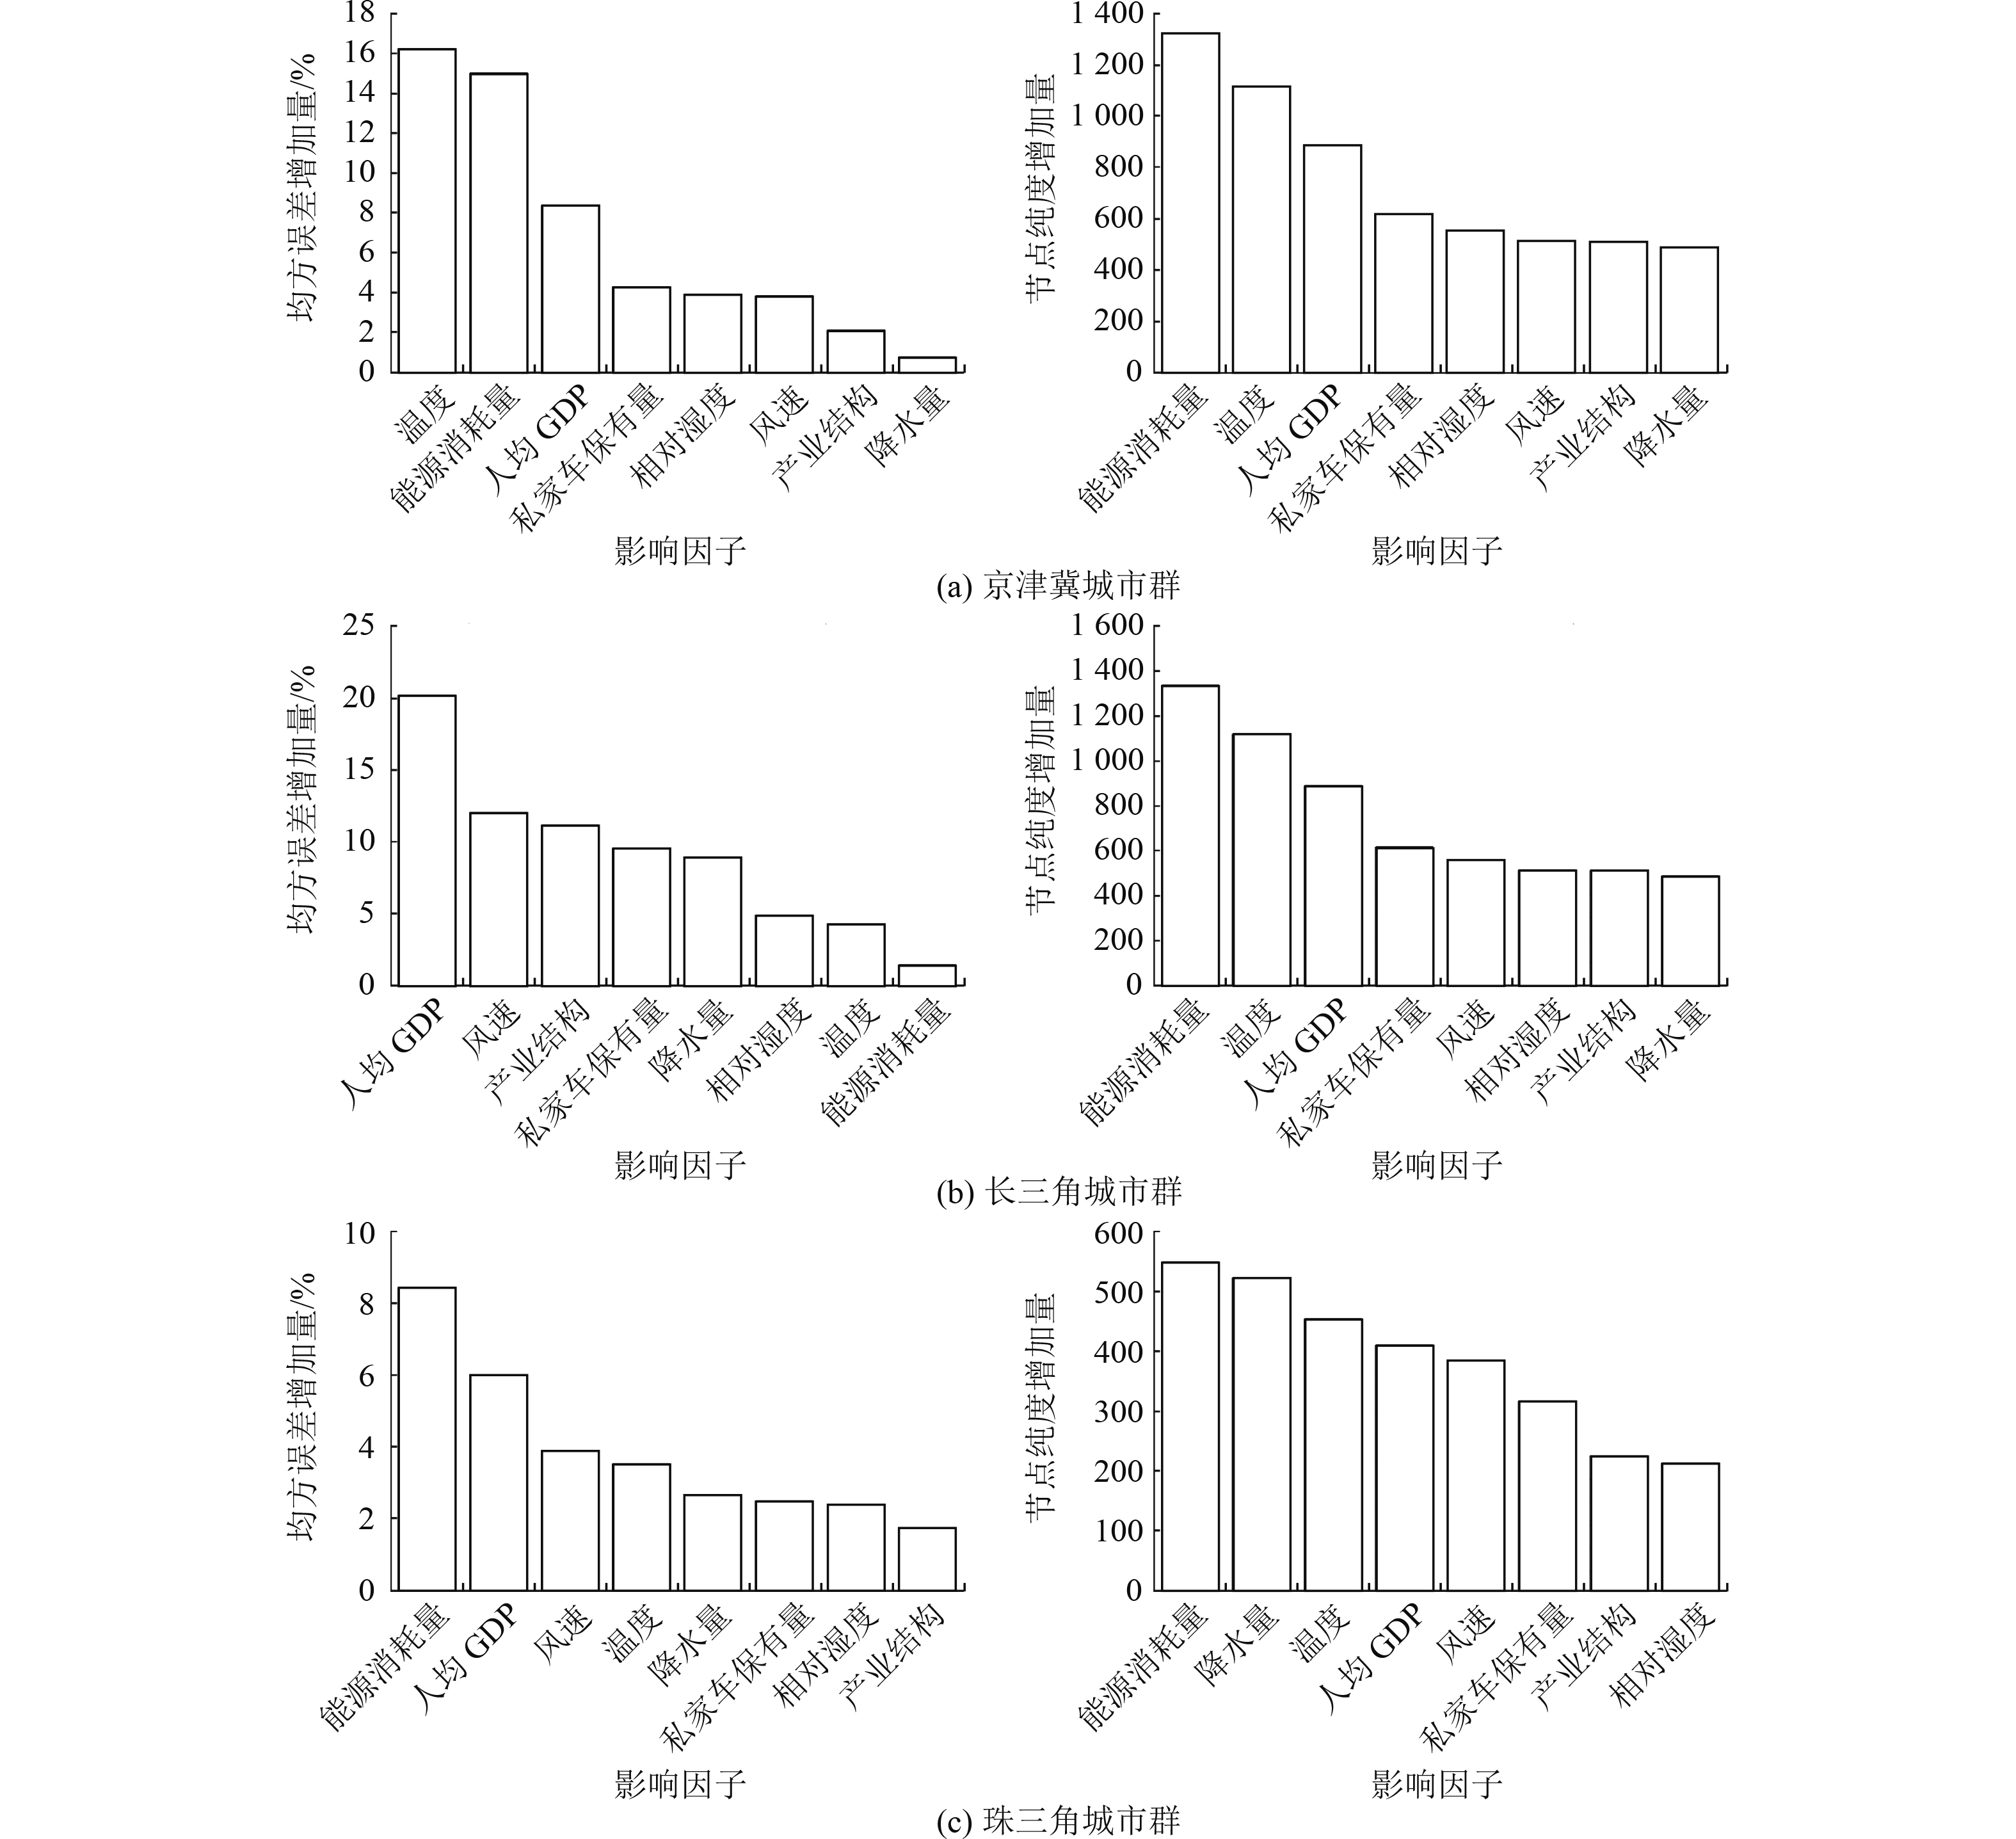
图 6 三大城市群臭氧浓度时间变化影响因子重要性排序
Figure 6. Ranking of the importance of ozone impact factors in the three major urban agglomerations

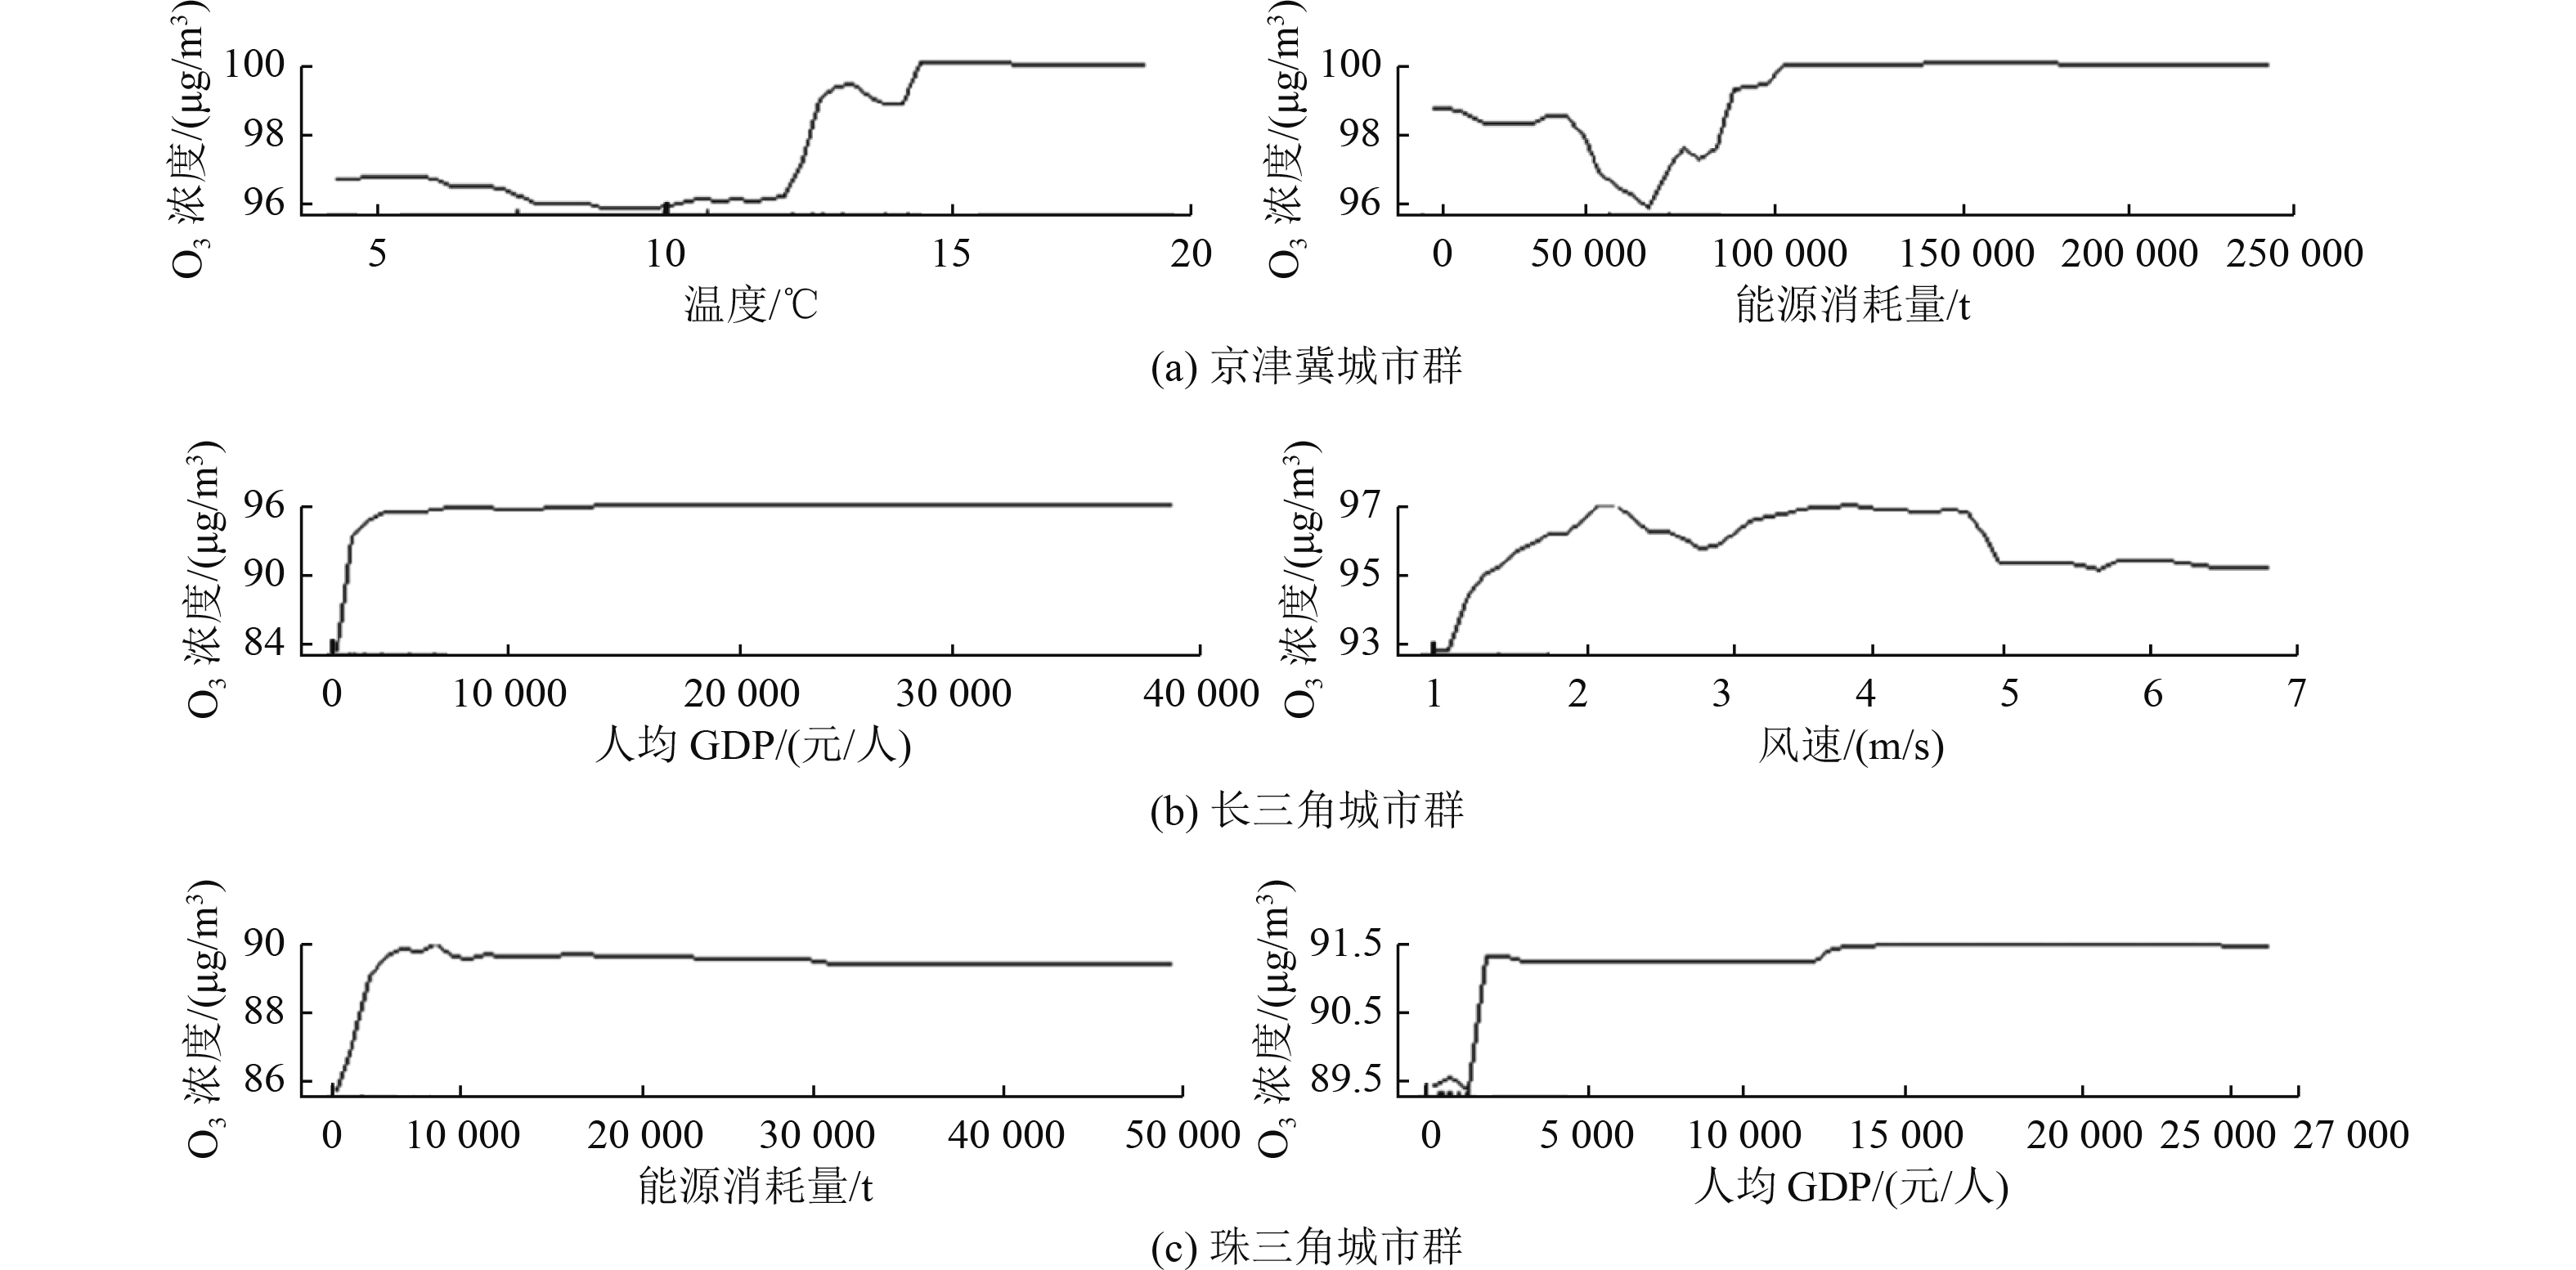
图 7 三大城市群臭氧浓度时间变化影响因子阈值分析
Figure 7. Threshold analysis of ozone concentration influencing factors in the three major urban agglomerations
表 1 地理探测器交互探测
Table 1. Geographical detector interactive detection
判断依据 交互作用 q(x1∩x2)<min[q(x1),q(x2)] 非线性减弱 min[q(x1),q(x2)]<q(x1∩x2)<max[q(x1),q(x2)] 单因子分线性减弱 q(x1∩x2)>max[q(x1),q(x2)] 互相增强 q(x1∩x2)=q(x1)+q(x2) 独立 q(x1∩x2)>q(x1)+q(x2) 非线性增强  下载: 导出CSV
表 2 三大城市群臭氧浓度空间变化因子探测
Table 2. Factor detection analysis of spatial ozone changes in the three major urban agglomerations
影响因子 京津冀城市群 长三角城市群 珠三角城市群 q 排序 q 排序 q 排序 温度 0.508*** 3 0.214*** 5 0.399*** 3 相对湿度 0.476*** 4 0.150*** 7 0.218*** 7 风速 0.291*** 5 0.205*** 6 0.104*** 8 降水量 0.290*** 6 0.356*** 3 0.257*** 6 人均GDP 0.546*** 1 0.359*** 2 0.589*** 1 产业结构 0.186*** 8 0.081*** 8 0.271*** 5 能源消耗量 0.527*** 2 0.506*** 1 0.564*** 2 私家车保有量 0.192*** 7 0.290*** 4 0.279*** 4 注:***表示在0.001水平显著相关。
下载: 导出CSV
表 3 三大城市群臭氧浓度空间变化因子交互作用探测
Table 3. Detection of the interaction of spatial ozone changes in the three major urban agglomerations
地区 影响因子 温度 相对湿度 风速 降水量 人均GDP 产业结构 能源消耗量 私家车保有量 京津冀城市群 温度 0.508 相对湿度 0.928 0.476 风速 0.969 0.956 0.291 降水量 0.905 0.798 0.899 0.289 人均GDP 0.870 0.955 0.882 0.862 0.546 产业结构 0.897 0.926 0.674 0.483 0.790 0.186 能源消耗量 0.952 0.849 0.718 0.855 0.926 0.983 0.527 私家车保有量 0.978 0.980 0.429 0.893 0.665 0.472 0.723 0.192 长三角城市群 温度 0.214 相对湿度 0.730 0.150 风速 0.504 0.788 0.205 降水量 0.676 0.762 0.647 0.360 人均GDP 0.893 0.950 0.595 0.838 0.356 产业结构 0.399 0.477 0.355 0.609 0.683 0.081 能源消耗量 0.832 0.941 0.666 0.755 0.788 0.714 0.505 私家车保有量 0.439 0.552 0.577 0.553 0.792 0.539 0.719 0.291 珠三角城市群 温度 0.399 相对湿度 0.634 0.218 风速 0.488 0.409 0.104 降水量 0.589 0.759 0.545 0.257 人均GDP 0.819 0.698 0.669 0.884 0.589 产业结构 0.685 0.922 0.547 0.382 0.728 0.271 能源消耗量 0.619 0.598 0.643 0.661 0.780 0.764 0.564 私家车保有量 0.611 0.429 0.337 0.584 0.683 0.629 0.624 0.279
下载: 导出CSV
表 4 三大城市群臭氧浓度空间变化主要影响因子交互机制
Table 4. Interaction mechanism of main influencing factors of ozone spatial changes in the three major urban agglomerations
京津冀城市群 长三角城市群 珠三角城市群 双因子交互作用 交互值 交互关系 双因子交互作用 交互值 交互关系 双因子交互作用 交互值 交互关系 人均GDP∩温度 0.870 ↑↑ 能源消耗量∩温度 0.619 ↑ 人均GDP∩温度 0.819 ↑↑ 人均GDP∩相对湿度 0.955 ↑↑ 能源消耗量∩相对湿度 0.598 ↑ 人均GDP∩相对湿度 0.698 ↑↑ 人均GDP∩风速 0.882 ↑ 能源消耗量∩风速 0.711 ↑↑ 人均GDP∩风速 0.669 ↑↑ 人均GDP∩降水量 0.862 ↑ 能源消耗量∩降水量 0.862 ↑↑ 人均GDP∩降水量 0.884 ↑ 人均GDP∩产业结构 0.790 ↑ 能源消耗量∩人均GDP 0.865 ↑↑ 人均GDP∩产业结构 0.728 ↑↑ 人均GDP∩能源消耗量 0.926 ↑↑ 能源消耗量∩产业结构 0.764 ↑ 人均GDP∩能源消耗量 0.780 ↑↑ 人均GDP∩私家车保有量 0.665 ↑↑ 能源消耗量∩私家车保有量 0.624 ↑↑ 人均GDP∩私家车保有量 0.683 ↑↑ 注:↑表示非线性增强;↑↑表示互相增强。
下载: 导出CSV
-
[1] XU W T, WANG Y X, SUN S, et al. Spatiotemporal heterogeneity of PM2.5 and its driving difference comparison associated with urbanization in China's multiple urban agglomerations[J]. Environmental Science and Pollution Research,2022,29(20):29689-29703. doi: 10.1007/s11356-021-17929-x [2] LI J, XU W L. Labor agglomeration and urban air pollution: research on labor force based on skill heterogeneity in China[J]. Environmental Science and Pollution Research,2022,29(25):38212-38231. doi: 10.1007/s11356-022-18602-7 [3] 肖建军, 汪太明, 王业耀, 等.中国自然背景地区臭氧浓度时空变化特征分析[J]. 环境科学研究,2022,35(9):2128-2135. doi: 10.13198/j.issn.1001-6929.2022.06.02XIAO J J, WANG T M, WANG Y Y, et al. Analysis of ozone time series variation in atmospheric background area in China[J]. Research of Environmental Sciences,2022,35(9):2128-2135. doi: 10.13198/j.issn.1001-6929.2022.06.02 [4] LELIEVELD J, POZZER A, PÖSCHL U, et al. Loss of life expectancy from air pollution compared to other risk factors: a worldwide perspective[J]. Cardiovascular Research,2020,116(11):1910-1917. doi: 10.1093/cvr/cvaa025 [5] 赵楠, 卢毅敏.中国地表臭氧浓度估算及健康影响评估[J]. 环境科学,2022,43(3):1235-1245. doi: 10.13227/j.hjkx.202108099ZHAO N, LU Y M. Estimation of surface ozone concentration and health impact assessment in China[J]. Environmental Science,2022,43(3):1235-1245. doi: 10.13227/j.hjkx.202108099 [6] WEITEKAMP C A, STEVENS T, STEWART M J, et al. Health effects from freshly emitted versus oxidatively or photochemically aged air pollutants[J]. Science of the Total Environment,2020,704:135772. doi: 10.1016/j.scitotenv.2019.135772 [7] 赵龙一, 郭佳华, 张宇航, 等.2015—2019年南阳市臭氧污染特征及气象因素影响[J]. 环境工程技术学报,2022,12(3):718-725. doi: 10.12153/j.issn.1674-991X.20210205ZHAO L Y, GUO J H, ZHANG Y H, et al. Analysis of ozone pollution characteristics and meteorological parameters in Nanyang City from 2015 to 2019[J]. Journal of Environmental Engineering Technology,2022,12(3):718-725. doi: 10.12153/j.issn.1674-991X.20210205 [8] SONG C B, WU L, XIE Y C, et al. Air pollution in China: status and spatiotemporal variations[J]. Environmental Pollution,2017,227:334-347. doi: 10.1016/j.envpol.2017.04.075 [9] HE J J, GONG S L, YU Y, et al. Air pollution characteristics and their relation to meteorological conditions during 2014-2015 in major Chinese cities[J]. Environmental Pollution,2017,223:484-496. doi: 10.1016/j.envpol.2017.01.050 [10] ZEREN Y Z, GUO H, LYU X P, et al. Remarkable spring increase overwhelmed hard-earned autumn decrease in ozone pollution from 2005 to 2017 at a suburban site in Hong Kong, South China[J]. Science of the Total Environment,2022,831:154788. doi: 10.1016/j.scitotenv.2022.154788 [11] CHEN L, ZHU J, LIAO H, et al. Meteorological influences on PM2.5 and O3 trends and associated health burden since China's clean air actions[J]. Science of the Total Environment,2020,744:140837. doi: 10.1016/j.scitotenv.2020.140837 [12] CHEN W H, GUENTHER A B, SHAO M, et al. Assessment of background ozone concentrations in China and implications for using region-specific volatile organic compounds emission abatement to mitigate air pollution[J]. Environmental Pollution,2022,305:119254. doi: 10.1016/j.envpol.2022.119254 [13] ZHAO H, CHEN K Y, LIU Z, et al. Coordinated control of PM2.5 and O3 is urgently needed in China after implementation of the "Air pollution prevention and control action plan"[J]. Chemosphere,2021,270:129441. doi: 10.1016/j.chemosphere.2020.129441 [14] DANG R J, LIAO H, FU Y. Quantifying the anthropogenic and meteorological influences on summertime surface ozone in China over 2012-2017[J]. Science of the Total Environment,2021,754:142394. doi: 10.1016/j.scitotenv.2020.142394 [15] WANG N, LYU X P, DENG X J, et al. Aggravating O3 pollution due to NOx emission control in Eastern China[J]. Science of the Total Environment,2019,677:732-744. doi: 10.1016/j.scitotenv.2019.04.388 [16] 王笑哲, 赵莎, 郭灵辉, 等.京津冀及周边地区“2+26”城市臭氧的季节性变化规律[J]. 环境科学研究,2022,35(8):1786-1797. doi: 10.13198/j.issn.1001-6929.2022.05.09WANG X Z, ZHAO S, GUO L H, et al. Seasonal variation of ozone in '2+26' cities in Beijing-Tianjin-Hebei region and surrounding areas[J]. Research of Environmental Sciences,2022,35(8):1786-1797. doi: 10.13198/j.issn.1001-6929.2022.05.09 [17] LIU S S, LIU C, HU Q H, et al. Distinct regimes of O3 response to COVID-19 lockdown in China[J]. Atmosphere,2021,12(2):184. doi: 10.3390/atmos12020184 [18] MA R M, BAN J, WANG Q, et al. Random forest model based fine scale spatiotemporal O3 trends in the Beijing-Tianjin-Hebei region in China, 2010 to 2017[J]. Environmental Pollution,2021,276:116635. doi: 10.1016/j.envpol.2021.116635 [19] 杨振, 丁启燕, 周晴雨, 等.长江中下游地区人口健康水平空间分异特征与地理影响因子[J]. 地理与地理信息科学,2018,34(6):77-84. doi: 10.3969/j.issn.1672-0504.2018.06.012YANG Z, DING Q Y, ZHOU Q Y, et al. Differentiation pattern of population health and its geographical influencing factors in the middle-lower reaches of the Yangtze River[J]. Geography and Geo-Information Science,2018,34(6):77-84. doi: 10.3969/j.issn.1672-0504.2018.06.012 [20] KETU S. Spatial air quality index and air pollutant concentration prediction using linear regression based recursive feature elimination with random forest regression (RFERF): a case study in India[J]. Natural Hazards,2022,114(2):2109-2138. doi: 10.1007/s11069-022-05463-z [21] 蔡清楠, 车扬子, 孙凌瑜, 等.珠三角地区PM2.5浓度估算及其健康效应评估[J]. 生态学报,2021,41(22):8977-8990.CAI Q N, CHE Y Z, SUN L Y, et al. PM2.5 concentration prediction and its health effect in the Pearl River Delta of China[J]. Acta Ecologica Sinica,2021,41(22):8977-8990. [22] WU W Q, ZHANG M, DING Y T. Exploring the effect of economic and environment factors on PM2.5 concentration: a case study of the Beijing-Tianjin-Hebei region[J]. Journal of Environmental Management,2020,268:110703. doi: 10.1016/j.jenvman.2020.110703 [23] YANG D Y, WANG X M, XU J H, et al. Quantifying the influence of natural and socioeconomic factors and their interactive impact on PM2.5 pollution in China[J]. Environmental Pollution,2018,241:475-483. doi: 10.1016/j.envpol.2018.05.043 [24] LIAO W H, WU L L, ZHOU S Z, et al. Impact of synoptic weather types on ground-level ozone concentrations in Guangzhou, China[J]. Asia-Pacific Journal of Atmospheric Sciences,2021,57(2):169-180. doi: 10.1007/s13143-020-00186-2 [25] 栗泽苑, 杨雷峰, 华道柱, 等.2013—2018年中国近地面臭氧浓度空间分布特征及其与气象因子的关系[J]. 环境科学研究,2021,34(9):2094-2104. doi: 10.13198/j.issn.1001-6929.2021.06.16LI Z Y, YANG L F, HUA D Z, et al. Spatial pattern of surface ozone and its relationship with meteorological variables in China during 2013-2018[J]. Research of Environmental Sciences,2021,34(9):2094-2104. doi: 10.13198/j.issn.1001-6929.2021.06.16 [26] WANG Y S, SONG N H, YANG X H, et al. Tailoring the electronic properties of graphyne/blue phosphorene heterostructure via external electric field and vertical strain[J]. Chemical Physics Letters,2019,730:277-282. doi: 10.1016/j.cplett.2019.06.005 [27] SHI T, ZHANG W, ZHOU Q, et al. Industrial structure, urban governance and haze pollution: spatiotemporal evidence from China[J]. Science of the Total Environment,2020,742:139228. doi: 10.1016/j.scitotenv.2020.139228 [28] BREIMAN L. Random forests[J]. Machine Learning,2001,45(1):5-32. doi: 10.1023/A:1010933404324 [29] 王劲峰, 徐成东.地理探测器: 原理与展望[J]. 地理学报,2017,72(1):116-134. doi: 10.11821/dlxb201701010WANG J F, XU C D. Geodetector: principle and prospective[J]. Acta Geographica Sinica,2017,72(1):116-134. doi: 10.11821/dlxb201701010 [30] LI M, ZHANG Q, KUROKAWA J I, et al. MIX: a mosaic Asian anthropogenic emission inventory under the international collaboration framework of the MICS-Asia and HTAP[J]. Atmospheric Chemistry and Physics,2017,17(2):935-963. doi: 10.5194/acp-17-935-2017 [31] HUANG L, HU J L, CHEN M D, et al. Impacts of power generation on air quality in China: Part I. an overview[J]. Resources, Conservation and Recycling,2017,121:103-114. doi: 10.1016/j.resconrec.2016.04.010 [32] FU Y, LIAO H, YANG Y. Interannual and decadal changes in tropospheric ozone in China and the associated chemistry-climate interactions: a review[J]. Advances in Atmospheric Sciences,2019,36(9):975-993. doi: 10.1007/s00376-019-8216-9 [33] 郭向阳, 穆学青, 丁正山, 等.长三角多维城市化对PM2.5浓度的非线性影响及驱动机制[J]. 地理学报,2021,76(5):1274-1293. doi: 10.11821/dlxb202105017GUO X Y, MU X Q, DING Z S, et al. Nonlinear effects and driving mechanism of multidimensional urbanization on PM2.5 concentrations in the Yangtze River Delta[J]. Acta Geographica Sinica,2021,76(5):1274-1293. doi: 10.11821/dlxb202105017 [34] LIU Y M, WANG T. Worsening urban ozone pollution in China from 2013 to 2017: Part 1. the complex and varying roles of meteorology[J]. Atmospheric Chemistry and Physics,2020,20(11):6305-6321. doi: 10.5194/acp-20-6305-2020 [35] FANG C L, LIU H M, LI G D, et al. Estimating the impact of urbanization on air quality in China using spatial regression models[J]. Sustainability,2015,7(11):15570-15592. doi: 10.3390/su71115570 [36] 王少剑, 苏泳娴, 赵亚博.中国城市能源消费碳排放的区域差异、空间溢出效应及影响因素[J]. 地理学报,2018,73(3):414-428. doi: 10.11821/dlxb201803003WANG S J, SU Y X, ZHAO Y B. Regional inequality, spatial spillover effects and influencing factors of China's city-level energy-related carbon emissions[J]. Acta Geographica Sinica,2018,73(3):414-428. doi: 10.11821/dlxb201803003 [37] COLE M A. Air pollution and 'dirty' industries: how and why does the composition of manufacturing output change with economic development[J]. Environmental and Resource Economics,2000,17(1):109-123. doi: 10.1023/A:1008388221831 [38] XU W X, TIAN Y Z, LIU Y X, et al. Understanding the spatial-temporal patterns and influential factors on air quality index: the case of North China[J]. International Journal of Environmental Research and Public Health,2019,16(16):2820. doi: 10.3390/ijerph16162820 [39] YANG G F, LIU Y H, LI X N. Spatiotemporal distribution of ground-level ozone in China at a city level[J]. Scientific Reports,2020,10:7229. doi: 10.1038/s41598-020-64111-3 [40] ZHANG Y L, LI W Q, WU F. Does energy transition improve air quality: evidence derived from China's Winter Clean Heating Pilot (WCHP) project[J]. Energy,2020,206:118130. doi: 10.1016/j.energy.2020.118130 [41] LI K, JACOB D J, LIAO H, et al. Anthropogenic drivers of 2013-2017 trends in summer surface ozone in China[J]. Proceedings of the National Academy of Sciences of the United States of America,2019,116(2):422-427. doi: 10.1073/pnas.1812168116 [42] HU Y, WANG J F, LI X H, et al. Geographical detector-based risk assessment of the under-five mortality in the 2008 Wenchuan earthquake, China[J]. PLoS One,2011,6(6):e21427. □ doi: 10.1371/journal.pone.0021427 -

 下载:
下载:

 点击查看大图
计量
- 文章访问数: 306
- HTML全文浏览量: 74
- PDF下载量: 51
- 被引次数: 0