

A satellite-based method and application for identifying high ozone production area
-
摘要:
近年来,我国臭氧污染问题逐步显现。为持续推动京津冀及周边、汾渭平原等重点区域环境质量改善,生态环境部实施了“千里眼”计划,构建了大气污染网格化监管体系。2020年,针对夏季臭氧污染问题,开展了臭氧生成高值区识别研究,向重点区域生态环境部门、监督帮扶现场工作组推送环境异常信息,为打赢蓝天保卫战提供了重要支撑。利用哨兵-5卫星数据,结合企业清单、用电数据、历史污染源检查问题等数据,通过RFM模型综合挖掘识别臭氧生成高值区。结果表明:京津冀和汾渭平原的大多数城市地区和工业集聚区属于VOCs控制区或VOCs-NOx共同控制区;该方法推送的臭氧生成高值区问题率为65.3%,高出整体问题率21.5个百分点;高值区内企业发现问题率为27.1%,高出非高值区3.7个百分点,提升了2020年夏季臭氧污染防治监督帮扶的工作成效。高值区问题率、高值区内企业问题率和推送次数有关,实践结果表明,经过重复推送,高值区内企业问题率呈先升后降的规律,企业问题率拐点时间与企业整改完成周期有关。该方法对于以包装印刷、工业涂装为主导的产业集群,应用效果较好。
Abstract:Over recent years, ozone pollution has become a prominent issue in China. To perpetuate the improvement of environmental quality in Beijing-Tianjin-Hebei (BTH) Region and its surrounding areas and Fen-Wei Plain, the Ministry of Ecology and Environment launched the Thousand Miles Eye Program to build a grid-based air pollution monitoring system. In 2020, to address the ozone pollution problem during the summer months, a study was conducted to identify high ozone production area and pushed anomaly environmental information to the environmental authorities in key regions and the onsite inspection and assistance teams, thus providing important support for winning the blue sky defense war. Based on the data from Sentinel-5P satellite, and combined with the enterprise data inventories, electricity consumption data, pollution source inspection records, and so on, high ozone production areas were identified and located through the RFM model. The findings of the study showed that most urban areas and industrial clusters in the BTH region and Fen-Wei Plain were located within VOC-control areas or VOC-NOx-cooperative control areas. The problem rate of high ozone production areas pushed by the method was 65.3%, 21.5 percentage points higher than the overall problem rate. The problem rate among enterprises in high ozone production areas was 27.1%, 3.7 percentage points higher than those in non-high ozone production areas. This methodology improved the efficacy of inspection and assistance in ozone pollution inspection and control during the summer of 2020. The problem rate of high ozone production areas and the problem rate of enterprises in high ozone production areas were correlated with the times of push notifications of high ozone production areas; and the practice results showed that after repeated pushes of such notifications, the rate of problematic enterprises in high ozone production areas showed a pattern of rising first before falling, and the inflection point of the problem rate of enterprises was correlational to their cycle of rectification. This methodology proves more effective with industrial clusters dominated by packaging printing and industrial painting businesses.
-
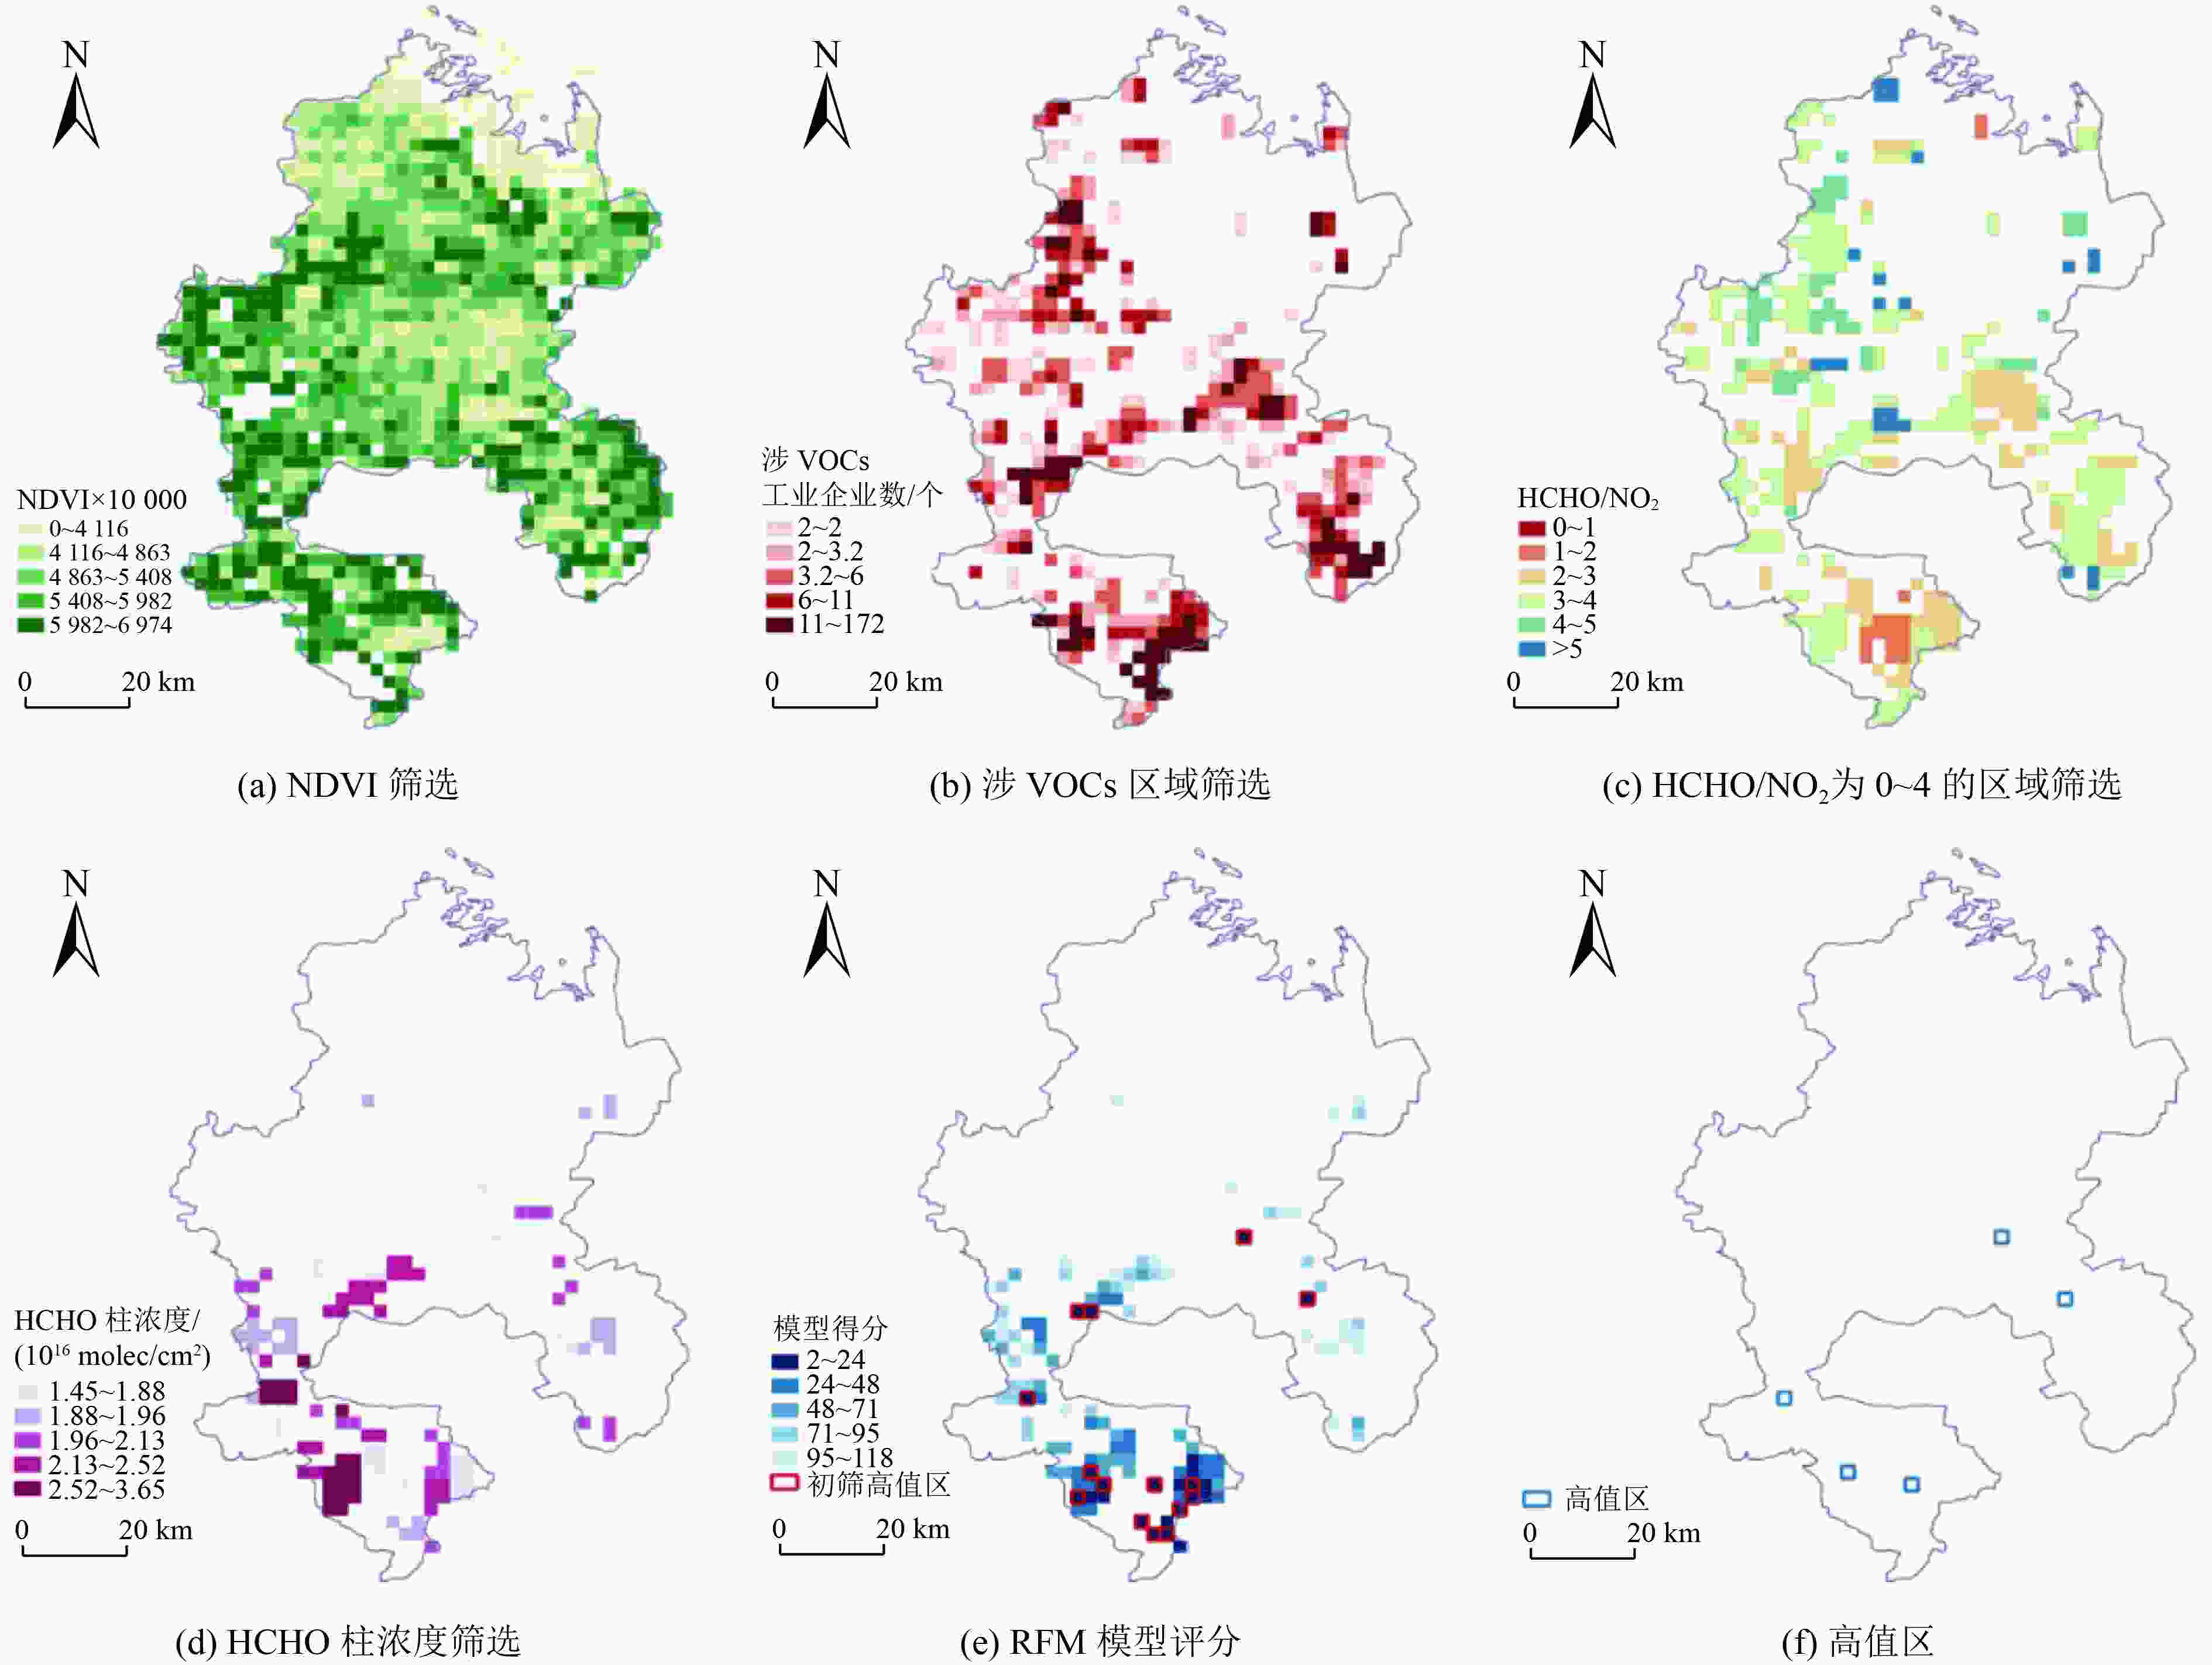
图 2 高值区识别流程及结果示例
Figure 2. Example of high ozone production area identification process and results
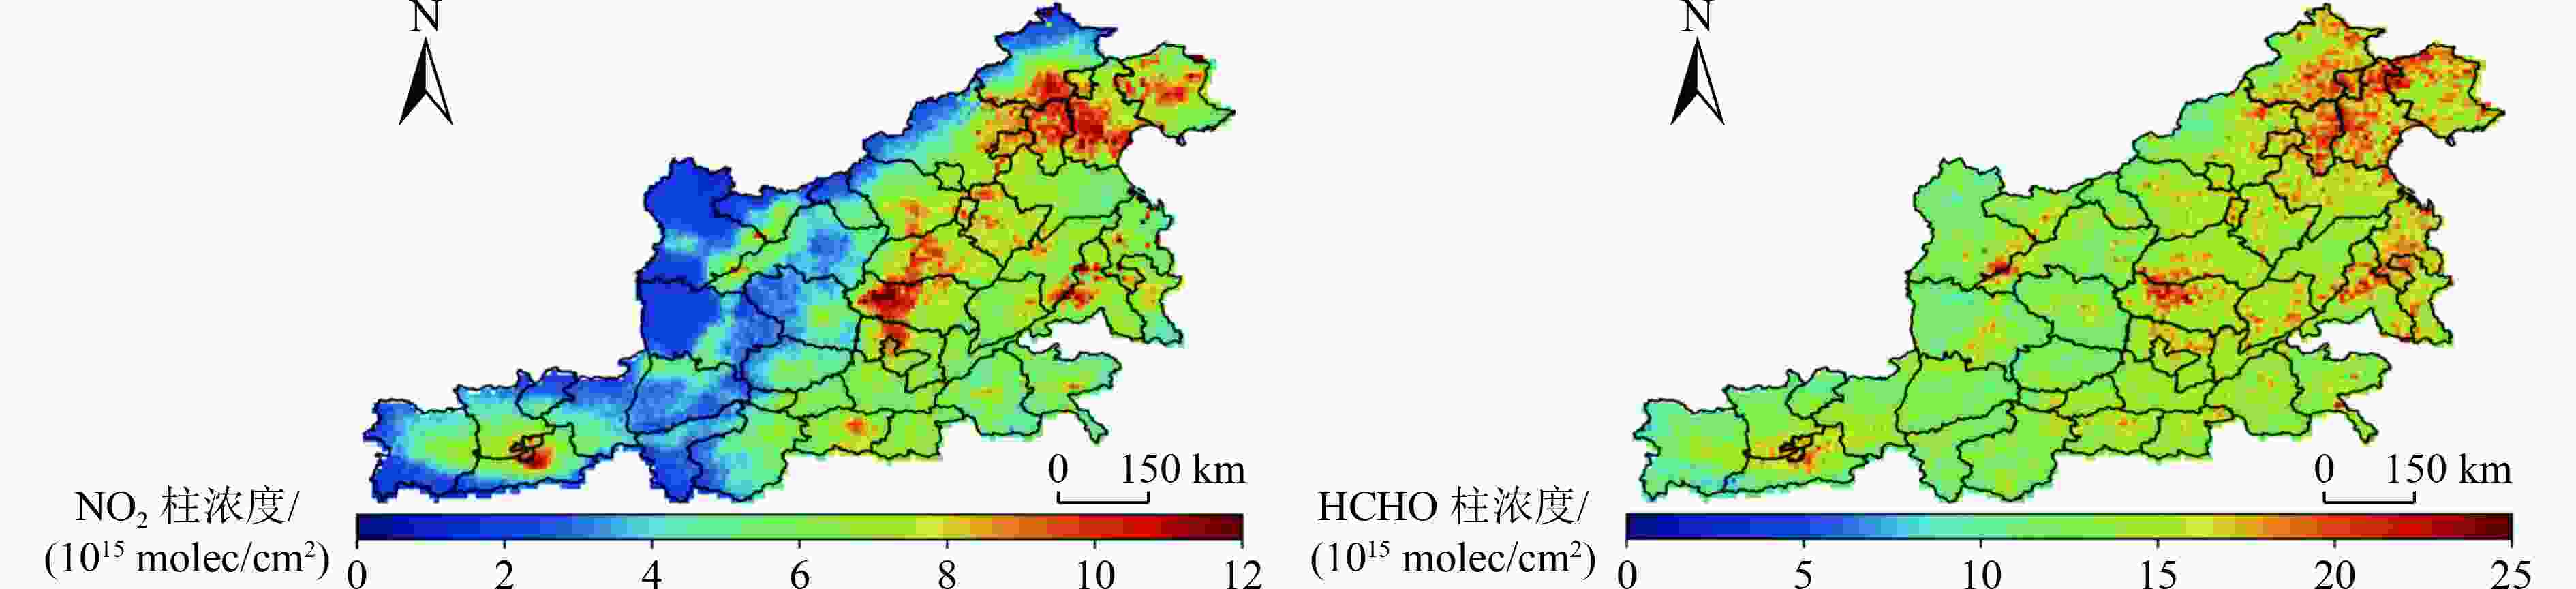
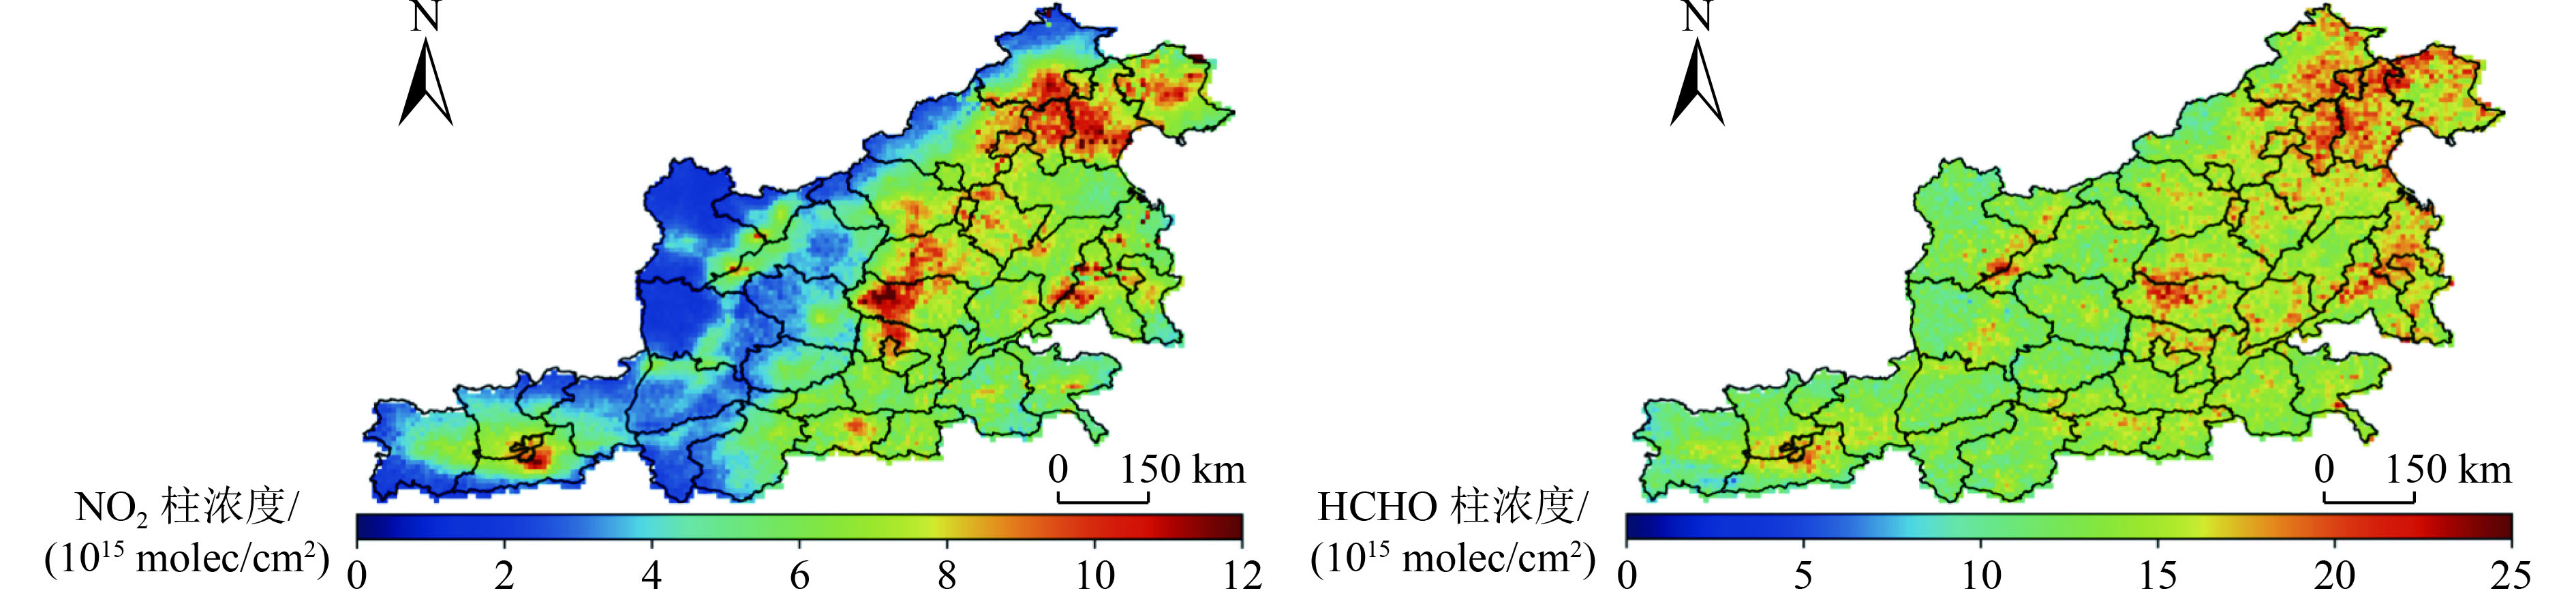
图 3 监督帮扶期间NO2柱浓度和HCHO柱浓度分布
Figure 3. Distribution of NO2 and HCHO column concentration during the inspection and assistance period
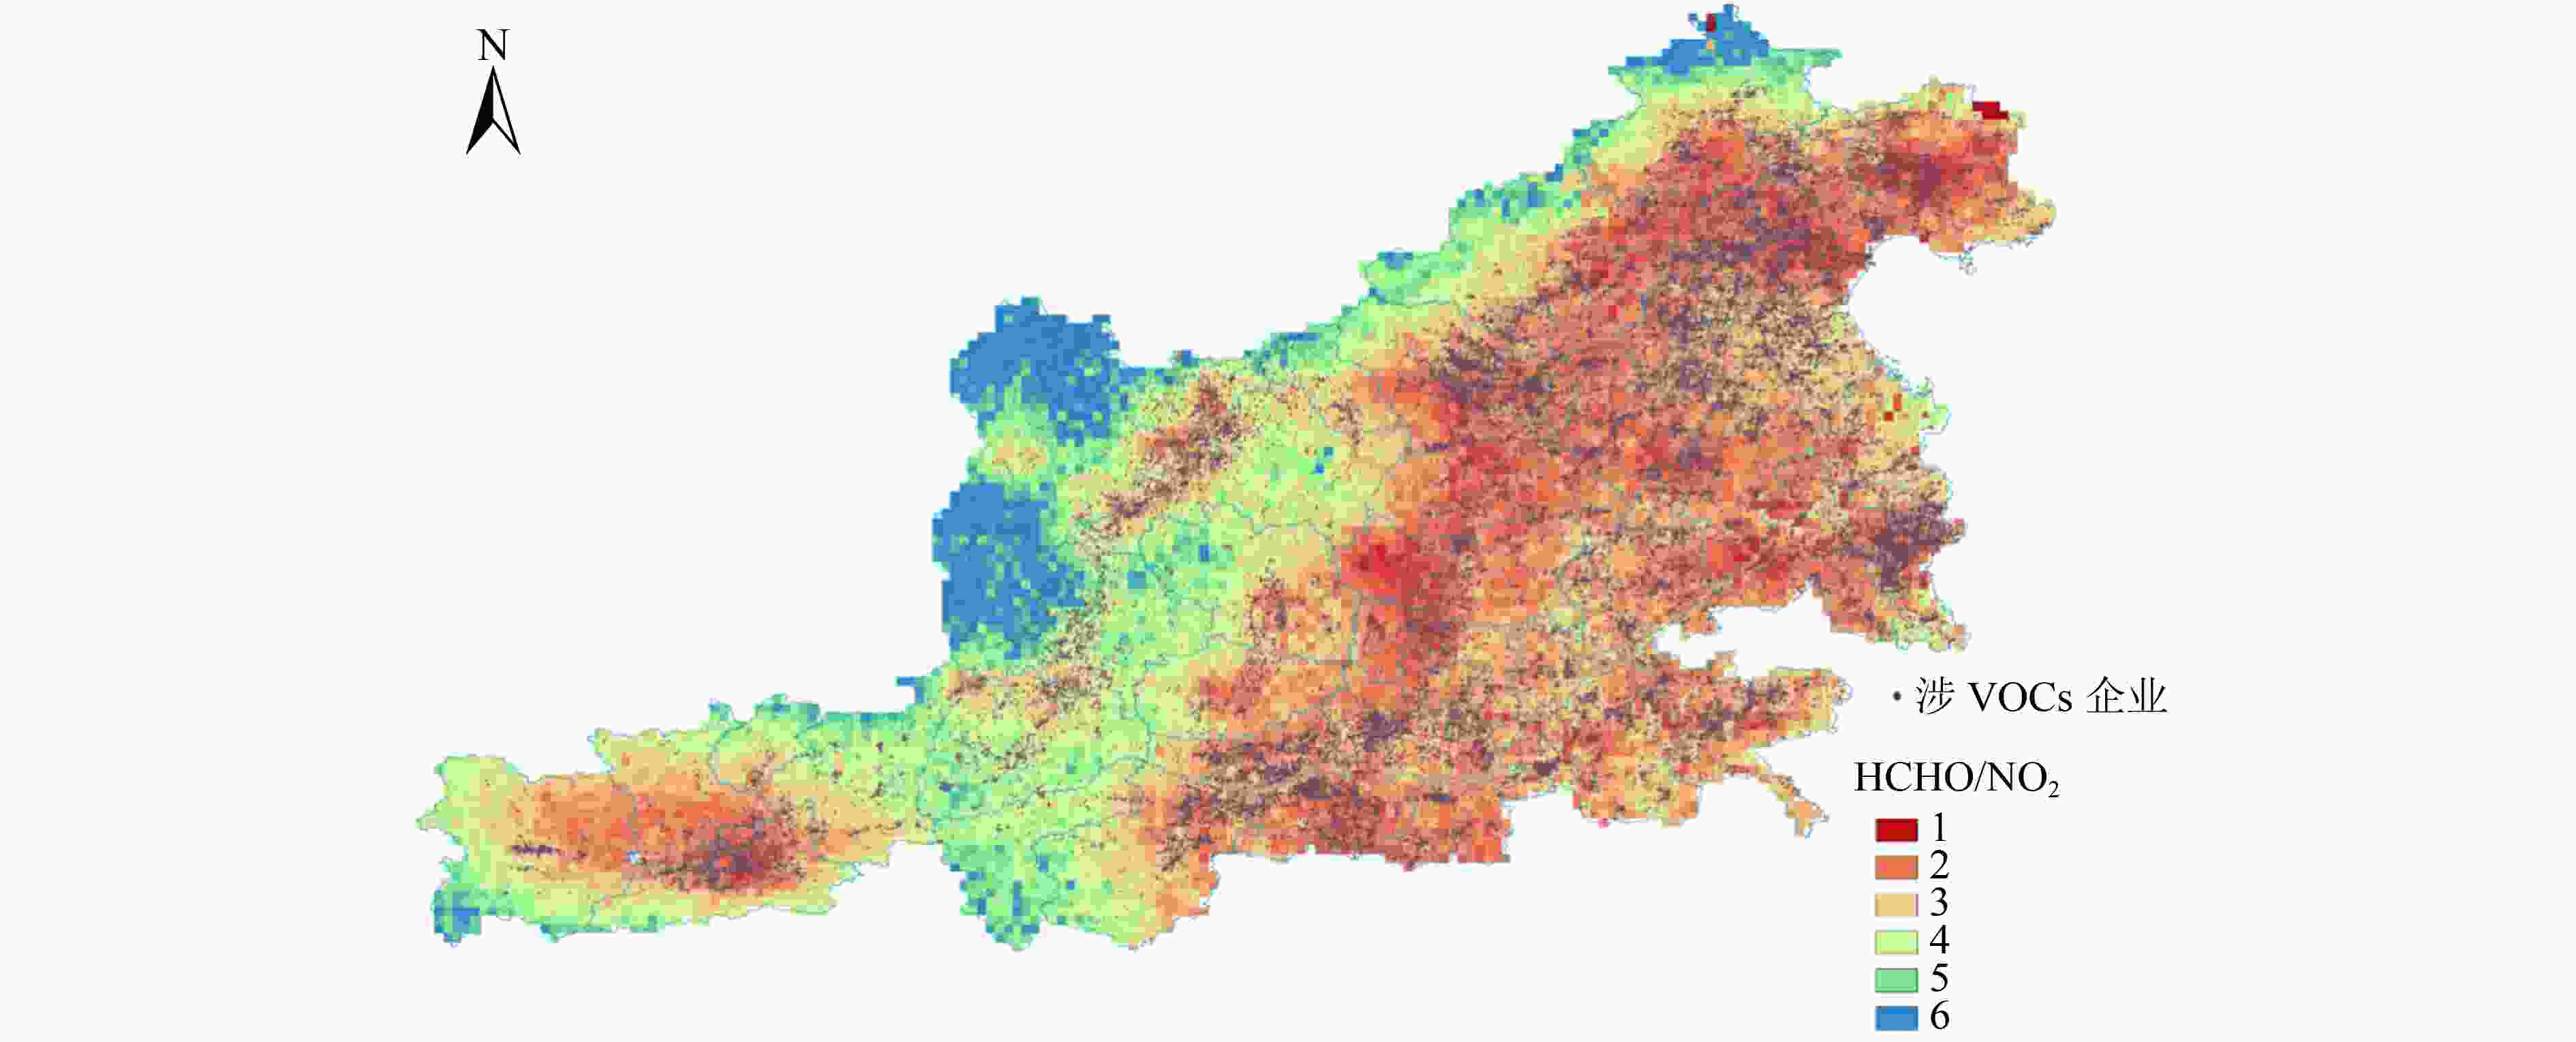
图 5 HCHO/NO2和涉VOCs企业空间分布
Figure 5. Distribution of HCHO/NO2 ratio and enterprises involving VOCs
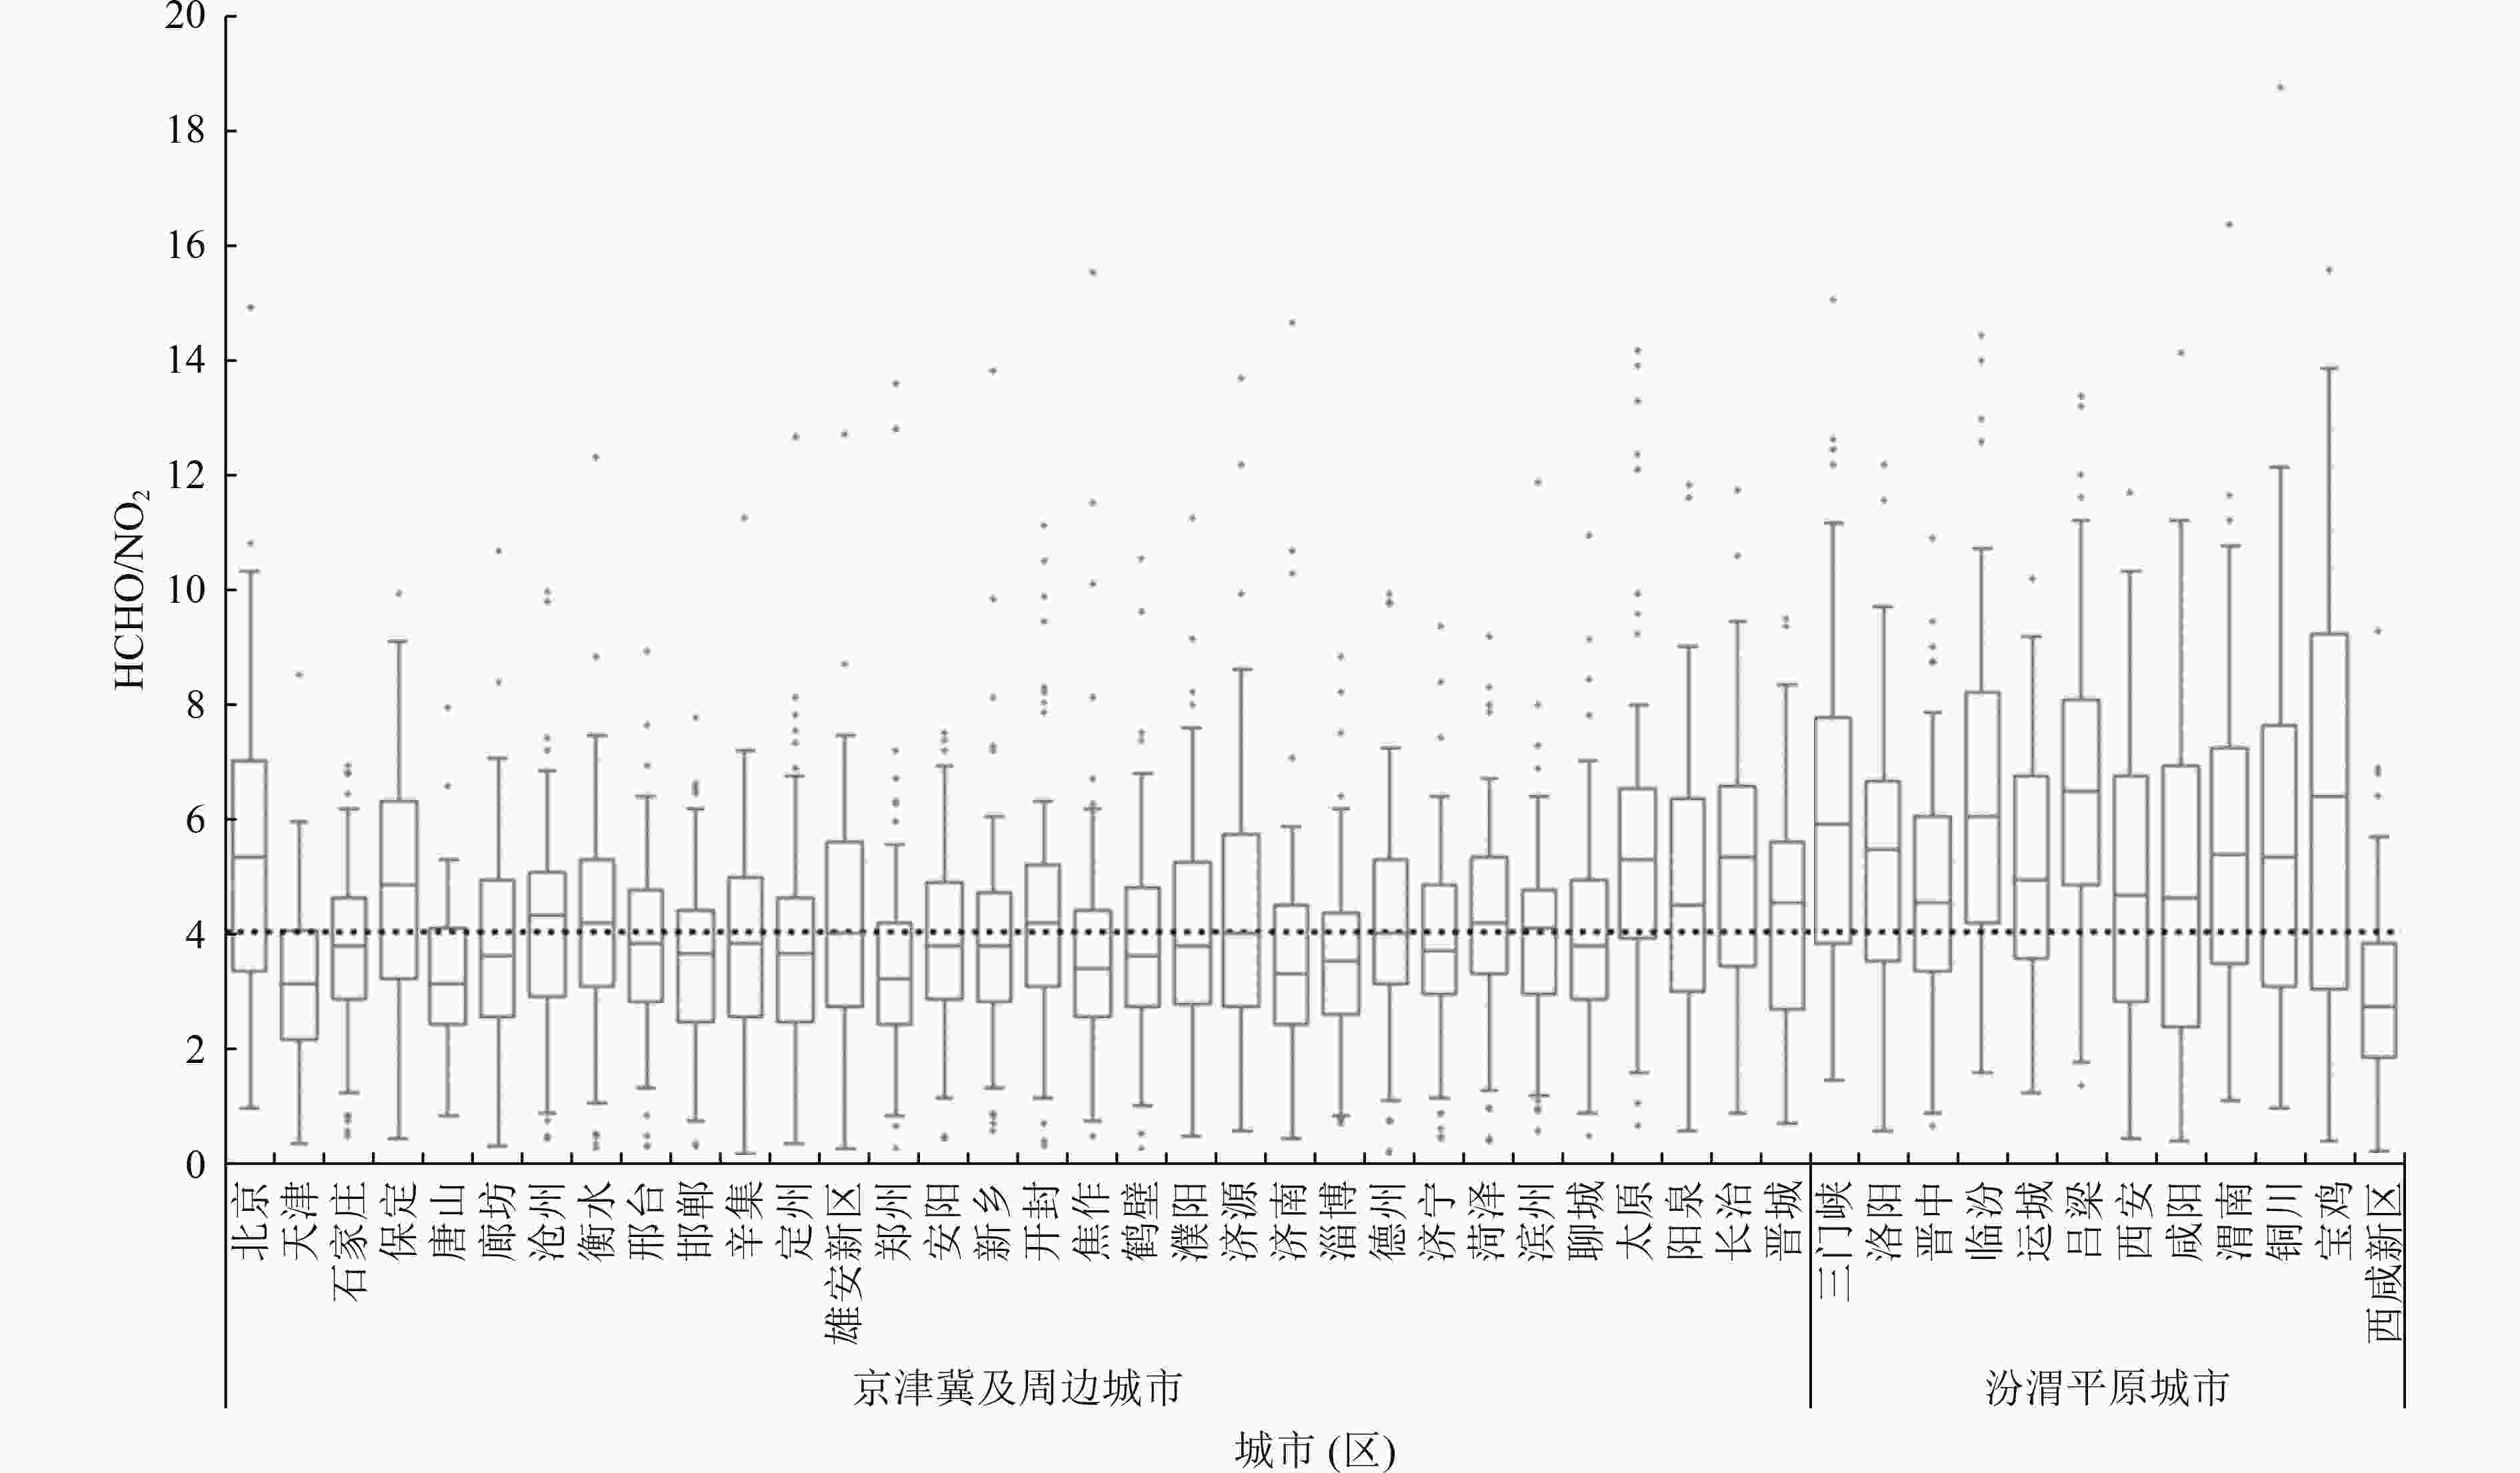
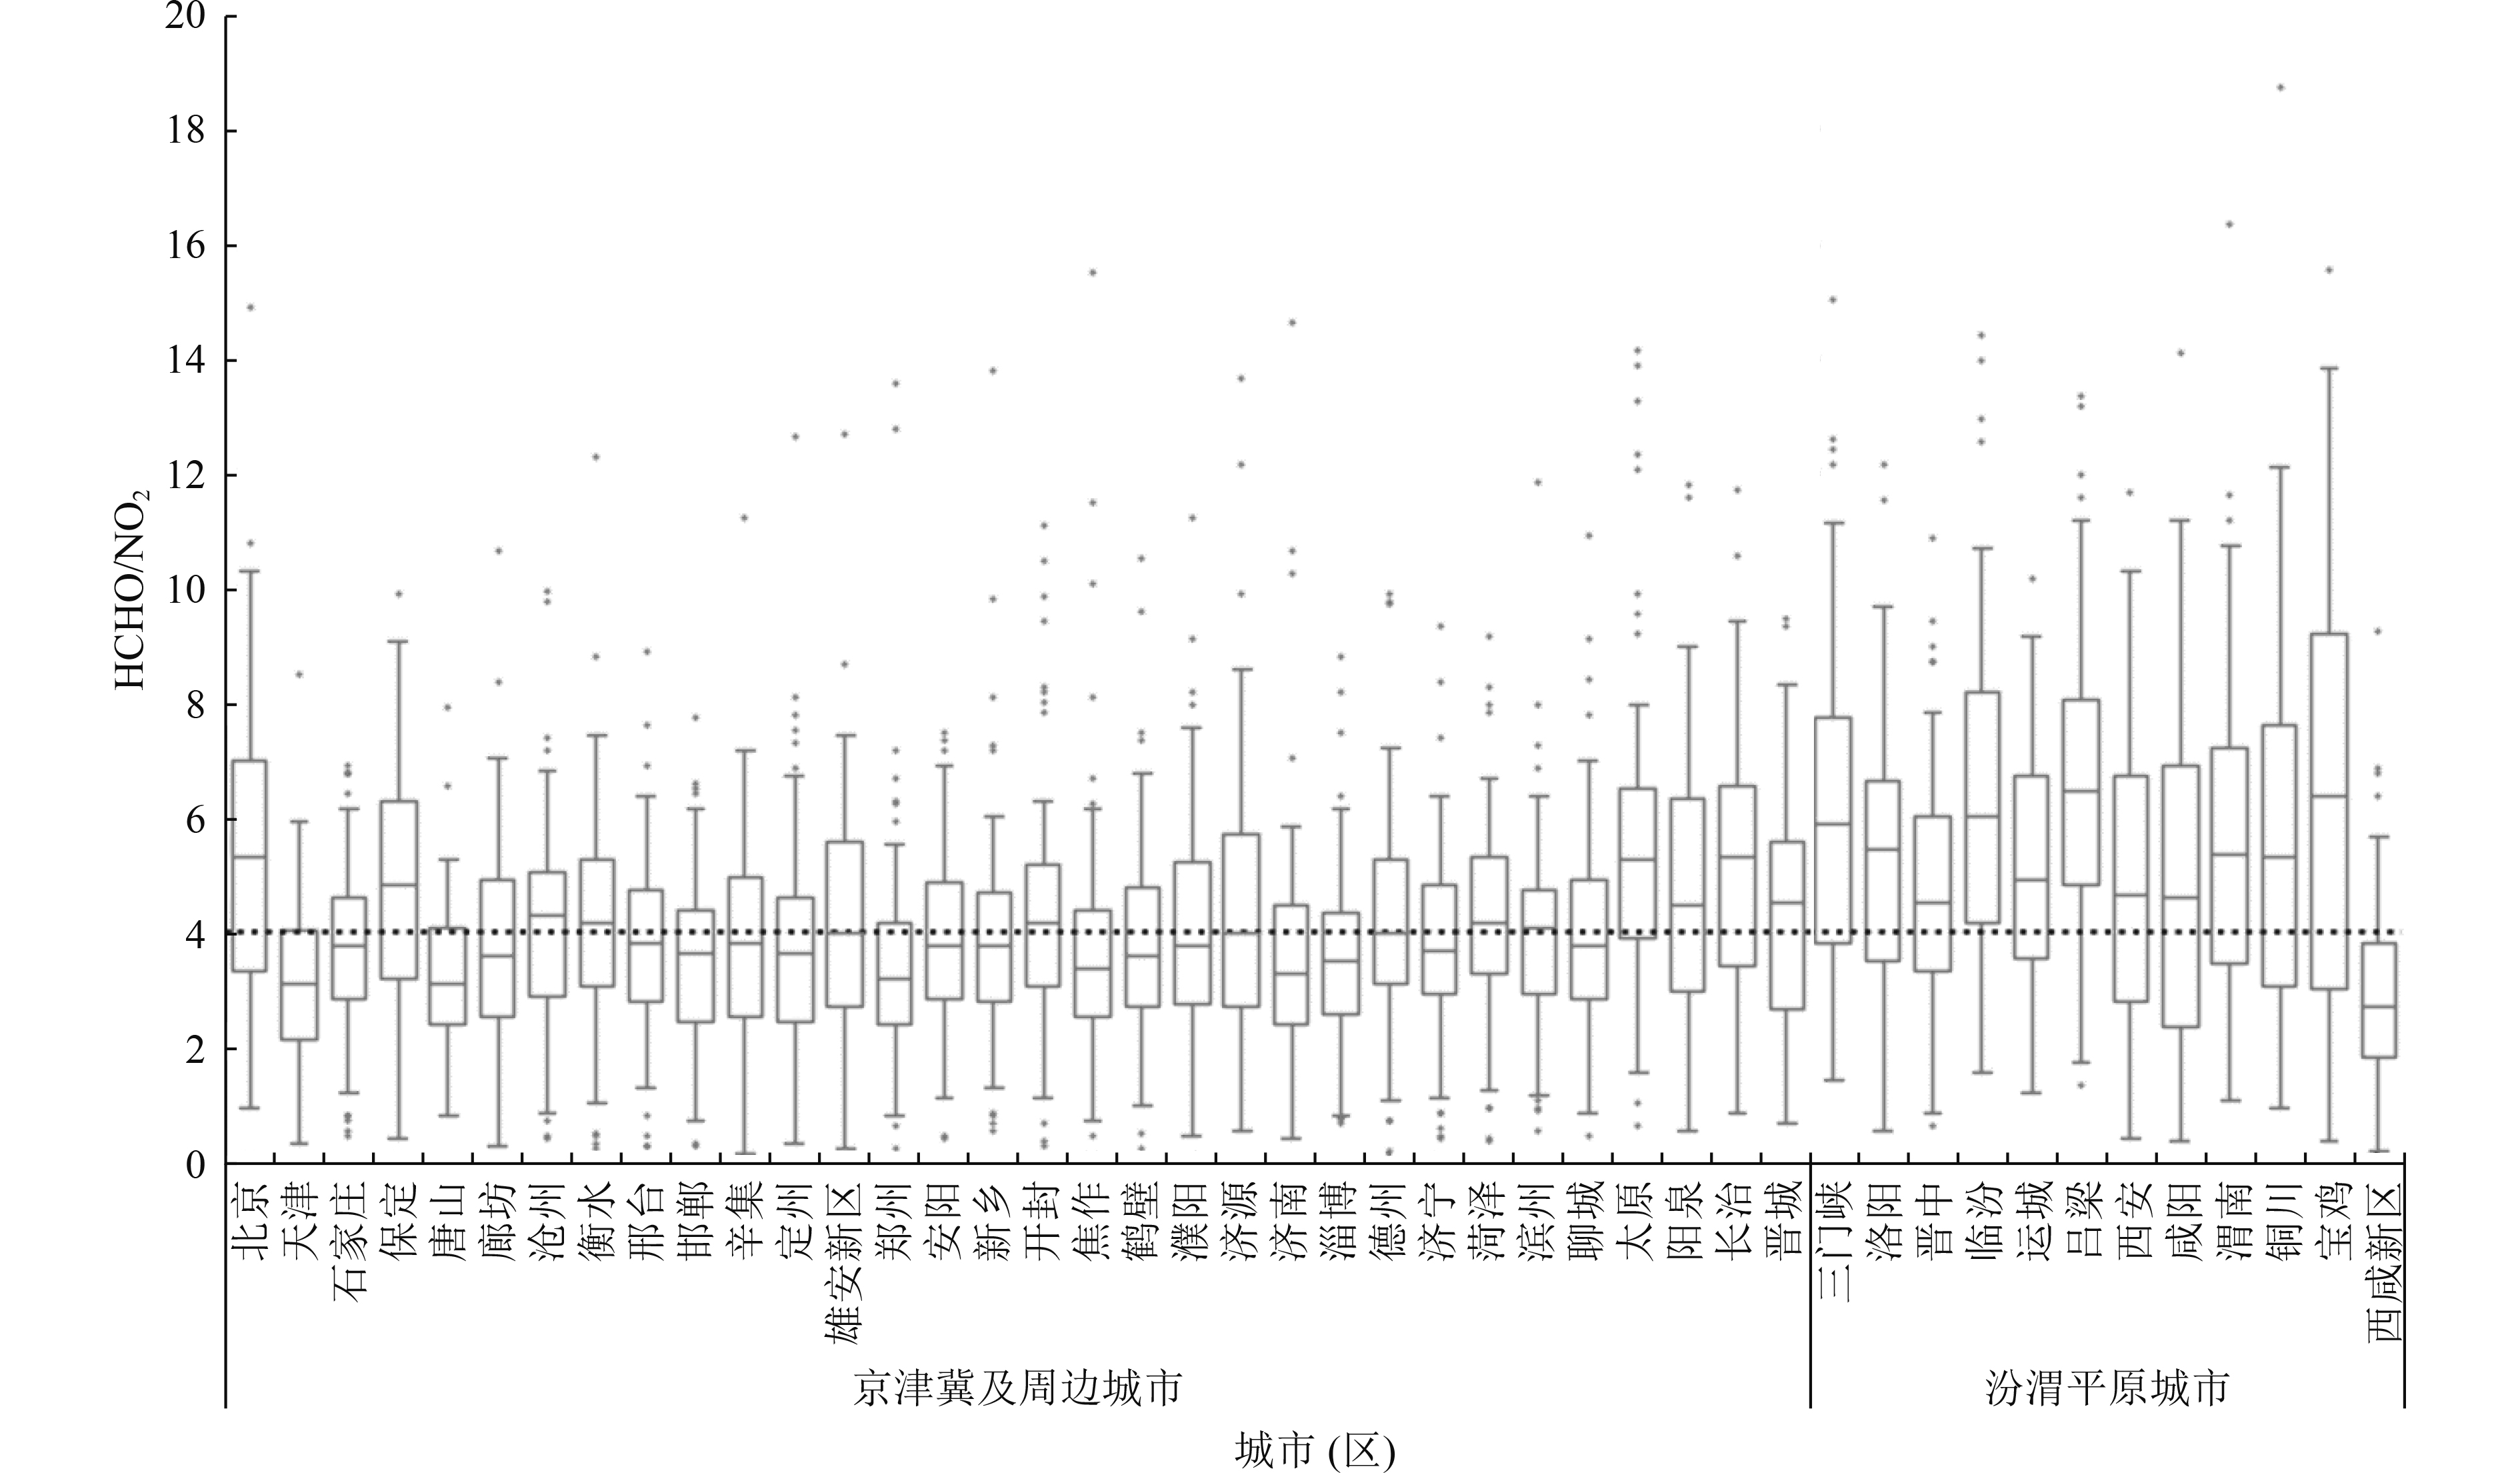
图 6 京津冀和汾渭平原44个城市的HCHO/NO2
Figure 6. HCHO/NO2 ratio of 44 cities in BTH Region and Fen-Wei Plain
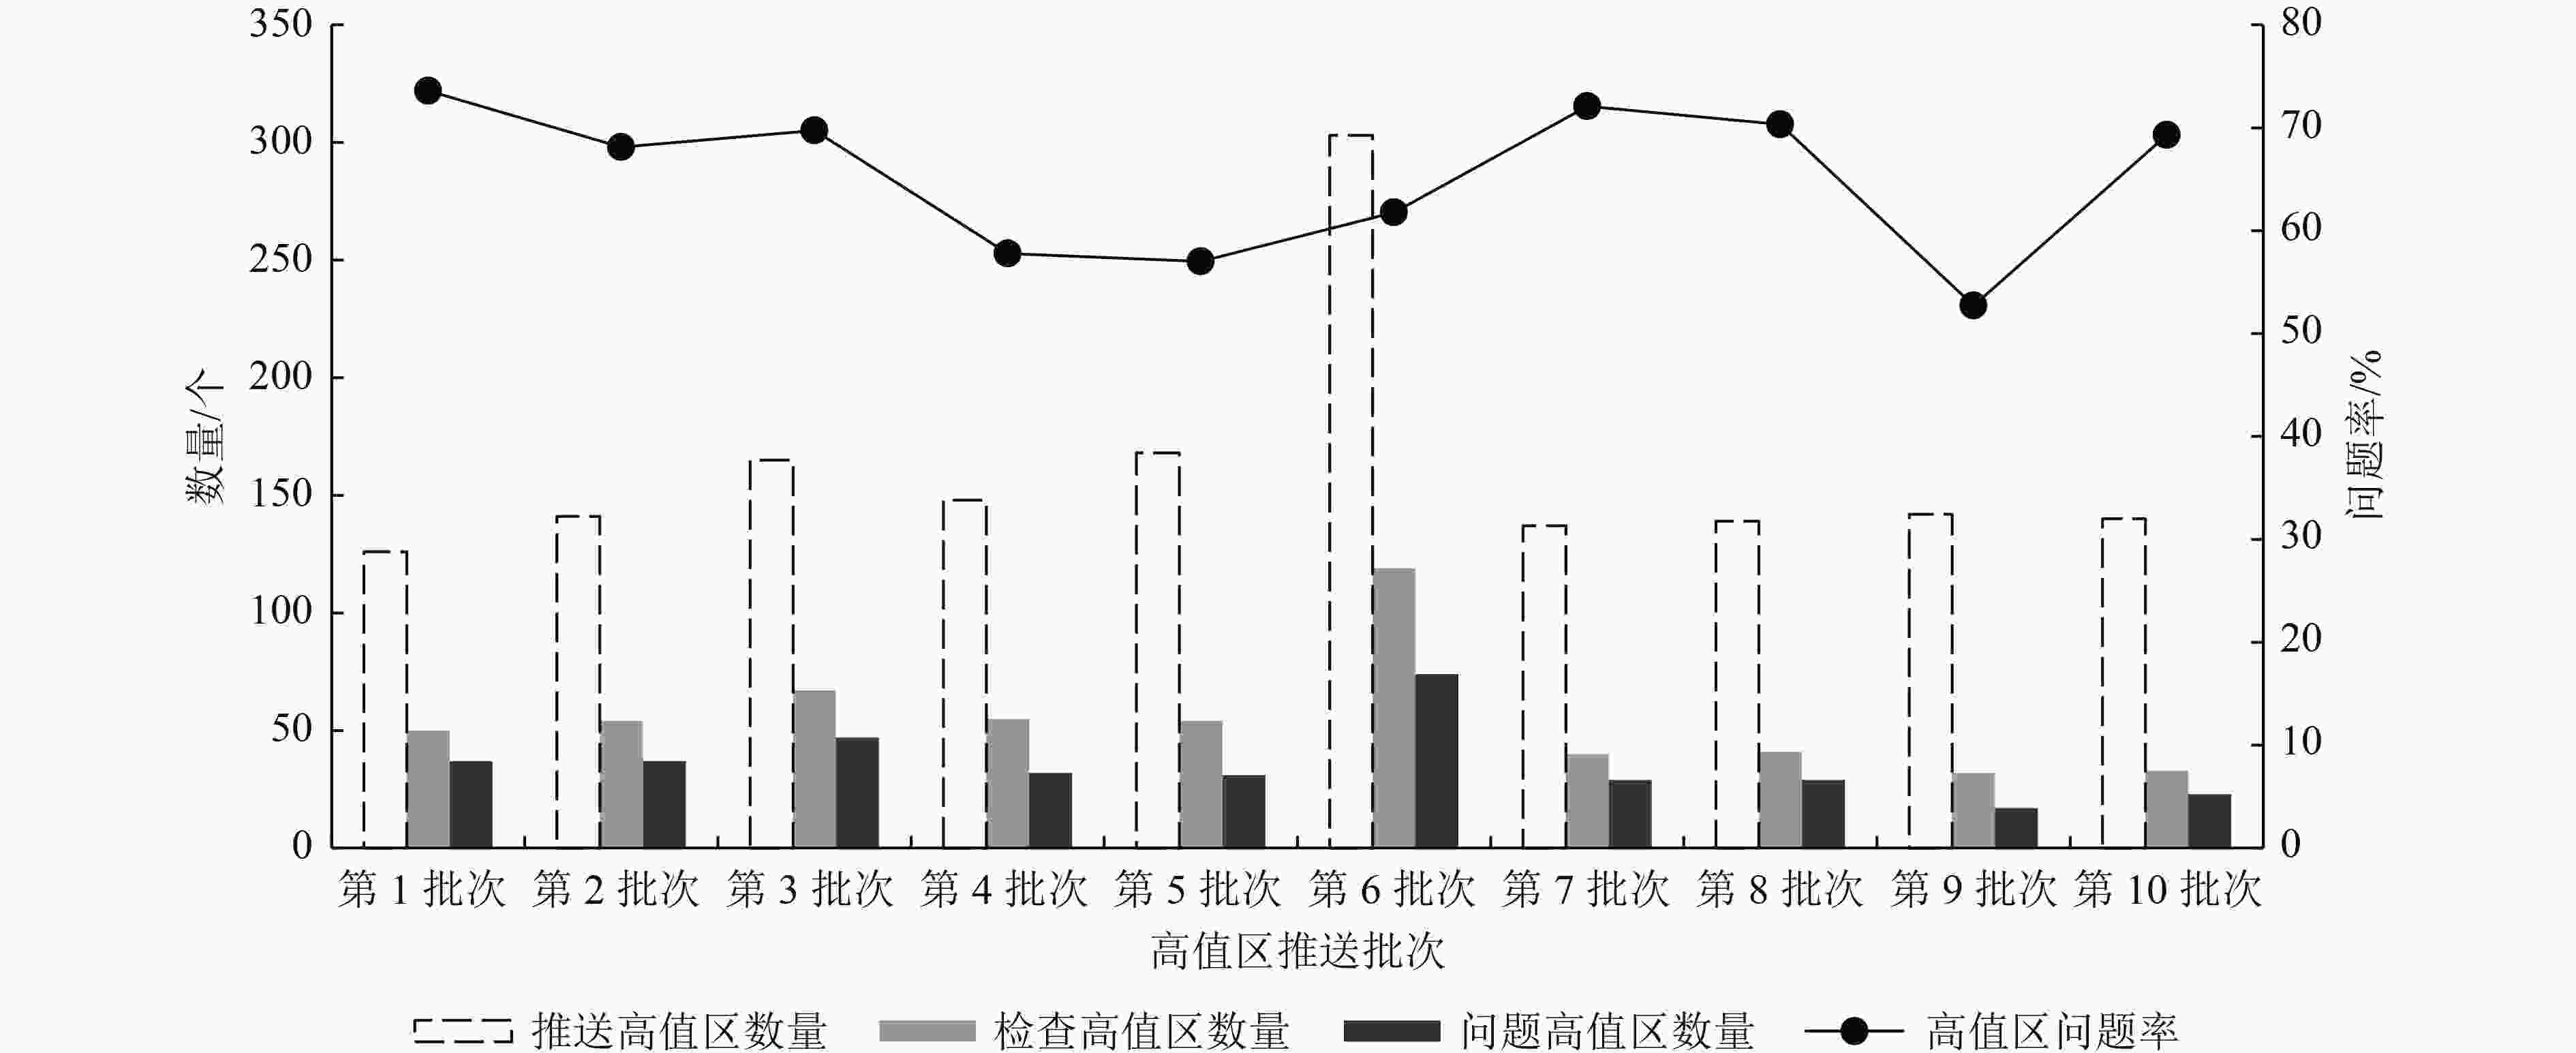
图 7 各时间段高值区分布及检查情况统计
Figure 7. Distribution of high ozone production areas and statistics of inspection in each period
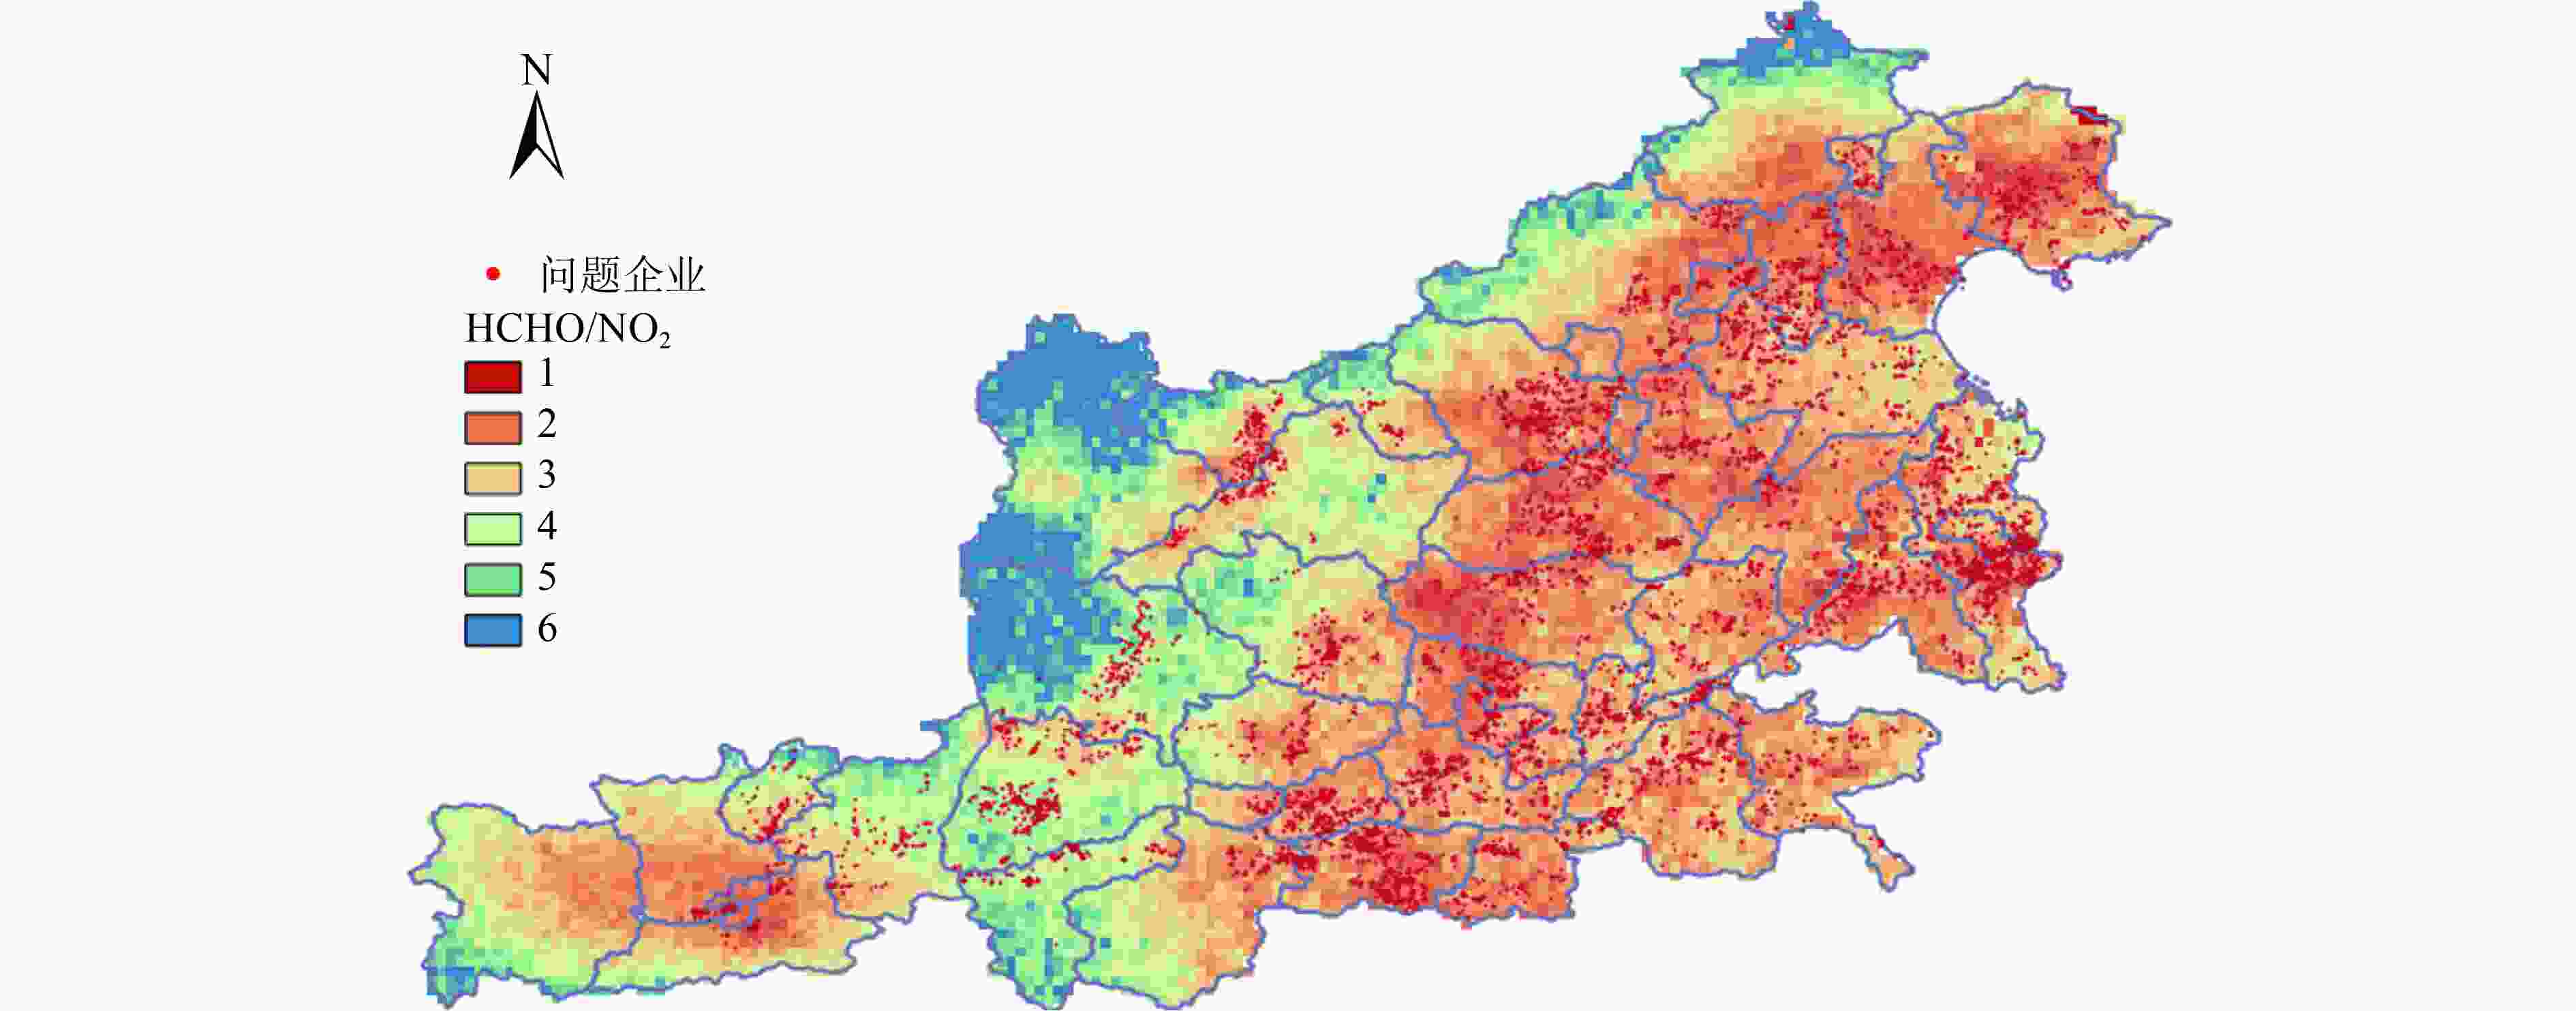
图 8 HCHO/NO2和问题企业分布
Figure 8. Distribution of HCHO/NO2 ratio and problematic enterprises
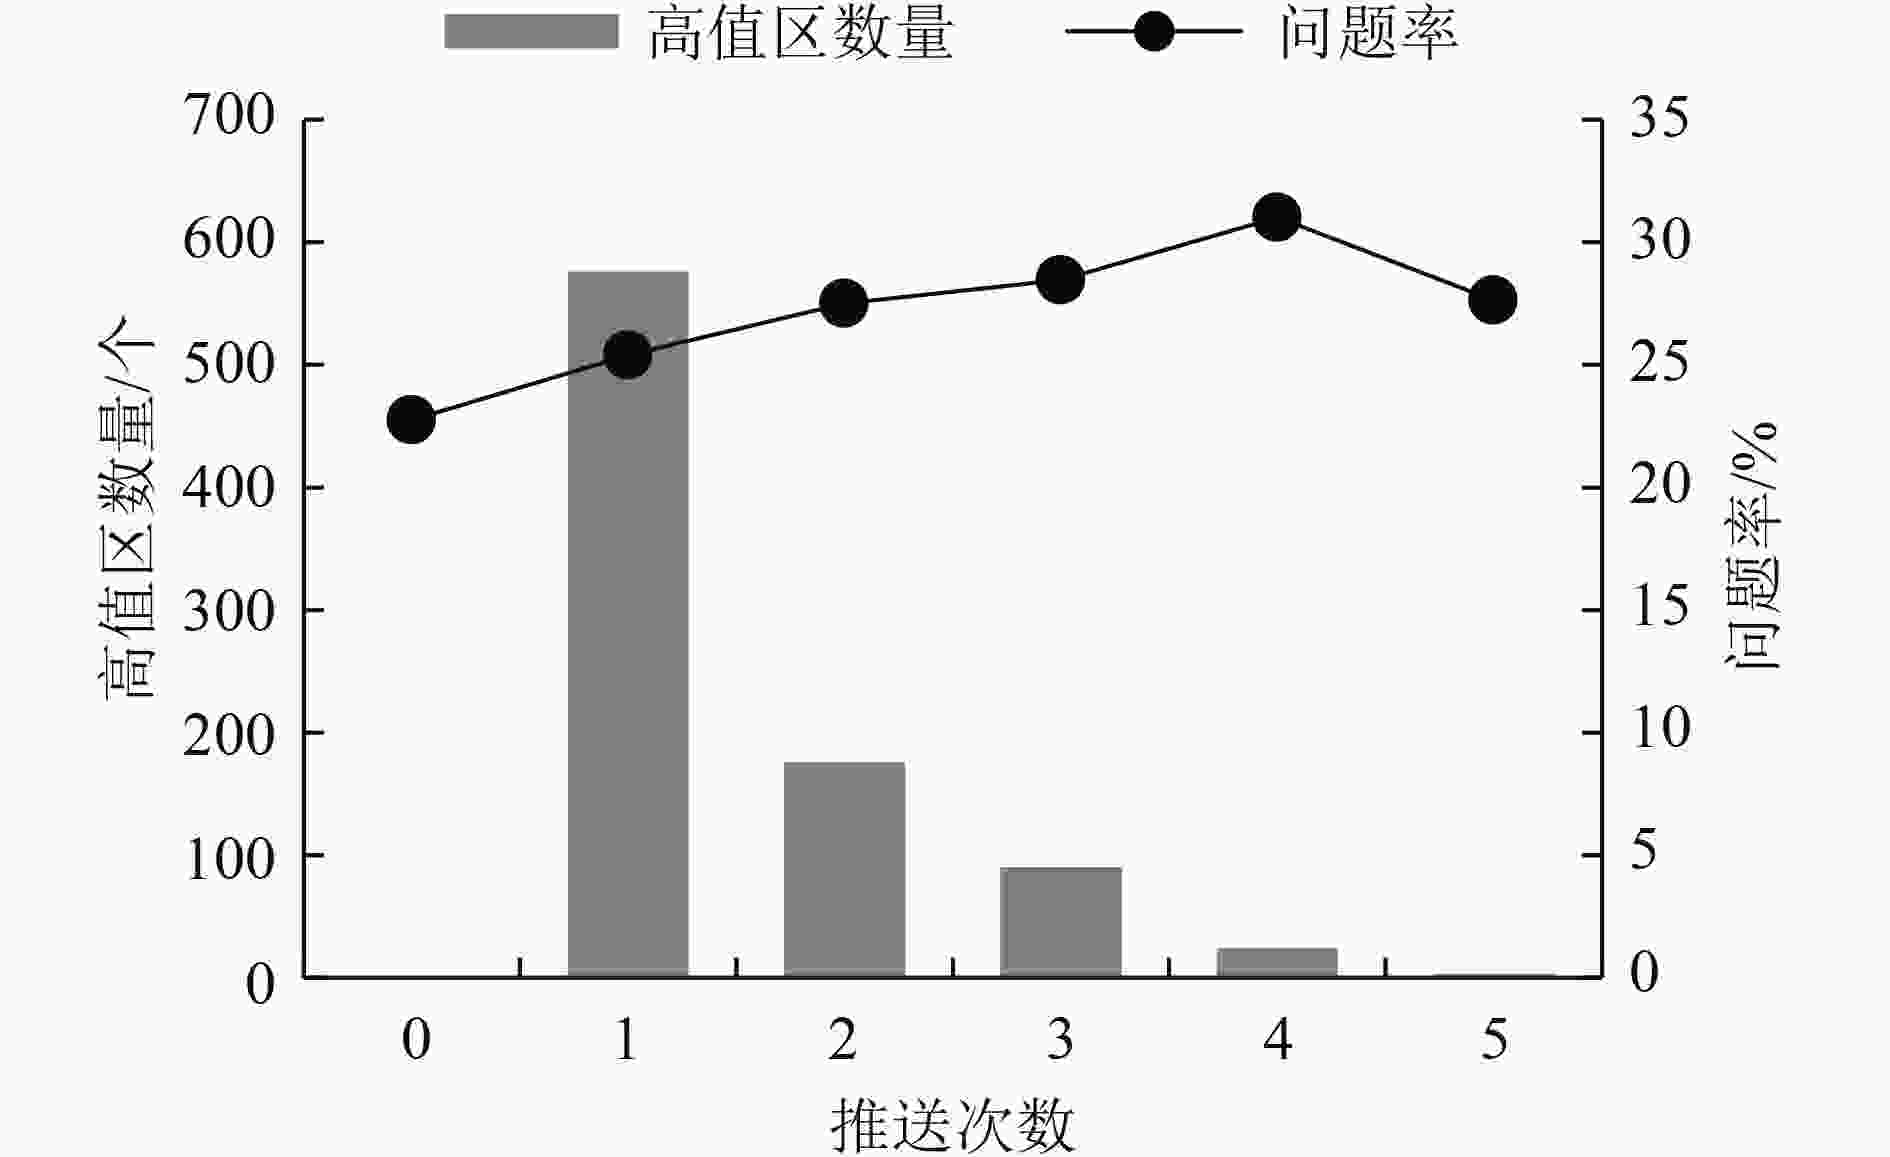
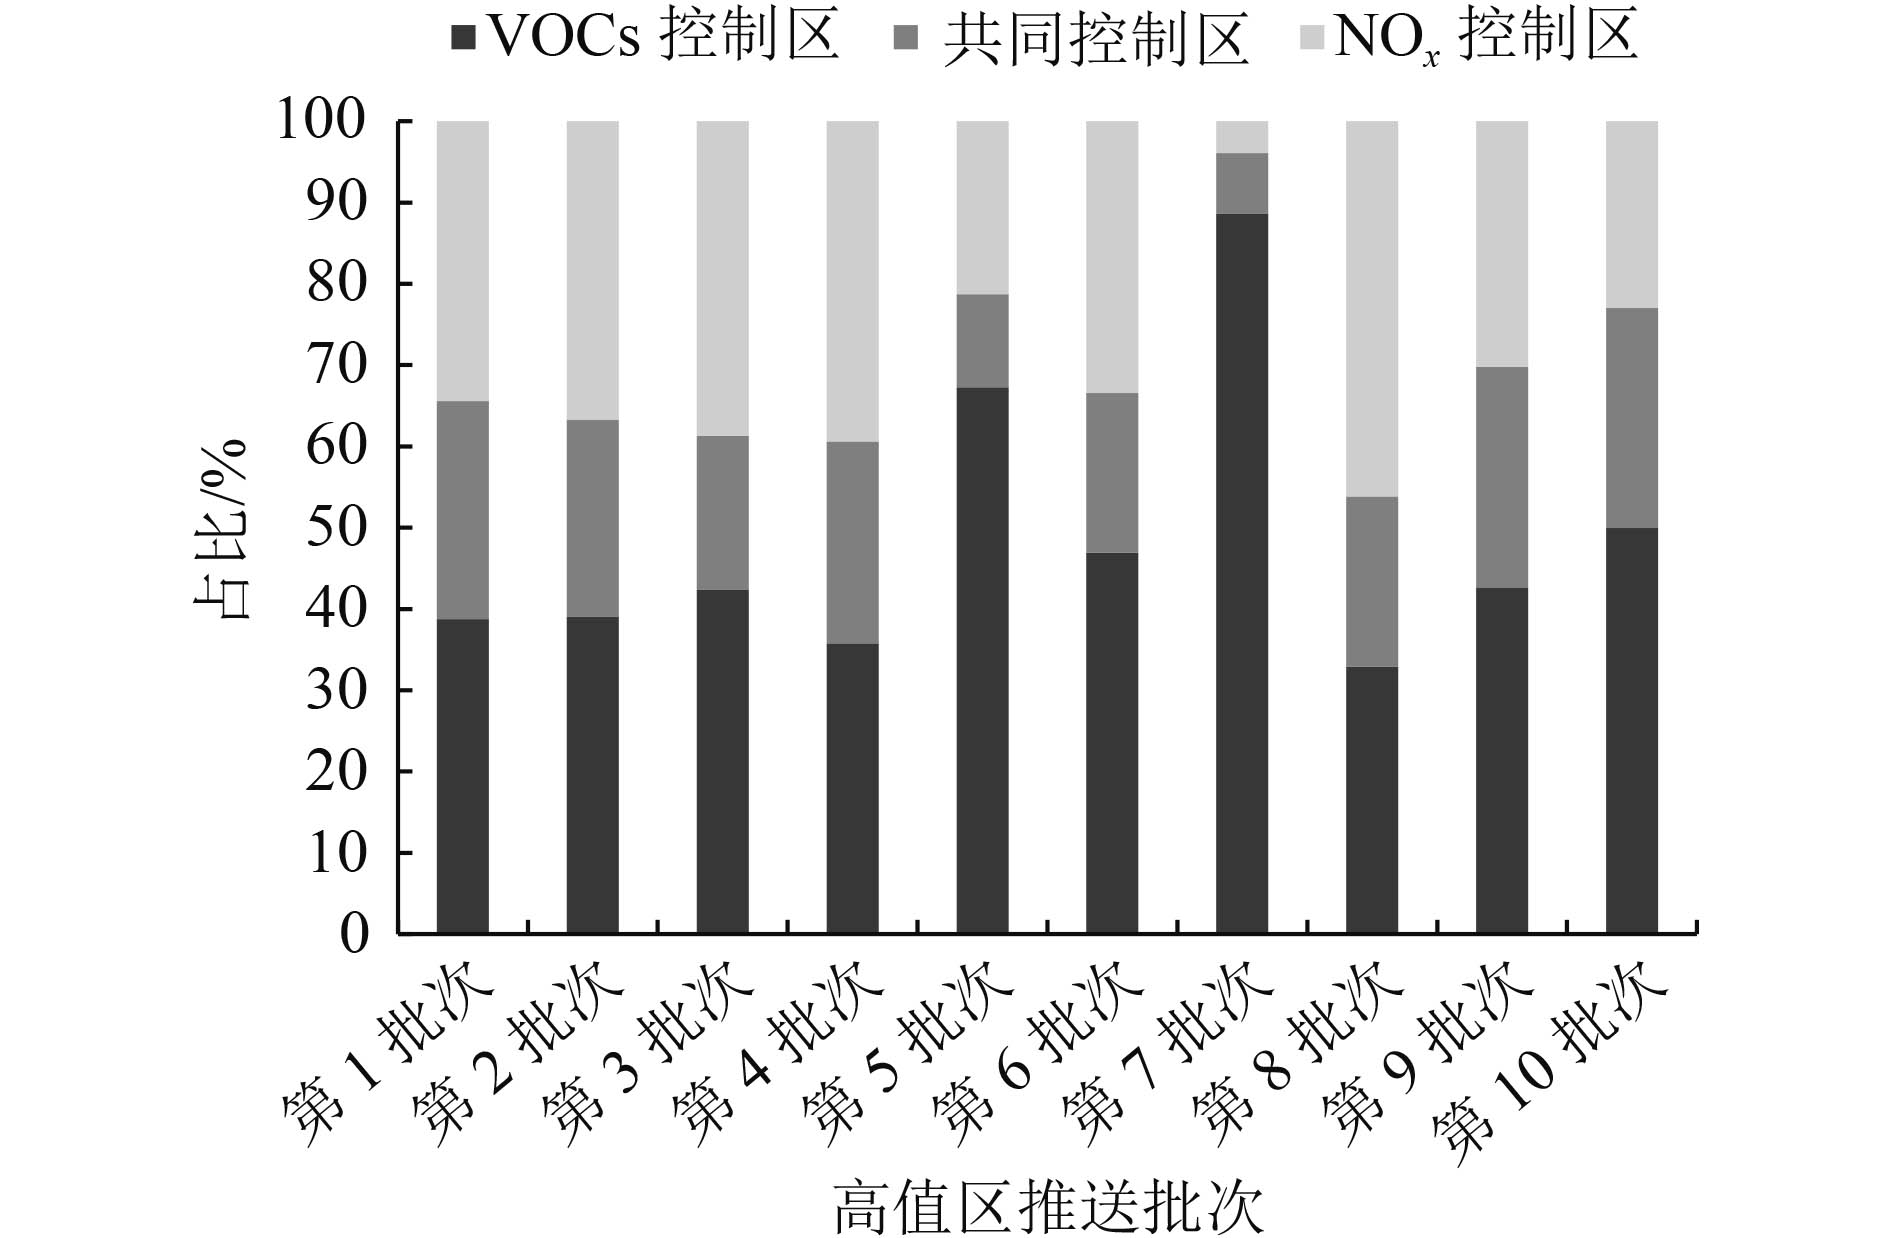
图 9 高值区推送次数及高值区企业问题率统计
Figure 9. Number of push notifications on high ozone production areas and the problem rate of enterprises in high ozone production areas
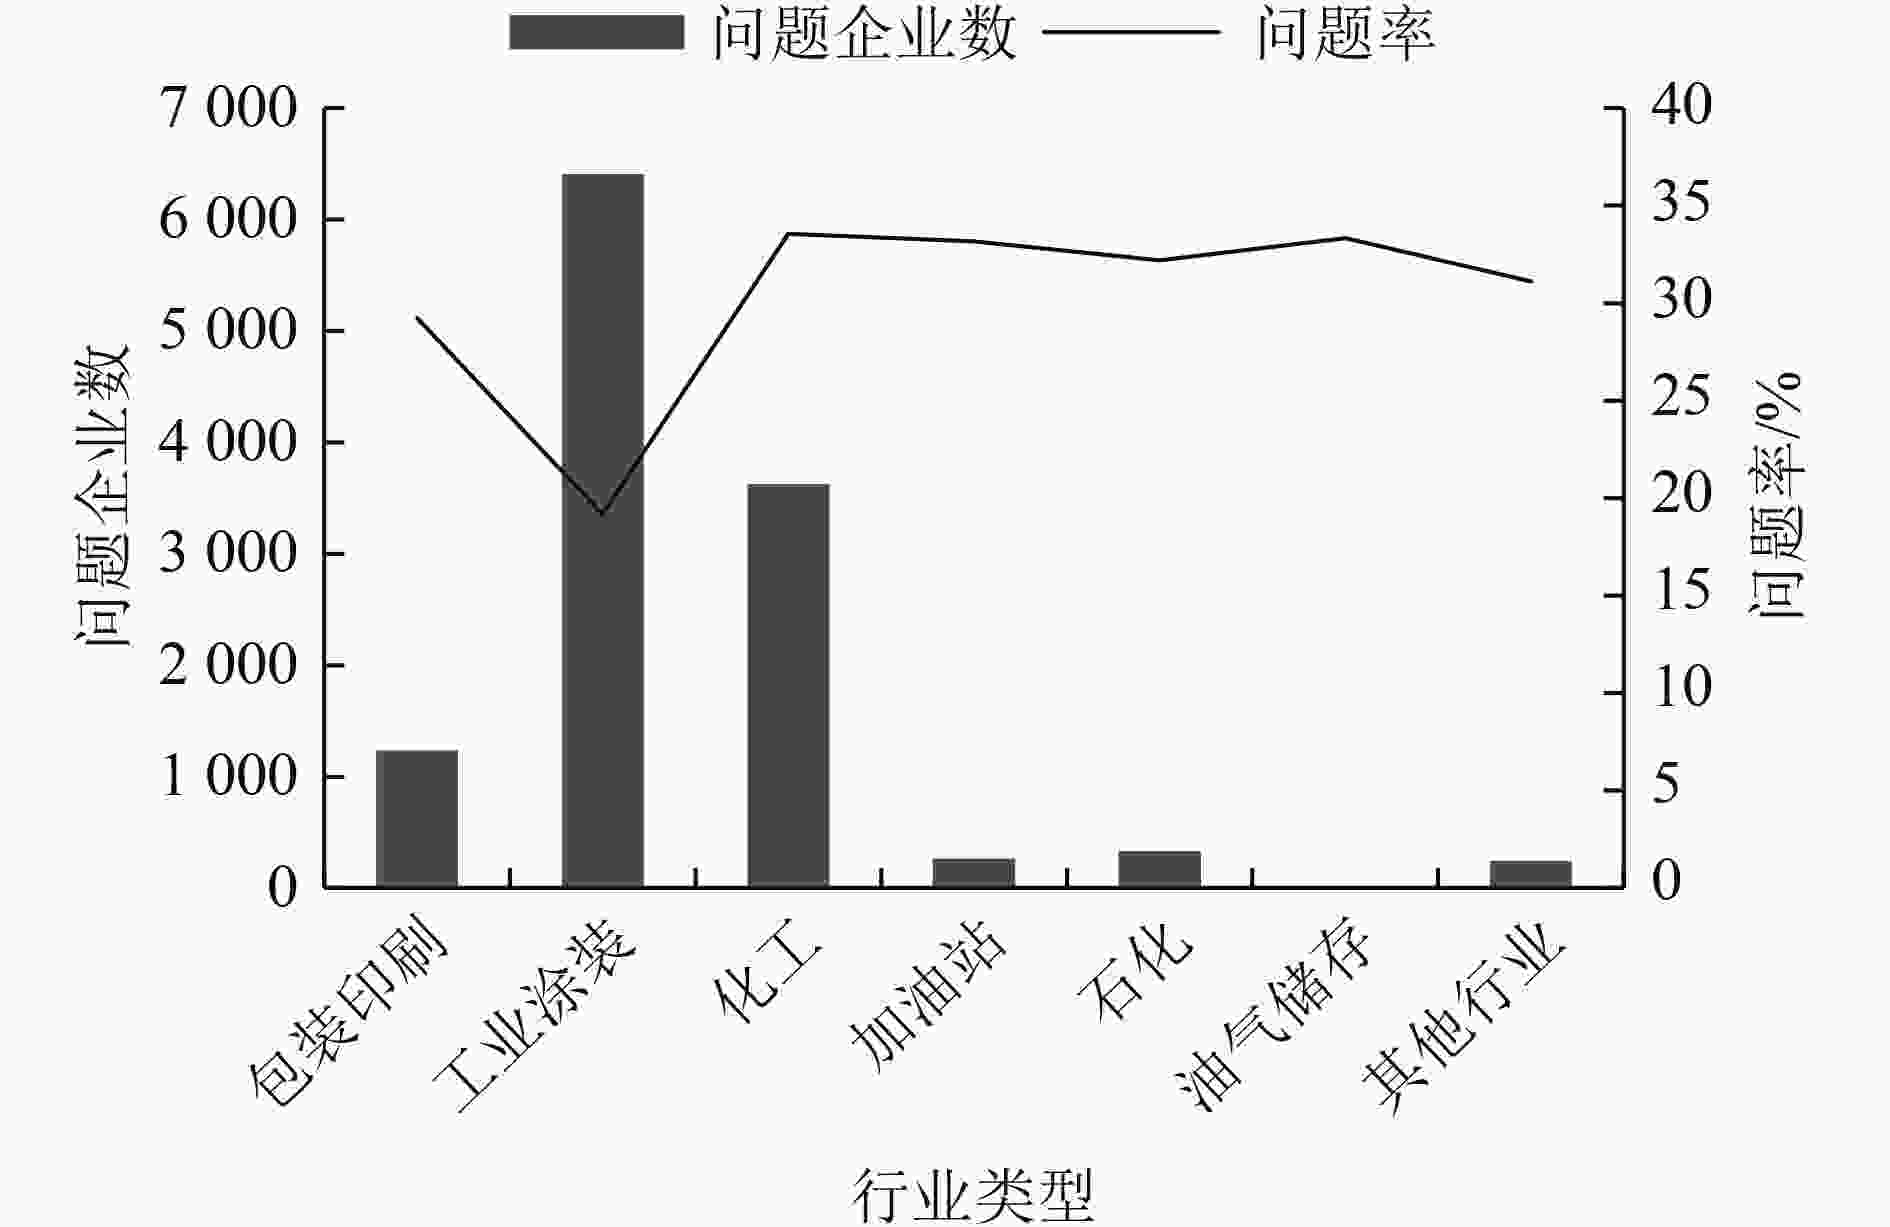
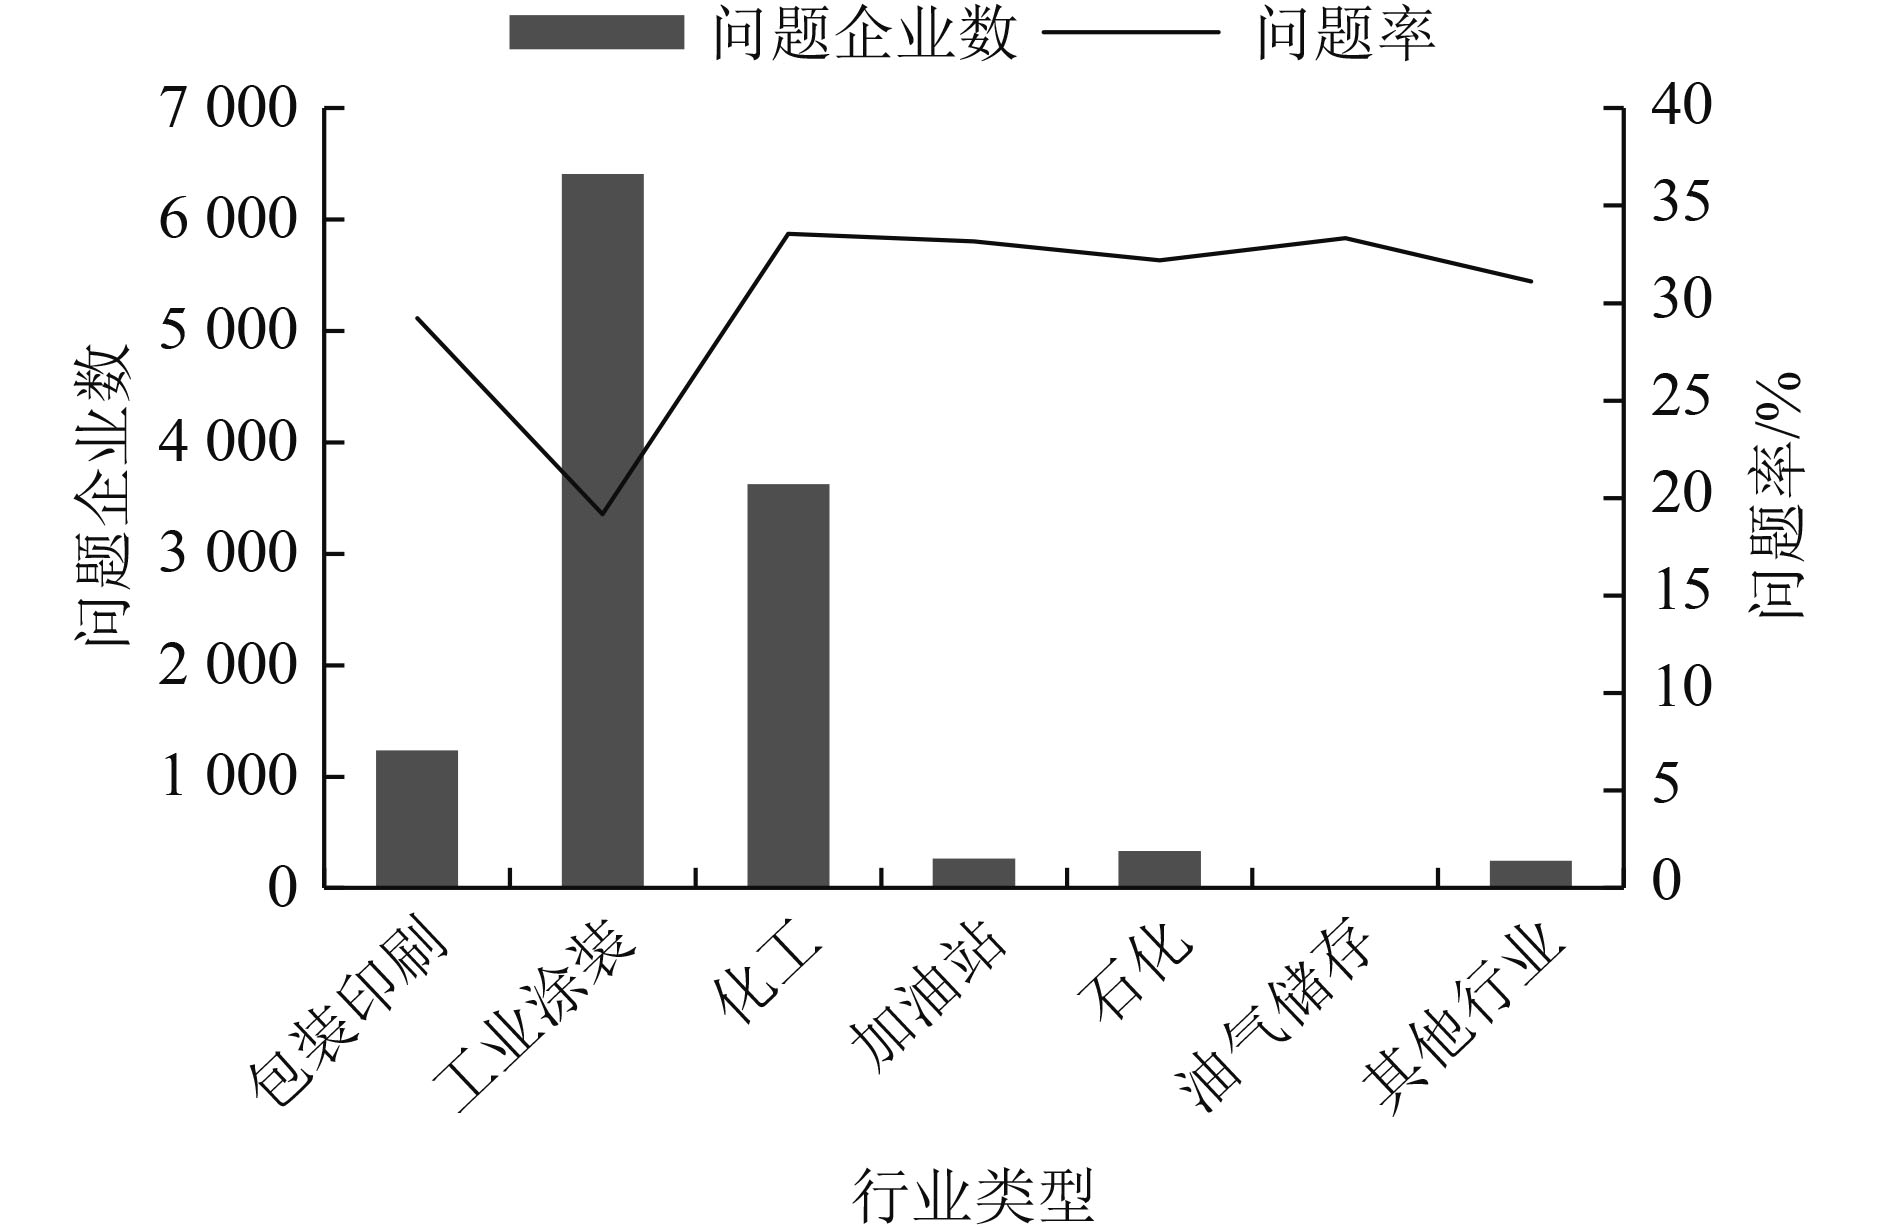
图 10 7类行业涉VOCs的问题企业数及问题率
Figure 10. Problems number and rate of enterprises in 7 types of industries involving VOCs
表 1 各轮次检查中发现的问题企业数量统计
Table 1. Statistics of problematic enterprises found in each round of inspection
检查轮次 高值区推
送批次整体区域 高值区 检查企业数 问题企业数 企业问题率/% 检查企业数 问题企业数 企业问题率/% 第1轮 1、2 8 729 3 130 35.9 771 289 37.5 第2轮 2、3 11 182 2 604 23.3 913 263 28.8 第3轮 5、6 12 325 2 473 20.1 1 375 337 24.5 第4轮 7、8 10 279 2 136 20.8 888 202 22.7 第5轮 9、10 8 555 1 773 20.7 639 152 23.8 总计 51 070 12 116 23.7 4 586 1 243 27.1  下载: 导出CSV
表 2 推送4次及以上高值区的各检查轮次企业问题率
Table 2. Problem rate of enterprises in high ozone production areas pushed four times and above in each round of inspection
% 检查轮次 所有高值区 推送5次高值区 推送4次高值区 第1轮 35.9 57.1 58.2 第2轮 23.3 28.6 37.2 第3轮 20.1 50.0 30.0 第4轮 20.8 26.9 30.5 第5轮 20.7 18.8 15.9
下载: 导出CSV
表 3 7类行业高值区和非高值区的企业问题率
Table 3. Problem rate of enterprises in the 7 types of industries in high- and non-high ozone production areas
行业类型 高值区 非高值区 企业问题率差值/% 无问题企业数 问题企业数 合计 企业问题率/% 无问题企业数 问题企业数 合计 企业问题率/% 包装印刷 242 128 370 34.6 2 753 1 108 3 861 28.7 5.9 工业涂装 2 278 724 3 002 24.1 24 717 5 684 30 401 18.7 5.4 化工 623 316 939 33.7 6 557 3 310 9 867 33.5 0.1 加油站 32 17 49 34.7 500 247 747 33.1 1.6 石化 73 31 104 29.8 630 303 933 32.5 −2.7 油气储存 2 1 3 33.3 其他行业 95 27 122 22.1 452 220 672 32.7 −10.6 总计 3 343 1 243 4 586 27.1 35 611 10 873 46 484 23.4 3.7
下载: 导出CSV
-
[1] 生态环境部. 2020年挥发性有机物治理攻坚方案[A/OL]. (2020-06-24)[2022-04-22]. http: //www. mee. gov. cn/xxgk2018/xxgk/xxgk03/202006/t20200624_785827. html. http://www.mee.gov.cn/xxgk2018/xxgk/xxgk03/202006/t20200624_785827.html. [2] LIU J, TARASICK D W, FIOLETOV V E, et al. A global ozone climatology from ozone soundings via trajectory mapping: a stratospheric perspective[J]. Atmospheric Chemistry and Physics,2013,13(22):11441-11464. doi: 10.5194/acp-13-11441-2013 [3] HUANG C, LOU D M, HU Z Y, et al. A PEMS study of the emissions of gaseous pollutants and ultrafine particles from gasoline- and diesel-fueled vehicles[J]. Atmospheric Environment,2013,77:703-710. doi: 10.1016/j.atmosenv.2013.05.059 [4] ZHANG F, ZHAO J, CHEN J, et al. Pollution characteristics of organic and elemental carbon in PM2.5 in Xiamen, China[J]. Journal of Environmental Sciences,2011,23(8):1342-1349. doi: 10.1016/S1001-0742(10)60559-1 [5] 赵龙一, 郭佳华, 张宇航, 等.2015—2019年南阳市臭氧污染特征及气象因素影响[J]. 环境工程技术学报,2022,12(3):718-725. doi: 10.12153/j.issn.1674-991X.20210205ZHAO L Y, GUO J H, ZHANG Y H, et al. Analysis of ozone pollution characteristics and meteorological parameters in Nanyang City from 2015 to 2019[J]. Journal of Environmental Engineering Technology,2022,12(3):718-725. doi: 10.12153/j.issn.1674-991X.20210205 [6] TANG X, WANG Z F, ZHU J, et al. Sensitivity of ozone to precursor emissions in urban Beijing with a Monte Carlo scheme[J]. Atmospheric Environment,2010,44(31):3833-3842. doi: 10.1016/j.atmosenv.2010.06.026 [7] CLEVELAND W S, GRAEDEL T E, KLEINER B, et al. Sunday and workday variations in photochemical air pollutants in New Jersey and New York[J]. Science,1974,186:1037-1038. doi: 10.1126/science.186.4168.1037 [8] MILFORD J B, GAO D F, SILLMAN S, et al. Total reactive nitrogen (NOy) as an indicator of the sensitivity of ozone to reductions in hydrocarbon and NOx emissions[J]. Journal of Geophysical Research Atmospheres,1994,99(D2):3533. doi: 10.1029/93JD03224 [9] DODGE M. Chemistry of oxidant formation: implications for designing effective control strategies[R]. Washington DC: US EPA, 1987. [10] 陈天赐, 潘文斌.基于光化学模型的臭氧生成敏感性研究进展[J]. 环境科学与技术,2019,42(11):201-207. doi: 10.19672/j.cnki.1003-6504.2019.11.029CHEN T C, PAN W B. Research progress of ozone formation sensitivity based on photochemical model[J]. Environmental Science & Technology,2019,42(11):201-207. doi: 10.19672/j.cnki.1003-6504.2019.11.029 [11] MILFORD J B, RUSSELL A G, MCRAE G J. A new approach to photochemical pollution control: implications of spatial patterns in pollutant responses to reductions in nitrogen oxides and reactive organic gas emissions[J]. Environmental Science & Technology,1989,23(10):1290-1301. [12] KLEINMAN L I. Low and high NOx tropospheric photochemistry[J]. Journal of Geophysical Research Atmospheres,1994,99(D8):16831. doi: 10.1029/94JD01028 [13] ZHANG Y H, SU H, ZHONG L J, et al. Regional ozone pollution and observation-based approach for analyzing ozone-precursor relationship during the PRIDE-PRD2004 campaign[J]. Atmospheric Environment,2008,42(25):6203-6218. doi: 10.1016/j.atmosenv.2008.05.002 [14] GENG F H, TIE X X, XU J M, et al. Characterizations of ozone, NOx, and VOCs measured in Shanghai, China[J]. Atmospheric Environment,2008,42(29):6873-6883. doi: 10.1016/j.atmosenv.2008.05.045 [15] CHOU C C K, TSAI C Y, SHIU C J, et al. Measurement of NOy during Campaign of Air Quality Research in Beijing 2006 (CARE Beijing-2006): implications for the ozone production efficiency of NOx[J]. Journal of Geophysical Research Atmospheres,2009,114:D00G01. [16] XING J, WANG S X, JANG C, et al. Nonlinear response of ozone to precursor emission changes in China: a modeling study using response surface methodology[J]. Atmospheric Chemistry and Physics,2011,11(10):5027-5044. doi: 10.5194/acp-11-5027-2011 [17] TANG G, WANG Y, LI X, et al. Spatial-temporal variations in surface ozone in Northern China as observed during 2009-2010 and possible implications for future air quality control strategies[J]. Atmospheric Chemistry and Physics,2012,12(5):2757-2776. doi: 10.5194/acp-12-2757-2012 [18] WANG T, XUE L K, BRIMBLECOMBE P, et al. Ozone pollution in China: a review of concentrations, meteorological influences, chemical precursors, and effects[J]. Science of the Total Environment,2017,575:1582-1596. doi: 10.1016/j.scitotenv.2016.10.081 [19] 王宇骏, 黄新雨, 裴成磊, 等.广州市近地面臭氧时空变化及其生成对前体物的敏感性初步分析[J]. 安全与环境工程,2016,23(3):83-88. doi: 10.13578/j.cnki.issn.1671-1556.2016.03.014WANG Y J, HUANG X Y, PEI C L, et al. Spatial-temporal variations of ground-level ozone and preliminary analysis on the sensitivity of ozone formation to precursors in Guangzhou City[J]. Safety and Environmental Engineering,2016,23(3):83-88. doi: 10.13578/j.cnki.issn.1671-1556.2016.03.014 [20] 中国环境科学学会臭氧污染控制专业委员会. 中国大气臭氧污染防治蓝皮书(2020年)[M]. 北京: 科学出版社, 2020. [21] 李霄阳, 李思杰, 刘鹏飞, 等.2016年中国城市臭氧浓度的时空变化规律[J]. 环境科学学报,2018,38(4):1263-1274. doi: 10.13671/j.hjkxxb.2017.0399LI X Y, LI S J, LIU P F, et al. Spatial and temporal variations of ozone concentrations in China in 2016[J]. Acta Scientiae Circumstantiae,2018,38(4):1263-1274. doi: 10.13671/j.hjkxxb.2017.0399 [22] 蒋美青, 陆克定, 苏榕, 等.我国典型城市群臭氧形成机制和关键VOCs的反应活性分析[J]. 科学通报,2018,63(12):1130-1141. [23] 陈楠, 陆兴成, 姚腾, 等.湖北臭氧分布特征及其管控措施[J]. 中国环境监测,2017,33(4):150-158. doi: 10.19316/j.issn.1002-6002.2017.04.19CHEN N, LU X C, YAO T, et al. Ozone distribution characteristics and its control measures in Hubei[J]. Environmental Monitoring in China,2017,33(4):150-158. doi: 10.19316/j.issn.1002-6002.2017.04.19 [24] SILLMAN S. The use of NOy, H2O2, and HNO3 as indicators for ozone-NOx-hydrocarbon sensitivity in urban locations[J]. Journal of Geophysical Research Atmospheres,1995,100(D7):14175. doi: 10.1029/94JD02953 [25] MARTIN R V, FIORE A M, van DONKELAAR A. Space-based diagnosis of surface ozone sensitivity to anthropogenic emissions[J]. Geophysical Research Letters,2004,31(6):337-357. [26] MARTIN R V. Global inventory of nitrogen oxide emissions constrained by space-based observations of NO2 columns[J]. Journal of Geophysical Research Atmospheres,2003,108(D17):4537. doi: 10.1029/2003JD003453 [27] MILLET D B, JACOB D J, TURQUETY S, et al. Formaldehyde distribution over North America: implications for satellite retrievals of formaldehyde columns and isoprene emission[J]. Journal of Geophysical Research Atmospheres,2006,111(D24):D24S02. [28] DUNCAN B N, YOSHIDA Y, OLSON J R, et al. Application of OMI observations to a space-based indicator of NOx and VOC controls on surface ozone formation[J]. Atmospheric Environment,2010,44(18):2213-2223. doi: 10.1016/j.atmosenv.2010.03.010 [29] 单源源, 李莉, 刘琼, 等.基于OMI数据的中国中东部臭氧及前体物的时空分布[J]. 环境科学研究,2016,29(8):1128-1136. doi: 10.13198/j.issn.1001-6929.2016.08.04SHAN Y Y, LI L, LIU Q, et al. Spatial-temporal distribution of ozone and its precursors over central and Eastern China based on OMI data[J]. Research of Environmental Sciences,2016,29(8):1128-1136. doi: 10.13198/j.issn.1001-6929.2016.08.04 [30] 武卫玲, 薛文博, 雷宇, 等.基于OMI数据的京津冀及周边地区O3生成敏感性[J]. 中国环境科学,2018,38(4):1201-1208. doi: 10.3969/j.issn.1000-6923.2018.04.001WU W L, XUE W B, LEI Y, et al. Sensitivity analysis of ozone in Beijing-Tianjin-Hebei (BTH) and its surrounding area using OMI satellite remote sensing data[J]. China Environmental Science,2018,38(4):1201-1208. doi: 10.3969/j.issn.1000-6923.2018.04.001 [31] 庄立跃, 陈瑜萍, 范丽雅, 等.基于OMI卫星数据和MODIS土地覆盖类型数据研究珠江三角洲臭氧敏感性[J]. 环境科学学报,2019,39(11):3581-3592.ZHUANG L Y, CHEN Y P, FAN L Y, et al. Study on the ozone formation sensitivity in the Pearl River Delta based on OMI satellite data and MODIS land cover type products[J]. Acta Scientiae Circumstantiae,2019,39(11):3581-3592. [32] 李泽琨. 珠江三角洲地区臭氧及其前体物非线性响应特征及控制对策研究[D]. 广州: 华南理工大学, 2015. [33] JIN X M, HOLLOWAY T. Spatial and temporal variability of ozone sensitivity over China observed from the ozone monitoring instrument[J]. Journal of Geophysical Research:Atmospheres,2015,120(14):7229-7246. doi: 10.1002/2015JD023250 [34] WEI X L, LI Y S, LAM K S, et al. Impact of biogenic VOC emissions on a tropical cyclone-related ozone episode in the Pearl River Delta region, China[J]. Atmospheric Environment,2007,41(36):7851-7864. doi: 10.1016/j.atmosenv.2007.06.012 [35] HUGHES A. Strategic database marketing[M].New York:McGraw-Hill, 2005. [36] 张文强, 刘诚, 郝楠, 等.O2-O2云反演算法及其在TROPOMI上的应用[J]. 遥感学报,2020,24(11):1363-1378.ZHANG W Q, LIU C, HAO N, et al. O2-O2 cloud retrieval algorithm and application to TROPOMI[J]. Journal of Remote Sensing,2020,24(11):1363-1378. [37] ESA. Sentinel-5P TROPOMI User Guide[EB/OL]. [2022-05-26]. https://sentinels.copernicus.eu/web/sentinel/user-guides/sentinel-5p-tropomi. [38] 李旭文, 张悦, 姜晟, 等.“哨兵-5P”卫星TROPOMI传感器在江苏省域大气污染监测中的初步应用[J]. 环境监控与预警,2019,11(2):10-16. doi: 10.3969/j.issn.1674-6732.2019.02.002LI X W, ZHANG Y, JIANG S, et al. Preliminary application of atmospheric pollution monitoring in Jiangsu Province with TROPOMI sensor onboard sentinel-5P satellite[J]. Environmental Monitoring and Forewarning,2019,11(2):10-16. doi: 10.3969/j.issn.1674-6732.2019.02.002 [39] NASA. Earth data, LP DAAC[EB/OL]. [2022-05-26]. https://lpdaac.usgs.gov. https://lpdaac.usgs.gov.2022-05-26/. [40] 成方妍, 刘世梁, 尹艺洁, 等.基于MODIS NDVI的广西沿海植被动态及其主要驱动因素[J]. 生态学报,2017,37(3):788-797.CHENG F Y, LIU S L, YIN Y J, et al. The dynamics and main driving factors of coastal vegetation in Guangxi based on MODIS NDVI[J]. Acta Ecologica Sinica,2017,37(3):788-797. □ -

 下载:
下载:


 点击查看大图

计量
- 文章访问数: 224
- HTML全文浏览量: 224
- PDF下载量: 31
- 被引次数: 0