

Effect of urban spatial development on spatial and temporal variation of NO2 concentration in Wuchangshi Metropolitan Area
-
摘要:
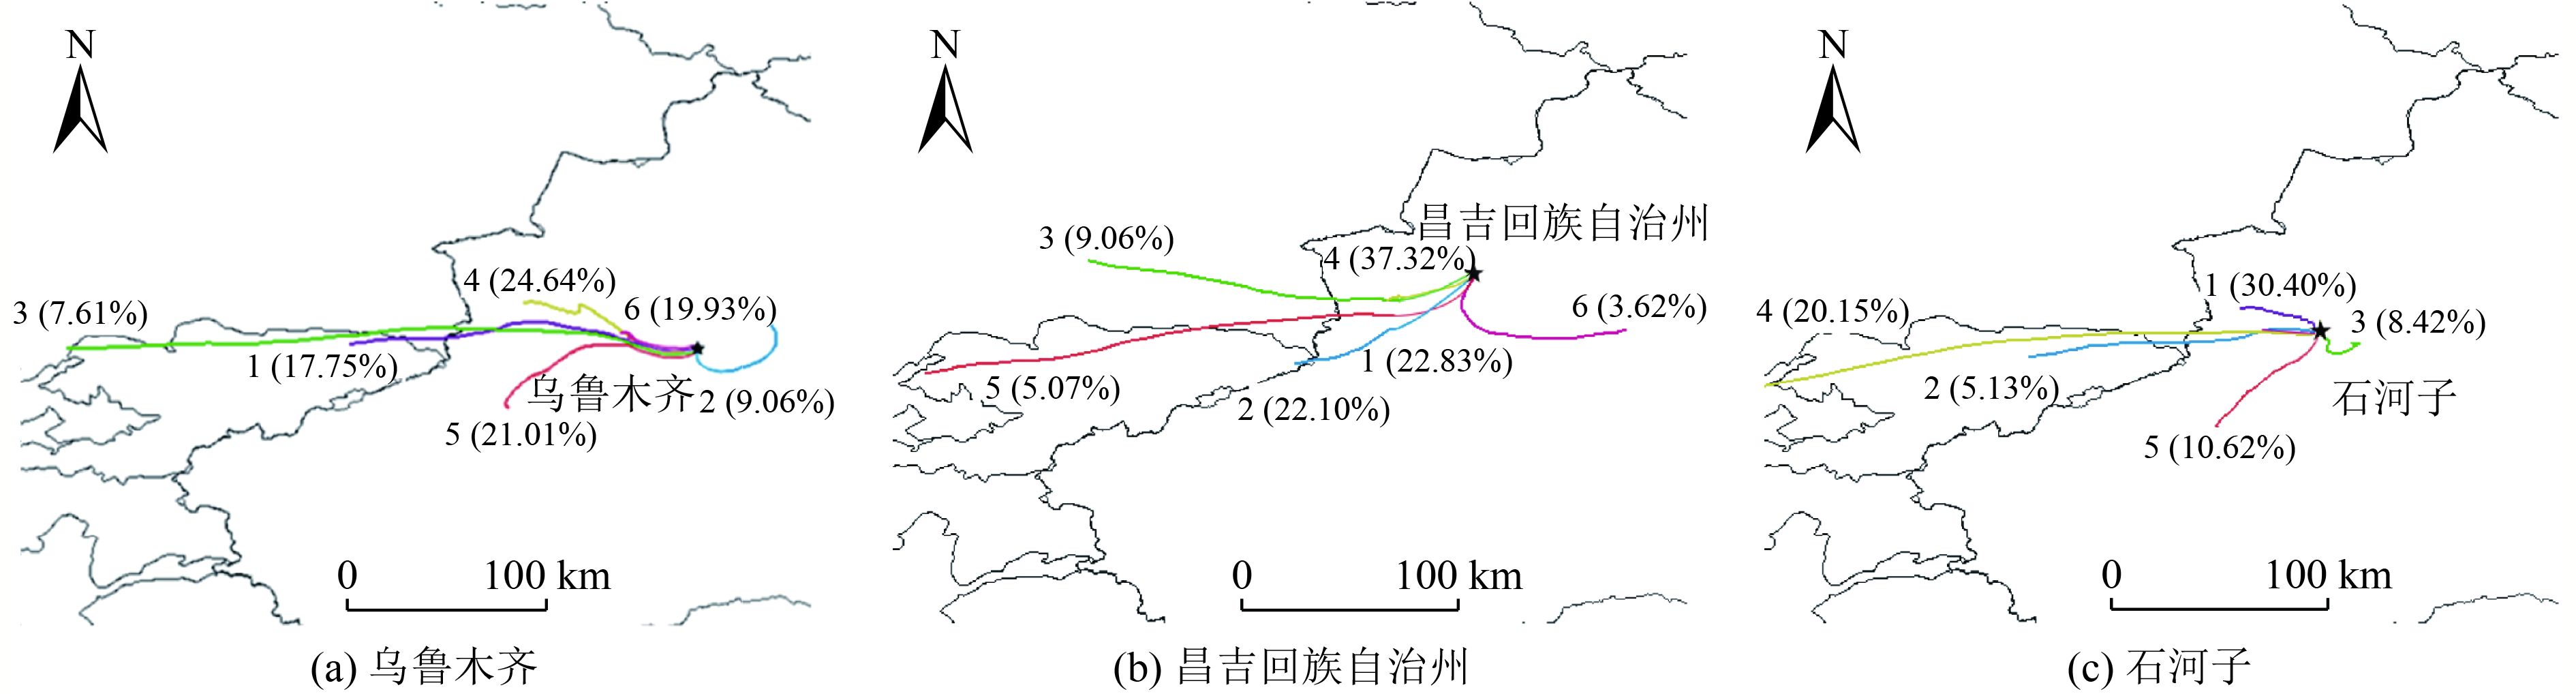
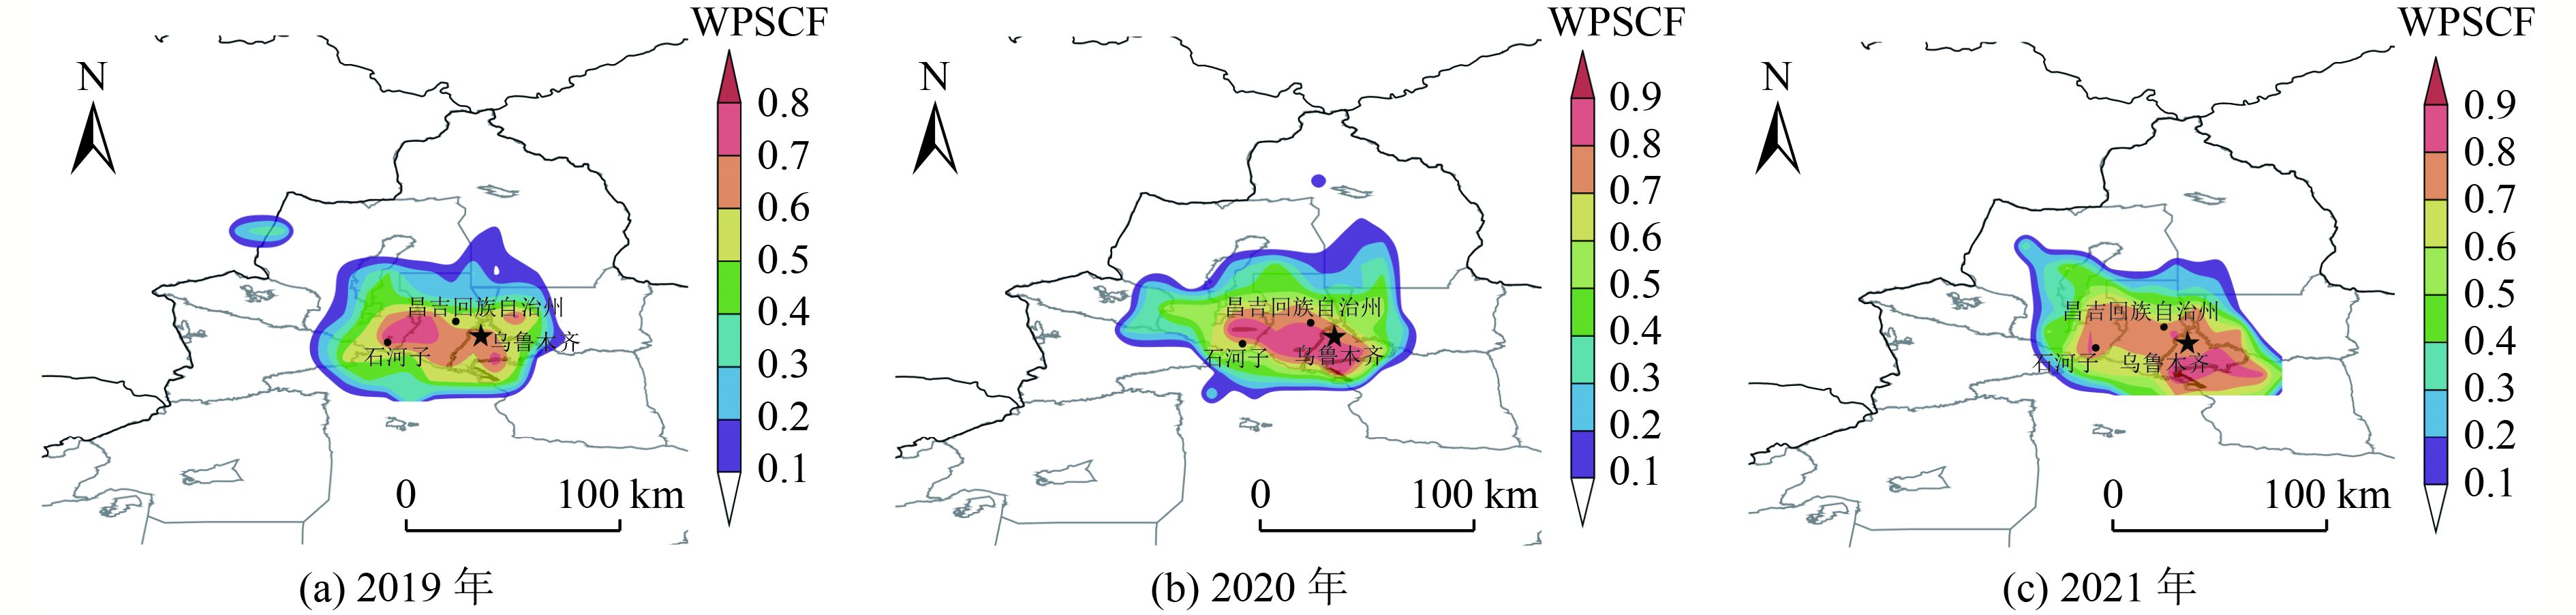
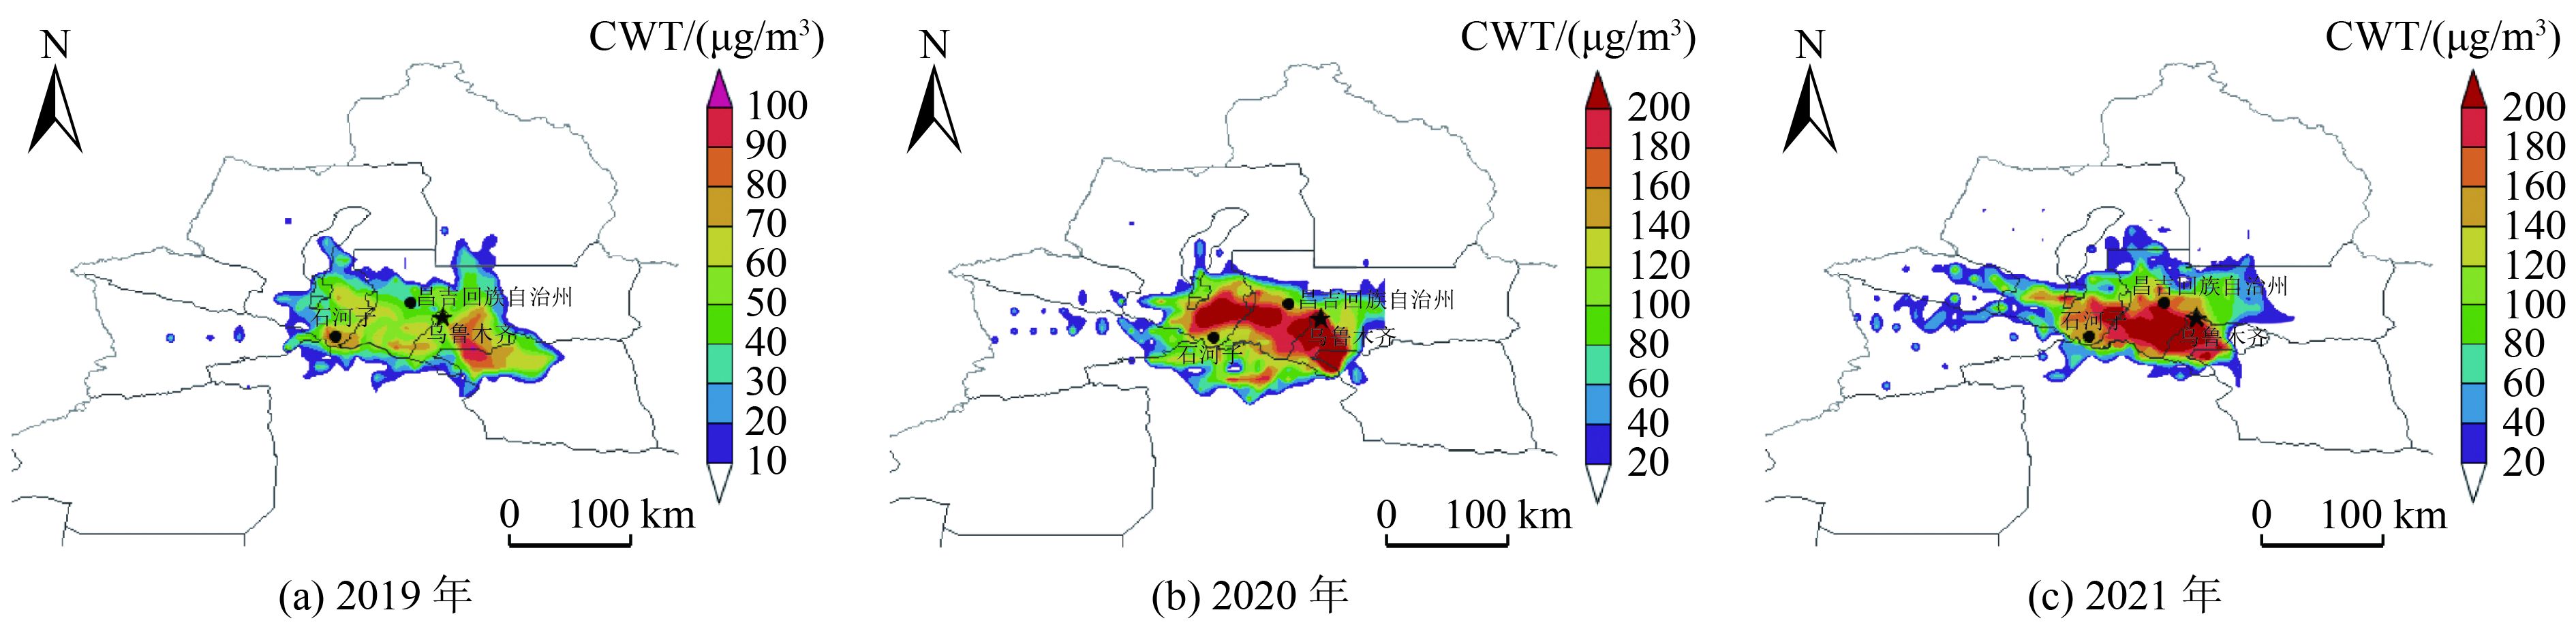
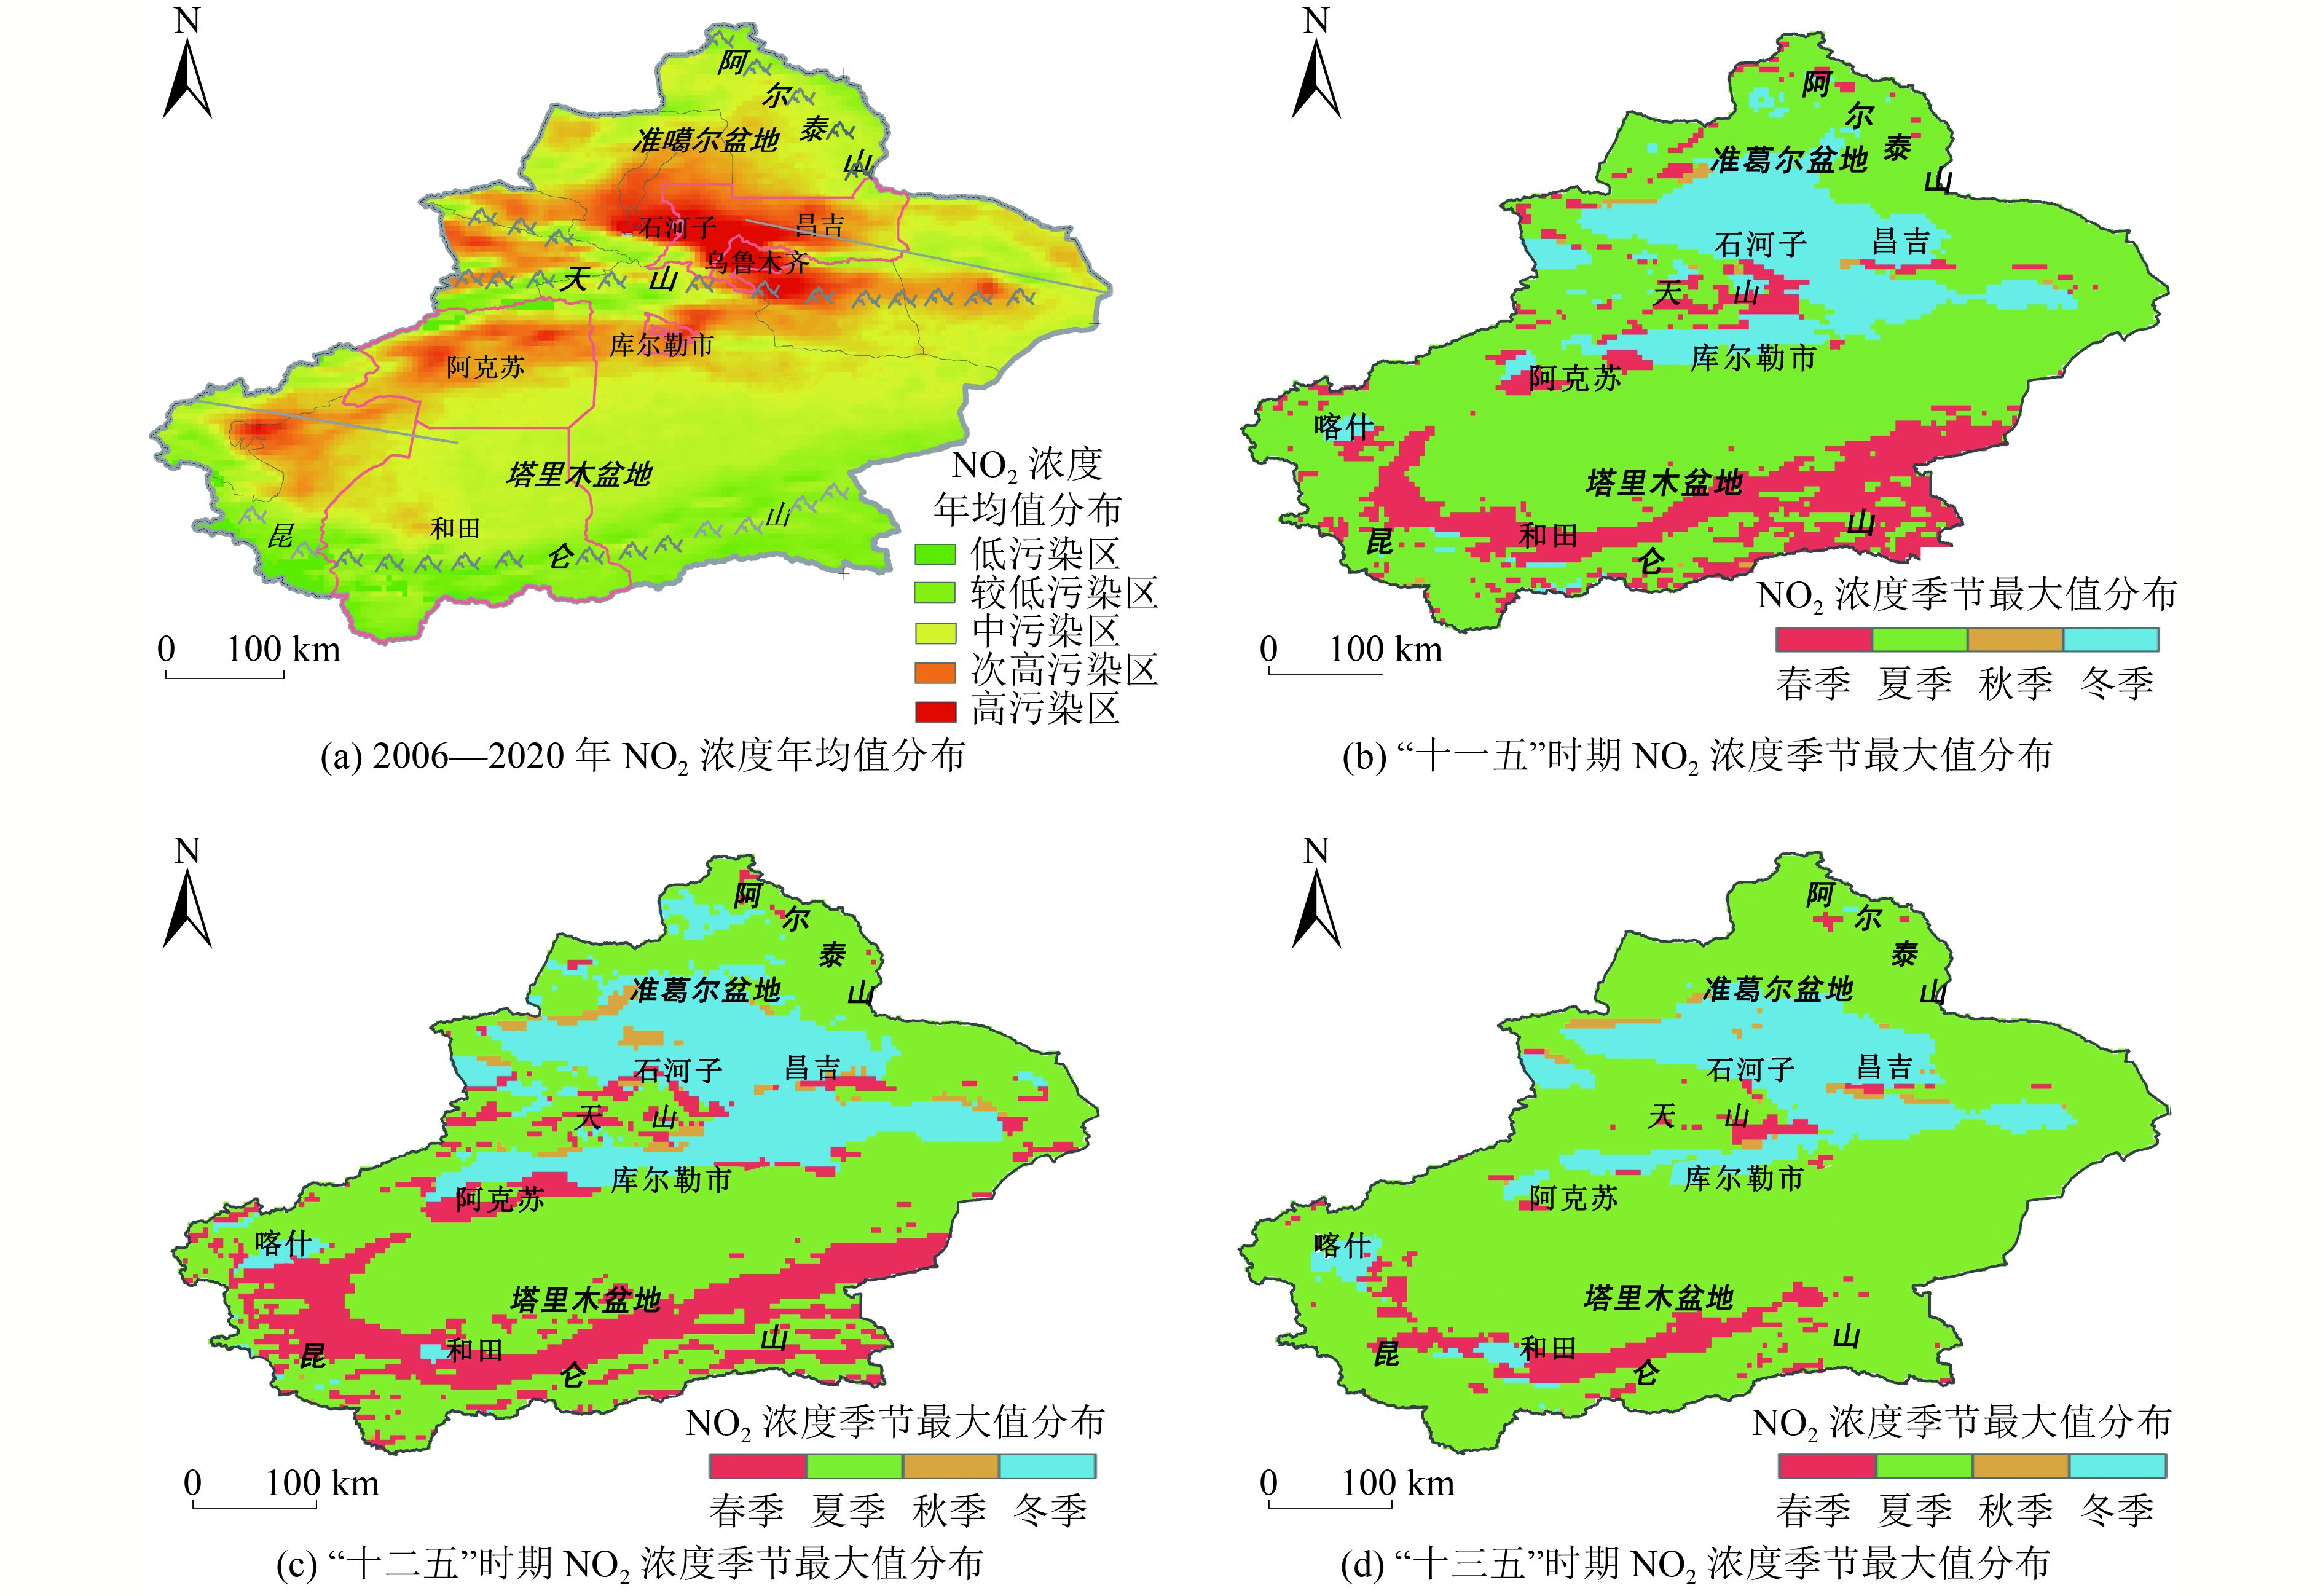
为探究城市空间发展对天山北坡经济带重心乌昌石都市圈NO2污染的影响,利用多源遥感数据对乌昌石都市圈NO2排放量时空变化进行研究。结果表明:基于2006—2020年OMI遥感数据,按全疆NO2平均排放量大小进行划分后发现,新疆地区NO2低污染区为和田等小城市,较低污染区为喀什及哈密等地区,中污染区在其中西部地区,次高污染区出现在天山南坡中等城市巴音郭楞蒙古自治州中部,高污染区在乌昌石都市圈。在空间格局上,城镇用地与建设用地以乌鲁木齐市五大城区为中心,以昌吉回族自治州昌吉市、阜康市及石河子市城区为副中心不断增长。乌昌石都市圈城市化进程加快,距离城区越近NO2浓度越高,对其周围环境的污染程度越高。乌昌石都市圈2次疫情防控时,NO2浓度下降幅度最大。对新型冠状病毒感染疫情防控前后(2019—2021年)乌昌石都市圈潜在源贡献因子(PSCF)及浓度权重轨迹(CWT)进行分析,结果表明主要潜在源区为乌鲁木齐本地区域以及昌吉回族自治州西南部邻近城市。
Abstract:In order to explore the impact of urban spatial development on NO pollution in Wuchangshi Metropolitan Area, the center of gravity of the north slope of Tianshan Mountain Economic Belt, multi-source remote sensing data was used to study the temporal and spatial variation of NO emissions in Wuchangshi Metropolitan Area. The results show that: based on the OMI remote sensing data from 2006 to 2020, according to the average amount of NO2 emission in Xinjiang, it is found that the low emission zone of NO2 in Xinjiang is Hotan and other small cities; the low emission zone is Kashgar and Hami and other regions; the medium emission zone 1 is in the western part of Xinjiang; the second high emission zone appears in the middle of Bayingoleng Mongolian Autonomous Prefecture, a medium-sized city on the southern slope, and the high pollution emission zone In the Wuchangshi Metropolitan Area. In terms of spatial pattern, the urban land and construction land are growing with one city and five urban districts of Urumqi as the main center, and Changji City, Fukang City and Shihezi City as the sub-centers. The urbanization process of Wuchangshi Metropolitan Area is accelerated, and the closer it is to the urban area, the more N. The higher the concentration, the higher the degree of pollution to the surrounding environment. During the second management in Wuchangshi Metropolitan Area, the concentration of NO decreased the most. The potential source contribution factor (PSCF) and concentration weight locus (CWT) of Wuchangshi Metropolitan Area were analyzed before and after the critical period of novel coronavirus (2019-2021). The results showed that the main potential source areas were the local region of Urumqi and the neighboring cities in the southwest of Changji Hui Autonomous Prefecture.
-

图 3 2019—2021年气流轨迹聚类统计分析结果
注:图中★表示本地主要污染排放源位置,通过聚类分为6条输送轨迹,百分数表示轨迹数占总轨迹数的比例。
Figure 3. Clustering statistical analysis results of air flow trajectory from 2019 to 2021

图 5 2019—2021年NO2的浓度权重轨迹
Figure 5. Weight trajectory of NO2 CWT concentration from 2019 to 2021
表 1 各阶段同期NO2浓度变化情况
Table 1. Changes of NO2 concentration in each stage
地区 年份 1月1—
26日1月27日—
3月4日3月5日—
7月16日7月17日—
9月1日9月2日—
12月31日乌鲁木齐 2019 66.73 58.64 32.17 30.35 47.13 2020 61.84 38.19 21.96 15.72 36.96 2021 60.75 46.88 23.49 28.47 39.43 昌吉回族
自治州2019 33.51 33.08 22.92 23.29 27.53 2020 48.29 27.03 17.56 10.93 30.50 2021 34.15 26.25 13.48 15.92 22.15 石河子 2019 59.47 43.67 28.16 28.82 43.24 2020 59.84 27.26 24.23 23.27 43.15 2021 64.55 48.68 25.99 28.96 42.02  下载: 导出CSV
表 2 城市NO2浓度与功能区数量关系
Table 2. Relationship between NO2 concentration and the number of functional areas
地区 NO2平均
浓度/
(molec/cm2)功能区数量 餐饮
购物住宅 科教 企业
公司乌鲁木齐 工业区 34 16 578 671 513 3 730 市区 45 54 264 3835 3 110 7 419 昌吉回族
自治州工业区 28 26 10 13 73 市区 47 2 722 164 157 253 石河子 工业区 48 1 253 73 228 302 市区 52 1 712 182 527 400
下载: 导出CSV
表 3 气象因素统计
Table 3. Meteorological factor statistics
区域 气象因素 春季 夏季 秋季 冬季 乌鲁木齐 主导风向 西北风 西北风 北风 北风 平均风速/(m/s) 23 8~12 8~12 4~8 24 h内强降温次数 10 6 5 4 昌吉回族自治州 主导风向 北风 北风 北风 北风 平均风速/(m/s) 8~12 8~12 4~8 0~4 24 h内强降温次数 10 16 8 6 石河子 主导风向 北风 北风 西北风 北风 平均风速/(m/s) 8~12 8~12 4~8 0~4 24 h内强降温次数 11 4 3 5
下载: 导出CSV
-
[1] 胡明远, 龚璞, 陈怀锦, 等.“十四五”时期我国城市群高质量发展的关键: 培育现代化都市圈[J]. 行政管理改革,2020(12):19-29. doi: 10.3969/j.issn.1674-7453.2020.12.003HU M Y, GONG P, CHEN H J, et al. The key to high-quality development of China's city clusters in the 14th Five-Year Plan period: building the modern metropolitan areas[J]. Administration Reform,2020(12):19-29. doi: 10.3969/j.issn.1674-7453.2020.12.003 [2] ZHU Y J, ZHAN Y, WANG B, et al. Spatiotemporally mapping of the relationship between NO2 pollution and urbanization for a megacity in Southwest China during 2005-2016[J]. Chemosphere,2019,220:155-162. doi: 10.1016/j.chemosphere.2018.12.095 [3] HAN L J, ZHOU W Q, LI W F, et al. Urbanization strategy and environmental changes: an insight with relationship between population change and fine particulate pollution[J]. Science of the Total Environment,2018,642:789-799. doi: 10.1016/j.scitotenv.2018.06.094 [4] GROSSMAN G, KRUEGER A. Environmental impacts of a North American free trade agreement[R]. National Bureau of Economic Research, 1991. [5] 朱杰, 许月阳, 姜岸, 等.超低排放下不同湿法脱硫协同控制颗粒物性能测试与研究[J]. 中国电力,2017,50(1):168-172. doi: 10.11930/j.issn.1004-9649.2017.01.168.05ZHU J, XU Y Y, JIANG A, et al. Test and study on performance of wet FGD coordinated particulate matter control for ultra-low pollutants emission[J]. Electric Power,2017,50(1):168-172. doi: 10.11930/j.issn.1004-9649.2017.01.168.05 [6] 木尼拉·阿不都木太力甫, 玉米提·哈力克, 塔依尔江·艾山, 等.乌鲁木齐市主要大气污染物浓度变化特征研究[J]. 生态环境学报,2018,27(3):533-541.MUNILA A, ÜMÜT H, TAYIERJIANG A, et al. Variation characteristics of the main atmospheric pollutant concentration in Urumqi[J]. Ecology and Environmental Sciences,2018,27(3):533-541. [7] 汪蕊, 丁建丽, 马雯, 等.基于PSCF与CWT模型的乌鲁木齐市大气颗粒物源区分析[J]. 环境科学学报,2021,41(8):3033-3042. doi: 10.13671/j.hjkxxb.2021.0044WANG R, DING J L, MA W, et al. Analysis of atmospheric particulates source in Urumqi based on PSCF and CWT models[J]. Acta Scientiae Circumstantiae,2021,41(8):3033-3042. doi: 10.13671/j.hjkxxb.2021.0044 [8] ZHAO S P, YU Y, QIN D H, et al. Analyses of regional pollution and transportation of PM2.5 and ozone in the city clusters of Sichuan Basin, China[J]. Atmospheric Pollution Research,2019,10(2):374-385. doi: 10.1016/j.apr.2018.08.014 [9] WANG T, XUE L K, BRIMBLECOMBE P, et al. Ozone pollution in China: a review of concentrations, meteorological influences, chemical precursors, and effects[J]. Science of the Total Environment,2017,575:1582-1596. doi: 10.1016/j.scitotenv.2016.10.081 [10] 王琰玮, 王媛, 张增凯, 等.不同季节天津市PM2.5与O3潜在源区及传输路径分析[J]. 环境科学研究,2022,35(3):673-682.WANG Y W, WANG Y, ZHANG Z K, et al. Analysis of potential source areas and transport pathways of PM2.5 and O3 in Tianjin by season[J]. Research of Environmental Sciences,2022,35(3):673-682. [11] 贺忠发, 曹月娥, 何浩天, 等.乌昌石地区城镇化与资源环境耦合协调研究[J]. 安徽农业科学,2022,50(1):86-91. doi: 10.3969/j.issn.0517-6611.2022.01.022HE Z F, CAO Y E, HE H T, et al. Research on the coupling coordination between urbanization and resources and environment in Wuchangshi area[J]. Journal of Anhui Agricultural Sciences,2022,50(1):86-91. doi: 10.3969/j.issn.0517-6611.2022.01.022 [12] REN B, XIE P H, XU J, et al. Use of the PSCF method to analyze the variations of potential sources and transports of NO2, SO2, and HCHO observed by MAX-DOAS in Nanjing, China during 2019[J]. Science of the Total Environment,2021,782:146865. doi: 10.1016/j.scitotenv.2021.146865 [13] 赵晓蓉. 乌鲁木齐—昌吉地区城乡结合部大气NO2 时空动态变化研究[D]. 乌鲁木齐: 新疆师范大学, 2022. [14] 苏锦涛, 张成歆, 胡启后, 等.基于卫星高光谱遥感的2007年—2017年新疆地区大气NO2时空变化趋势分析[J]. 光谱学与光谱分析,2021,41(5):1631-1638.SU J T, ZHANG C X, HU Q H, et al. Analysis of spatial and temporal change trend of Xinjiang NO2 in 2007-2017 based on satellite hyperspectral remote sensing[J]. Spectroscopy and Spectral Analysis,2021,41(5):1631-1638. [15] 程韵初, 吴莹.基于OMI资料的中国对流层NO2柱浓度时空变化及其影响因子分析[J]. 地球物理学进展,2020,35(5):1644-1650. doi: 10.6038/pg2020DD0237CHENG Y C, WU Y. Spatiotemporal changes of tropospheric NO2 vertical column densities in China based on OMI data and its influencing factors[J]. Progress in Geophysics,2020,35(5):1644-1650. doi: 10.6038/pg2020DD0237 [16] AHMAD S P, LEVELT P F, BHARTIA P K, et al. Atmospheric products from the ozone monitoring instrument (OMI)[C]//Optical Science and Technology. San Diego, 2003: 619-630. [17] YIENGER J J, LEVY H I. Empirical model of global soil-biogenic NOx emissions[J]. Journal of Geophysical Research:Atmospheres,1995,100(D6):11447-11464. doi: 10.1029/95JD00370 [18] HE Y J, UNO I, WANG Z F, et al. Variations of the increasing trend of tropospheric NO2 over central East China during the past decade[J]. Atmospheric Environment,2007,41(23):4865-4876. doi: 10.1016/j.atmosenv.2007.02.009 [19] WANG X Y. Impact of spatial structure of urban agglomerations on air pollution in China[J]. China Population, Resources and Environment,2020,30(10):28-35. [20] 王桂玲, 杨德刚, 闫海龙, 等.中心城市发展与城市群产业整合发展研究: 以乌昌石城市群为例[J]. 干旱区研究,2016,33(2):434-440.WANG G L, YANG D G, YAN H L, et al. Development in central city and the industry integration in urban agglomeration: a case study on Urumqi-Changji-Shihezi Urban Agglomeration[J]. Arid Zone Research,2016,33(2):434-440. [21] 李倩.跨界环境治理目标责任制的运行逻辑与治理绩效: 以京津冀大气治理为例[J]. 北京行政学院学报,2020(4):17-27. doi: 10.3969/j.issn.1008-7621.2020.04.003LI Q. The running logic and governance performance of the target-oriented responsibility system for cross-regional environmental governance: a case study of the air-pollution prevention and treatment in Beijing-Tianjin-Hebei[J]. Journal of Beijing Administration Institute,2020(4):17-27. doi: 10.3969/j.issn.1008-7621.2020.04.003 [22] 刘新春, 陈红娜, 赵克蕾, 等.乌鲁木齐大气细颗粒物PM2.5水溶性离子浓度特征及其来源分析[J]. 生态环境学报,2015,24(12):2002-2008.LIU X C, CHEN H N, ZHAO K L, et al. Analysis the effect and source on water-soluble ions of fine particulate matter (PM2.5) in Urumqi[J]. Ecology and Environmental Sciences,2015,24(12):2002-2008. [23] 马莹萍, 李艳红, 闫晶洁.克拉玛依市NO2和SO2垂直柱浓度特征分析[J]. 中山大学学报(自然科学版),2021,60(5):94-102.MA Y P, LI Y H, YAN J J. The characteristics of NO2 and SO2 in column concentration over Karamay City[J]. Acta Scientiarum Naturalium Universitatis Sunyatseni,2021,60(5):94-102. [24] 刘岩. 乌鲁木齐大气重污染期NO2浓度及扩散轨迹研究[D]. 乌鲁木齐: 新疆师范大学, 2018. [25] 赵晓蓉, 李艳红.天山北坡绿洲城市车流量与对流层NO2垂直柱浓度关系研究[J]. 光谱学与光谱分析,2021,41(2):345-353.ZHAO X R, LI Y H. Study on the relationship between urban traffic flow and tropospheric NO2 vertical column density in oasis on the north slope of Tianshan Mountain[J]. Spectroscopy and Spectral Analysis,2021,41(2):345-353. [26] TIAN X, XIE P H, XU J, et al. Long-term observations of tropospheric NO2, SO2 and HCHO by MAX-DOAS in Yangtze River Delta area, China[J]. Journal of Environmental Sciences,2018,71:207-221. doi: 10.1016/j.jes.2018.03.006 [27] LI L, LU C, CHAN P W, et al. Impact of the COVID-19 on the vertical distributions of major pollutants from a tower in the Pearl River Delta[J]. Atmospheric Environment,2022,276:119068. doi: 10.1016/j.atmosenv.2022.119068 [28] 朱文东, 周廷刚, 李洪忠, 等.基于OMI数据的成渝城市群对流层NO2浓度遥感监测[J]. 长江流域资源与环境,2019,28(9):2239-2250.ZHU W D, ZHOU T G, LI H Z, et al. Remote sensing monitoring of tropospheric NO2 density in Chengdu-Chongqing Urban Agglomeration based on OMI data[J]. Resources and Environment in the Yangtze Basin,2019,28(9):2239-2250. [29] 李艳红, 王莉莉, 赵晓蓉.奎屯市-独山子区-乌苏市区域大气对流层NO2柱浓度时空变化分析[J]. 环境科学研究,2021,34(9):2122-2131.LI Y H, WANG L L, ZHAO X R. Spatial and temporal variation of atmospheric tropospheric NO2 column concentration in Kuitun City, Dushanzi District and Wusu City[J]. Research of Environmental Sciences,2021,34(9):2122-2131. [30] 宁一, 孙洁亚, 薛志钢, 等.受焦化影响的下风向城区臭氧污染特征及潜在源区分析[J]. 环境工程技术学报,2022,12(3):710-717. doi: 10.12153/j.issn.1674-991X.20210301NING Y, SUN J Y, XUE Z G, et al. Analysis of ozone pollution characteristics and potential sources of ozone pollution in downwind urban areas affected by coking[J]. Journal of Environmental Engineering Technology,2022,12(3):710-717. doi: 10.12153/j.issn.1674-991X.20210301 [31] 刘旻霞, 孙瑞弟, 宋佳颖, 等.基于OMI数据的新疆地区臭氧柱浓度研究[J]. 中国环境科学,2021,41(4):1498-1510.LIU M X, SUN R D, SONG J Y, et al. Research on ozone column concentration in Xinjiang based on OMI data[J]. China Environmental Science,2021,41(4):1498-1510. □ -

 下载:
下载:


 点击查看大图
计量
- 文章访问数: 225
- HTML全文浏览量: 121
- PDF下载量: 22
- 被引次数: 0