

Surface water quality and correlation analysis of the Yangtze River Economic Belt during the 13th Five-Year Plan period
-
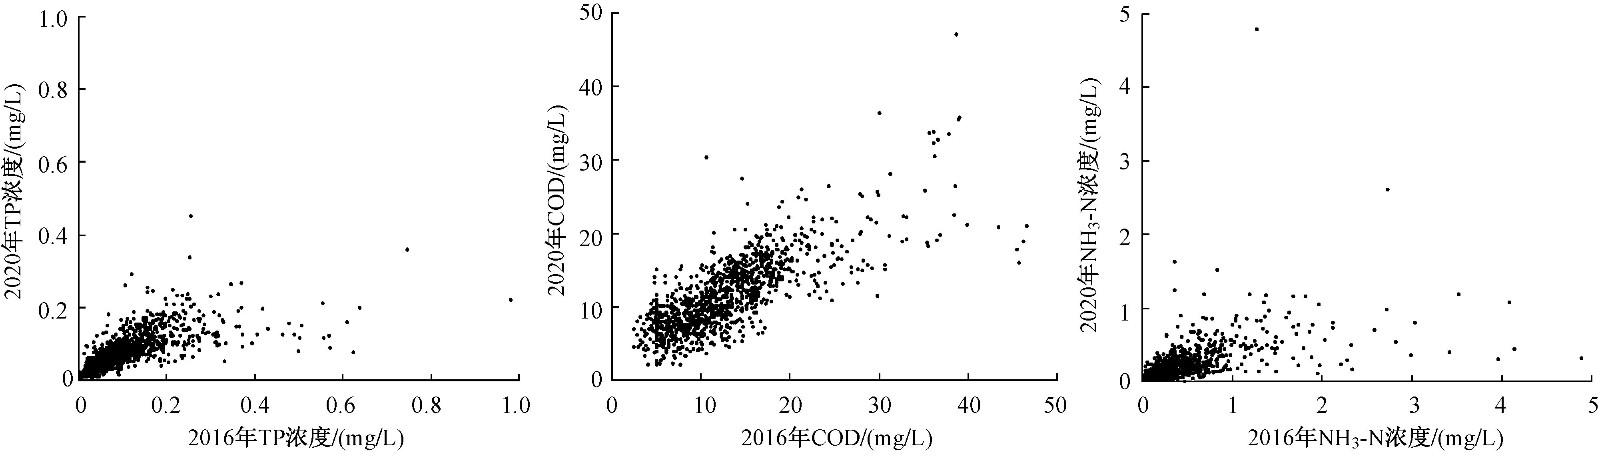
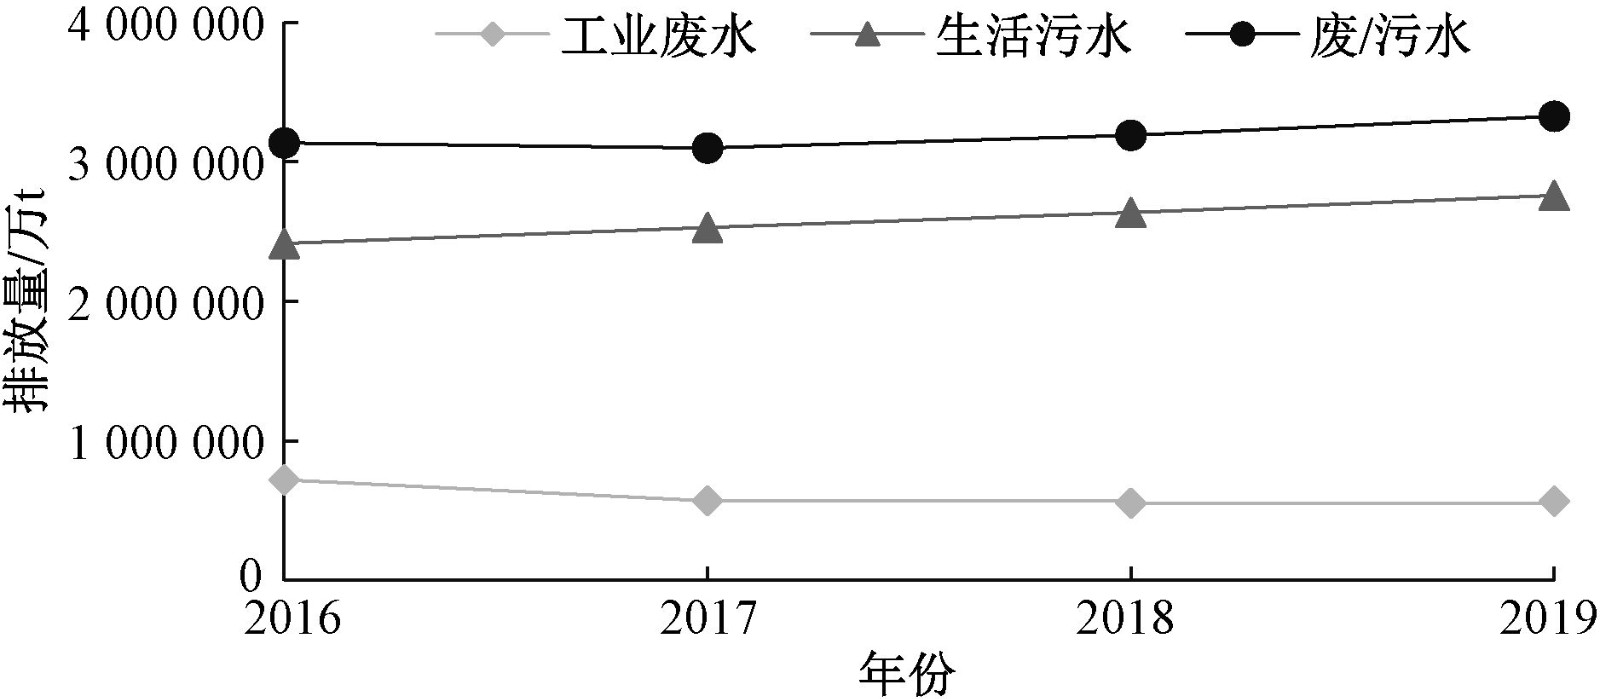
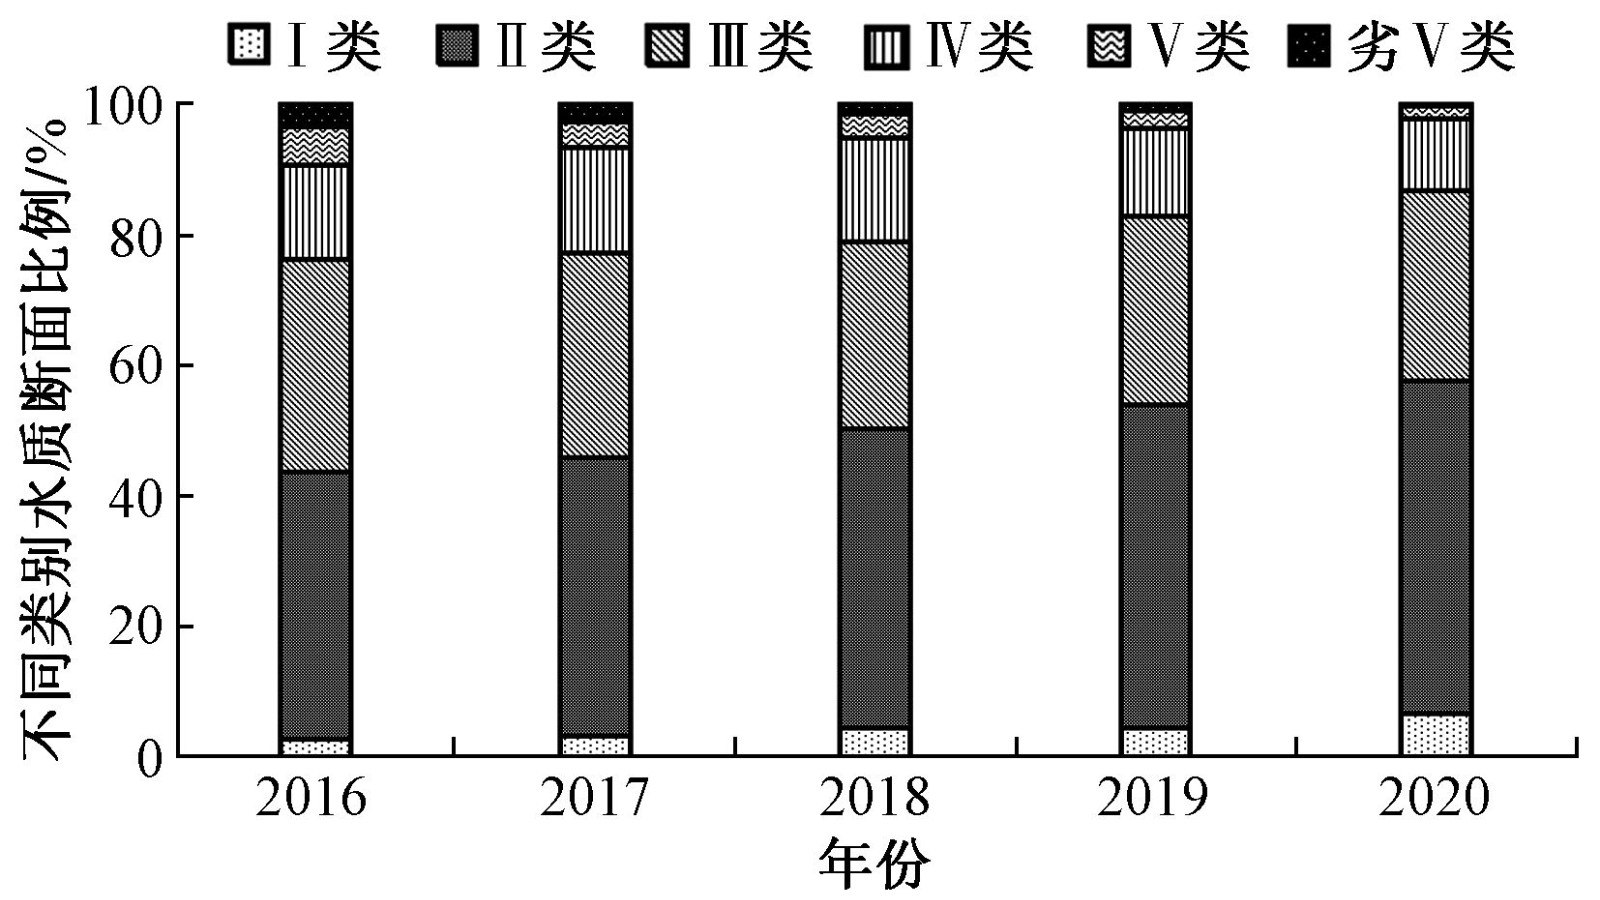
摘要: 基于国家地表水环境质量监测网,收集整理“十三五”时期长江经济带地表水1 178个可比断面监测数据,结合人口、社会经济、污染排放等数据,分析了长江经济带水环境变化和社会经济发展各项指标之间的相关性。结果表明:“十三五”时期,长江经济带地表水水质稳中趋好,GB 3838—2002《地表水环境质量标准》Ⅰ类~Ⅲ类水质断面比例由76.2%升至86.5%,劣Ⅴ类水质断面比例由3.7%降至0.4%。长江经济带地表水水质主要超标指标总磷(TP)浓度、化学需氧量(COD)和氨氮(NH3-N)浓度分别下降32.4%、10.9%和53.3%,但安徽、江苏和上海等下游省(市)TP浓度、COD和NH3-N浓度相对较高,且个别断面其浓度不降反升。导致废/污水排放量变化最大的驱动因素依次为人口数量、第二产业占比和主要污染物排放量。“十三五”时期,国家进一步加大长江经济带水环境治理力度,废/污水治理设施运行费用逐年增加,上升了30.2%,长江经济带水环境治理成效显著,但社会经济发展和污染排放压力依然存在,仍需进一步提质增效,保障长江经济带水环境持续改善。Abstract: Based on the National Surface Water Environmental Quality Monitoring Network, the monitoring data of 1 178 comparable sections in the Yangtze River Economic Belt (YREB) during the 13th Five-Year Plan period were derived and sorted. Combined with the data of population, social economic and pollutant discharges, the correlations between the variation of water quality and various socio-economic development indicators in YREB were analyzed. The results showed that during the 13th Five-Year Plan period, the surface water quality of YREB had improved steadily, and the water quality was good. The water sections meeting Grade Ⅰ-Ⅲ of Environmental Quality Standards for Surface Water (GB 3838-2002) had increased from 76.2% to 86.5%, while the sections that were inferior to Grade V standard had decreased from 3.7% to 0.4%. The concentrations of total phosphorus (TP), chemical oxygen demand (COD) and ammonia nitrogen (NH3-N), which were the main over-standard indexes of surface water quality in YREB, decreased by 32.4%, 10.9% and 53.3%, respectively. The concentrations of TP, COD and NH3-N in the downstream provinces (municipalities) such as Anhui, Jiangsu and Shanghai were relatively high, and the concentrations of TP, COD and NH3-N in some individual sections increased. The biggest driving factors leading to the change of waste/sewage discharge were the population, the proportion of secondary industry, and the discharge of main pollutants. During the 13th Five-Year Plan period, the state further strengthened the water environment treatment of YREB. The operation cost for waste water treatment facilities increased year by year, up by 30.2%. The water environment treatment in YREB achieved remarkable results. However, the pressure from socio-economic development and pollution discharge still existed. To ensure the continuous improvement on the water environment in YREB, further improvements on the quality and efficiency were needed.
-
Key words:
- 13th Five-Year Plan /
- Yangtze River Economic Belt /
- water quality /
- correlation /
- analysis
-

图 1 “十三五”时期长江经济带水质状况变化
Figure 1. Changes of water quality in YREB during the 13th Five-Year Plan period

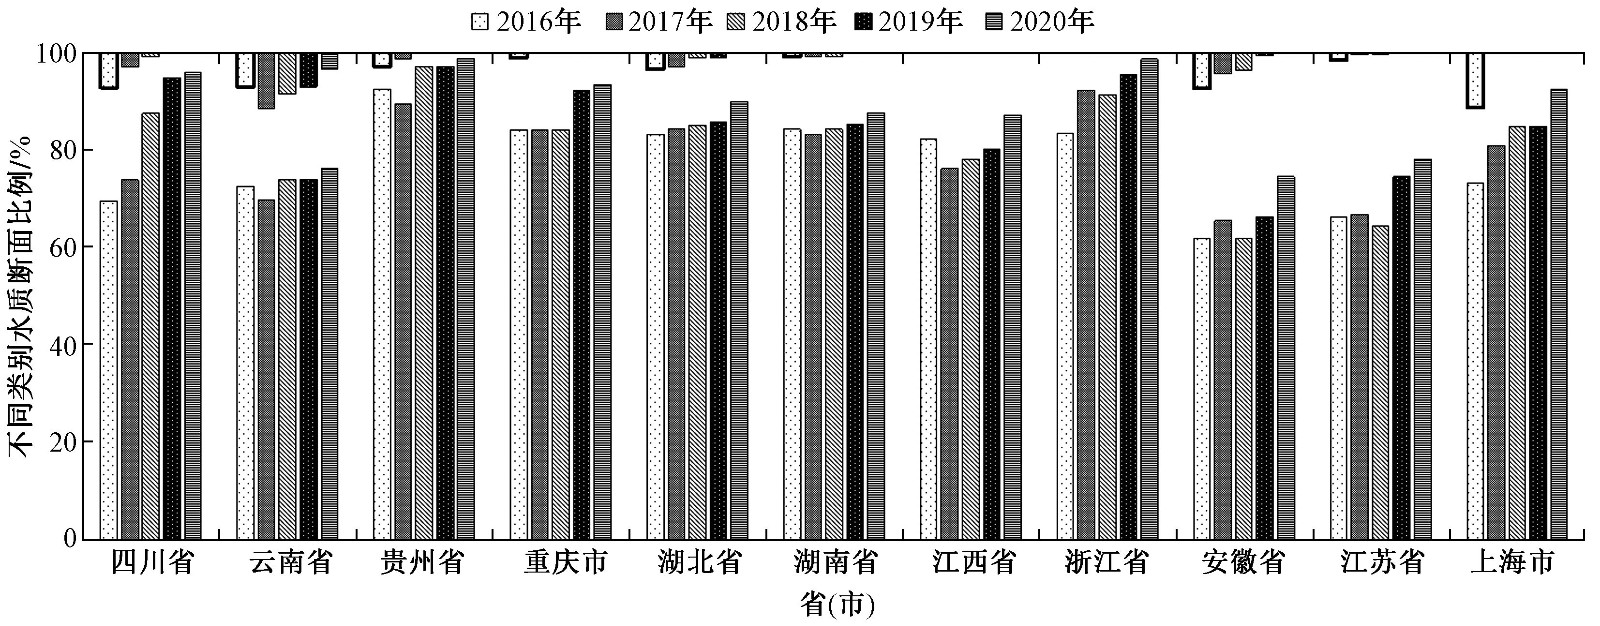
图 2 “十三五”时期11省(市)Ⅰ类~Ⅲ类(下)和劣Ⅴ类(上)水质断面比例变化
Figure 2. Changes in the proportion of grade Ⅰ-Ⅲ (below) and inferior to grade V (up) water quality sections in 11 provinces and cities of YREB during the 13th Five-Year Plan period
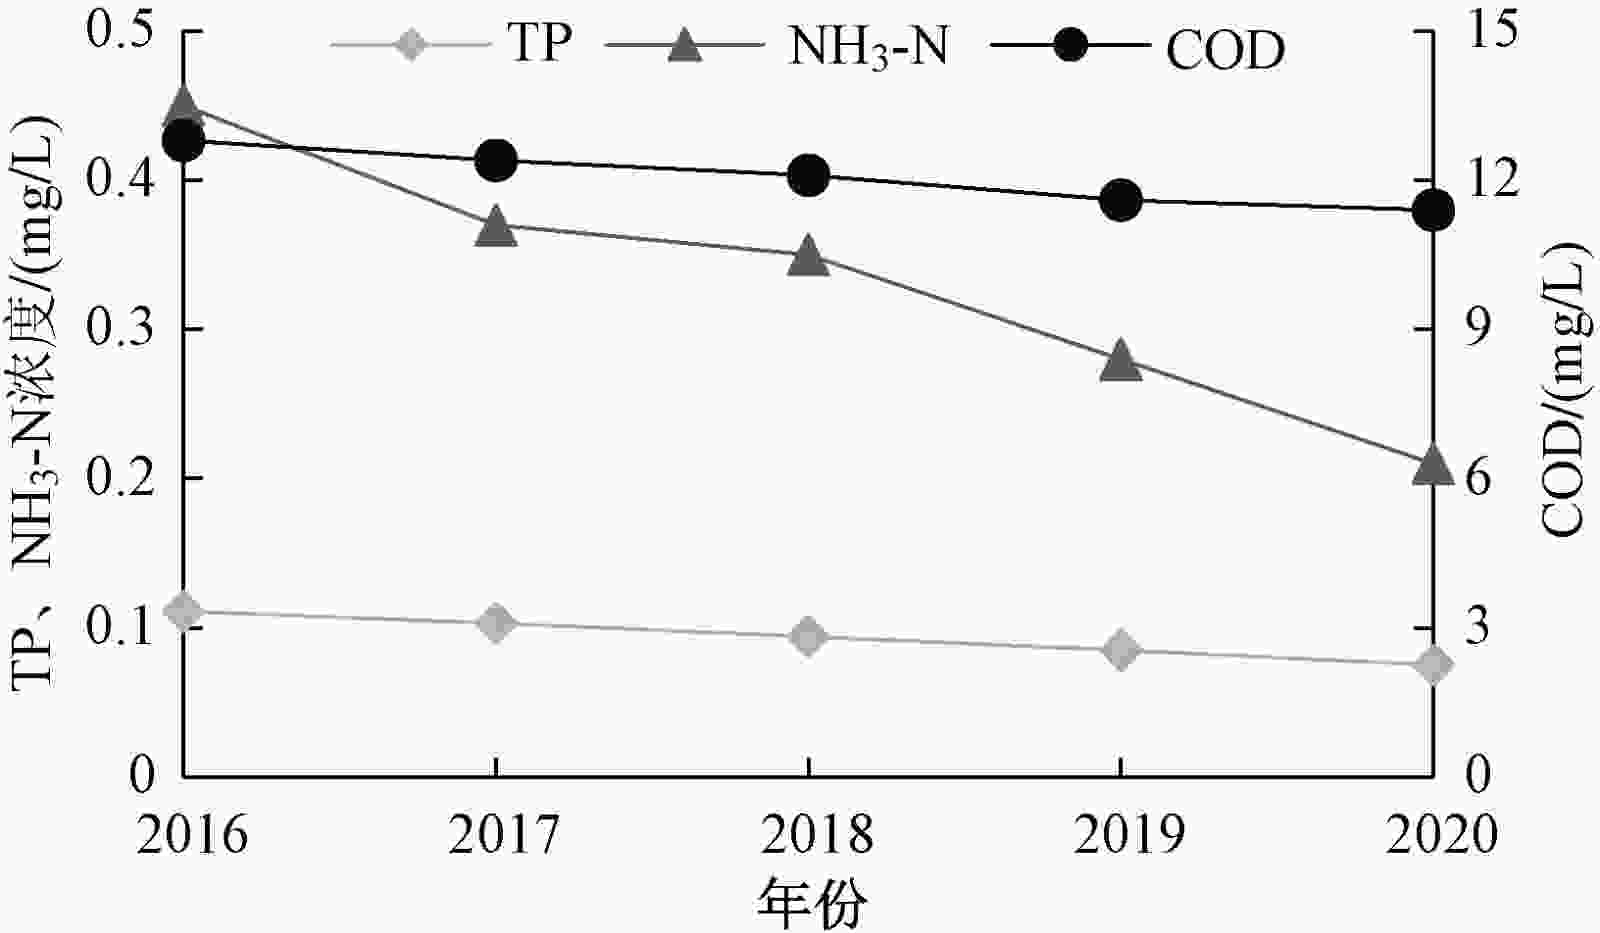
图 3 “十三五”时期长江经济带TP、NH3-N浓度和COD变化
Figure 3. Annual variations of TP, NH3-N and COD in YREB during the 13th Five-Year Plan period

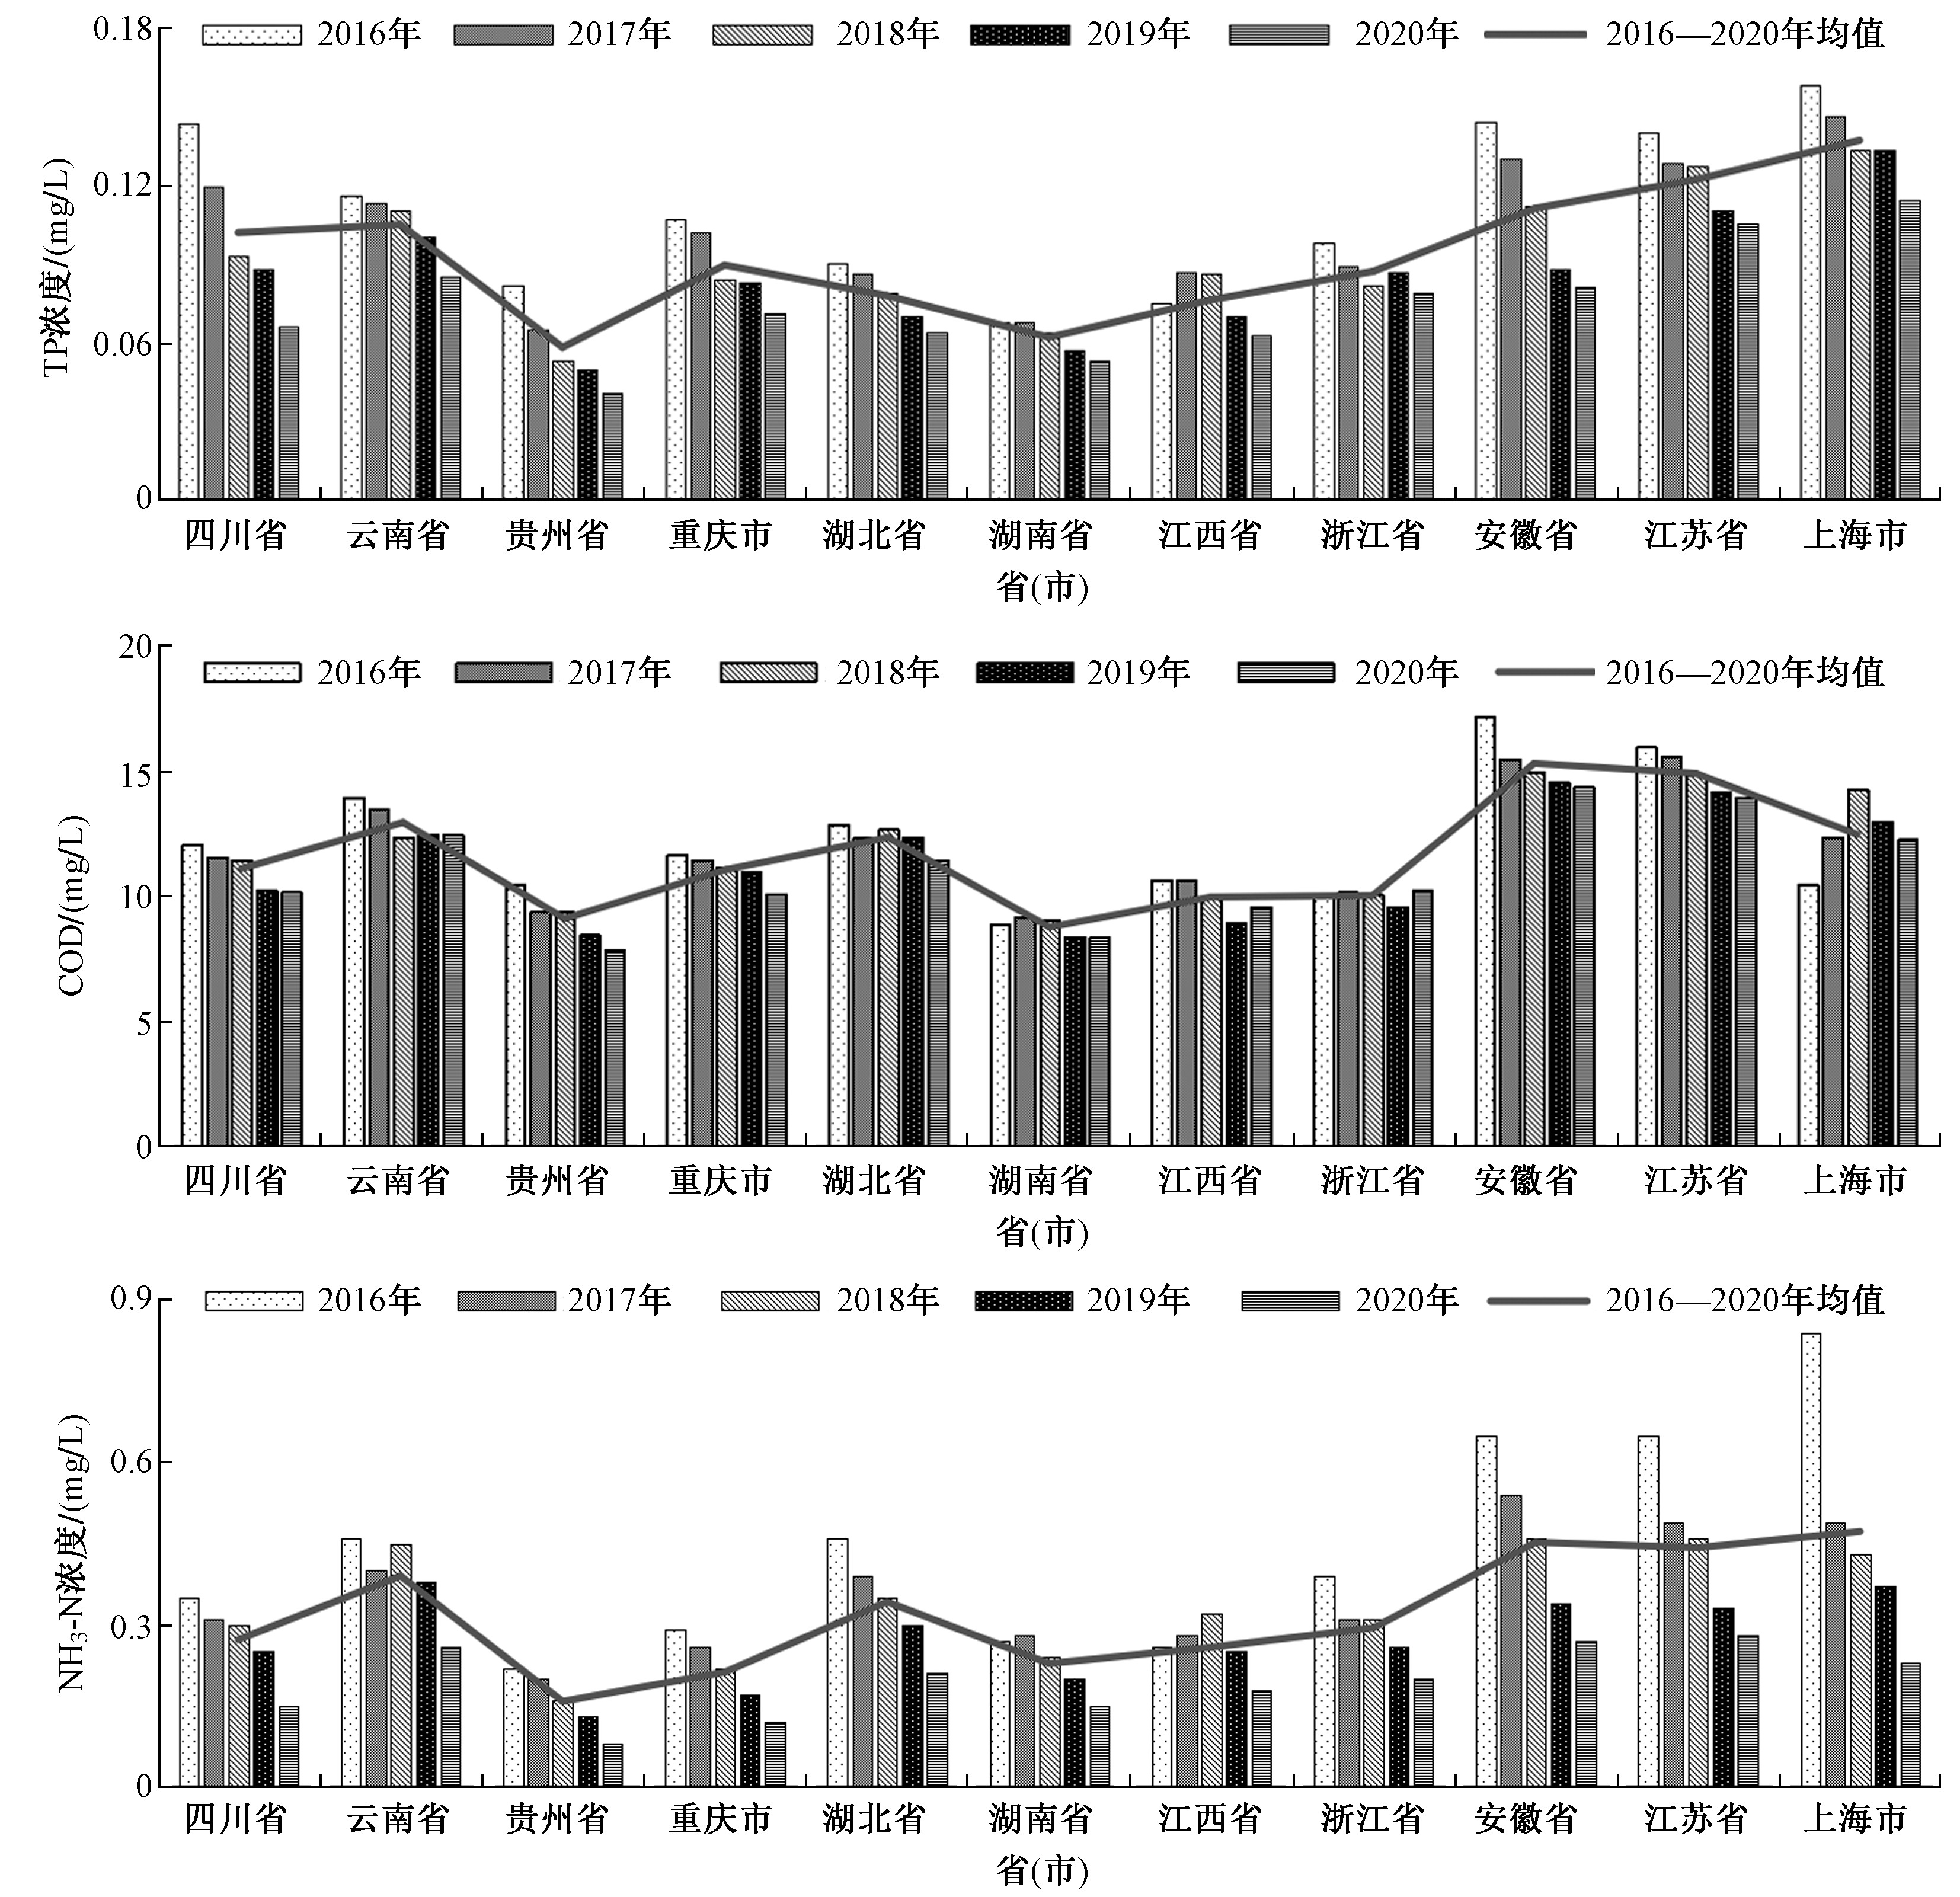
图 4 “十三五”时期11省(市)TP、NH3-N浓度和COD变化
Figure 4. Annual variations of TP, COD and NH3-N in 11 provinces (municipalities) of YREB during the 13th Five-Year Plan period
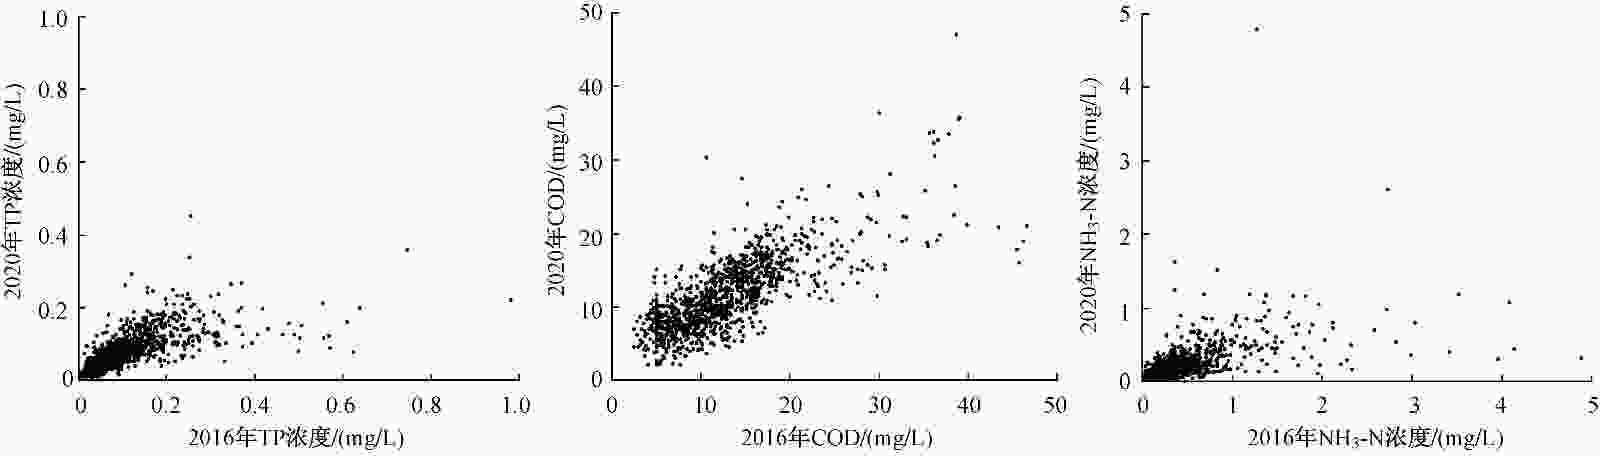
图 5 2020年与2016年相比长江经济带可比断面TP、NH3-N浓度和COD变化
Figure 5. Concentration changes of TP, NH3-N and COD in comparable sections of YREB in 2020 compared with 2016
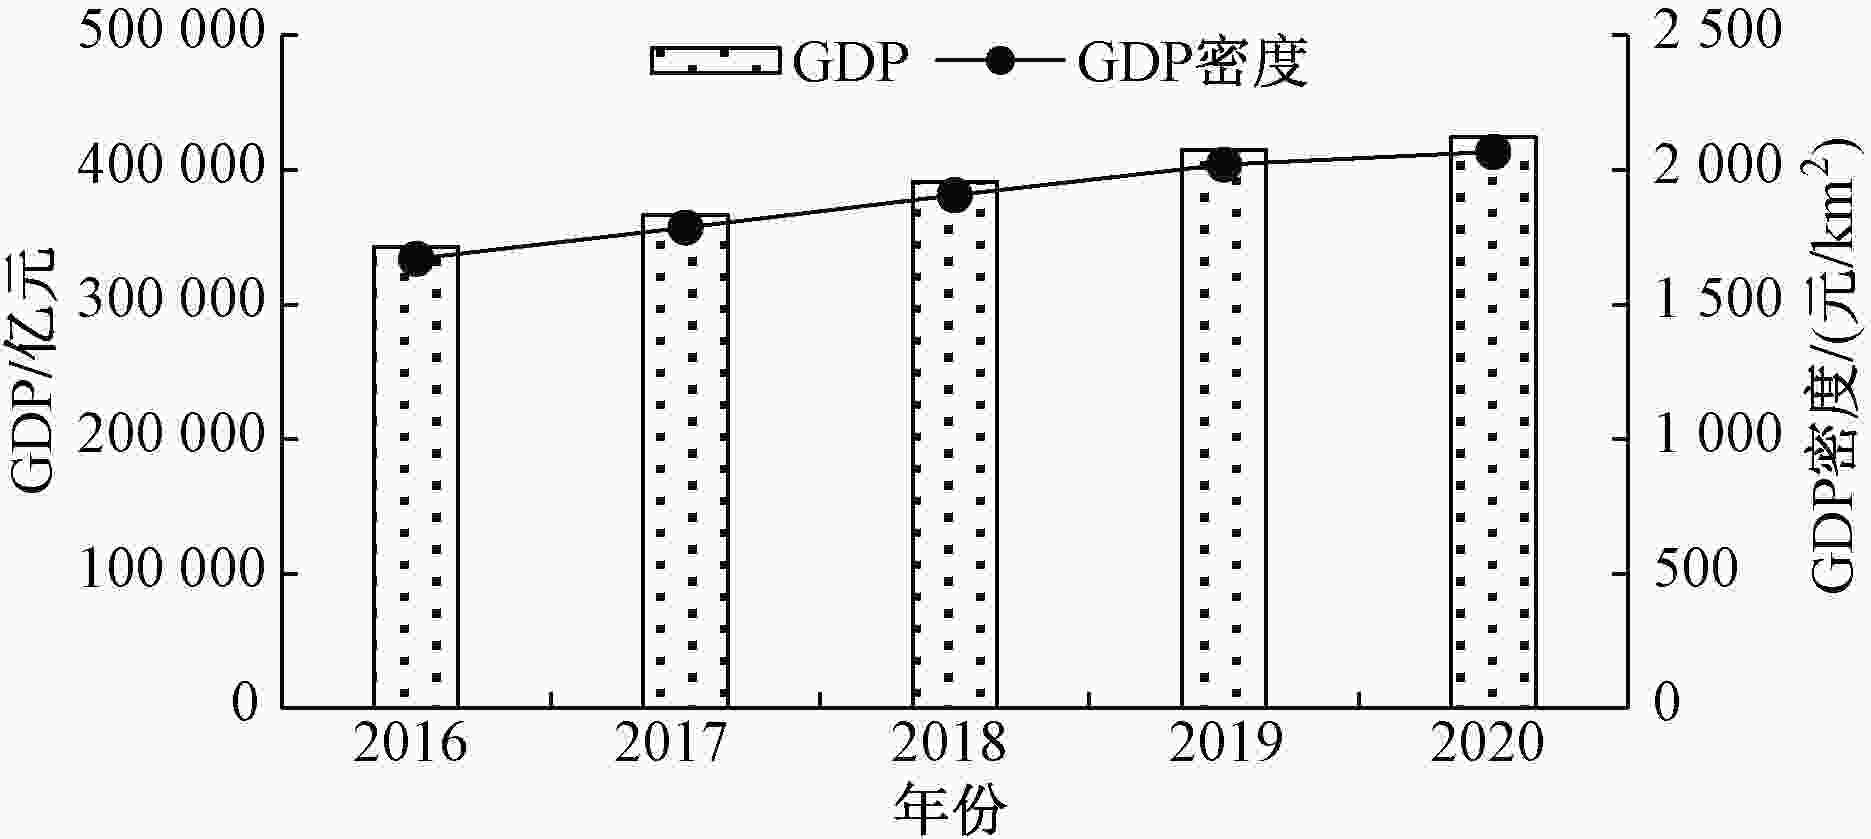
图 6 “十三五”时期长江经济带GDP变化
Figure 6. GDP Change of YREB during the 13th Five-Year Plan period
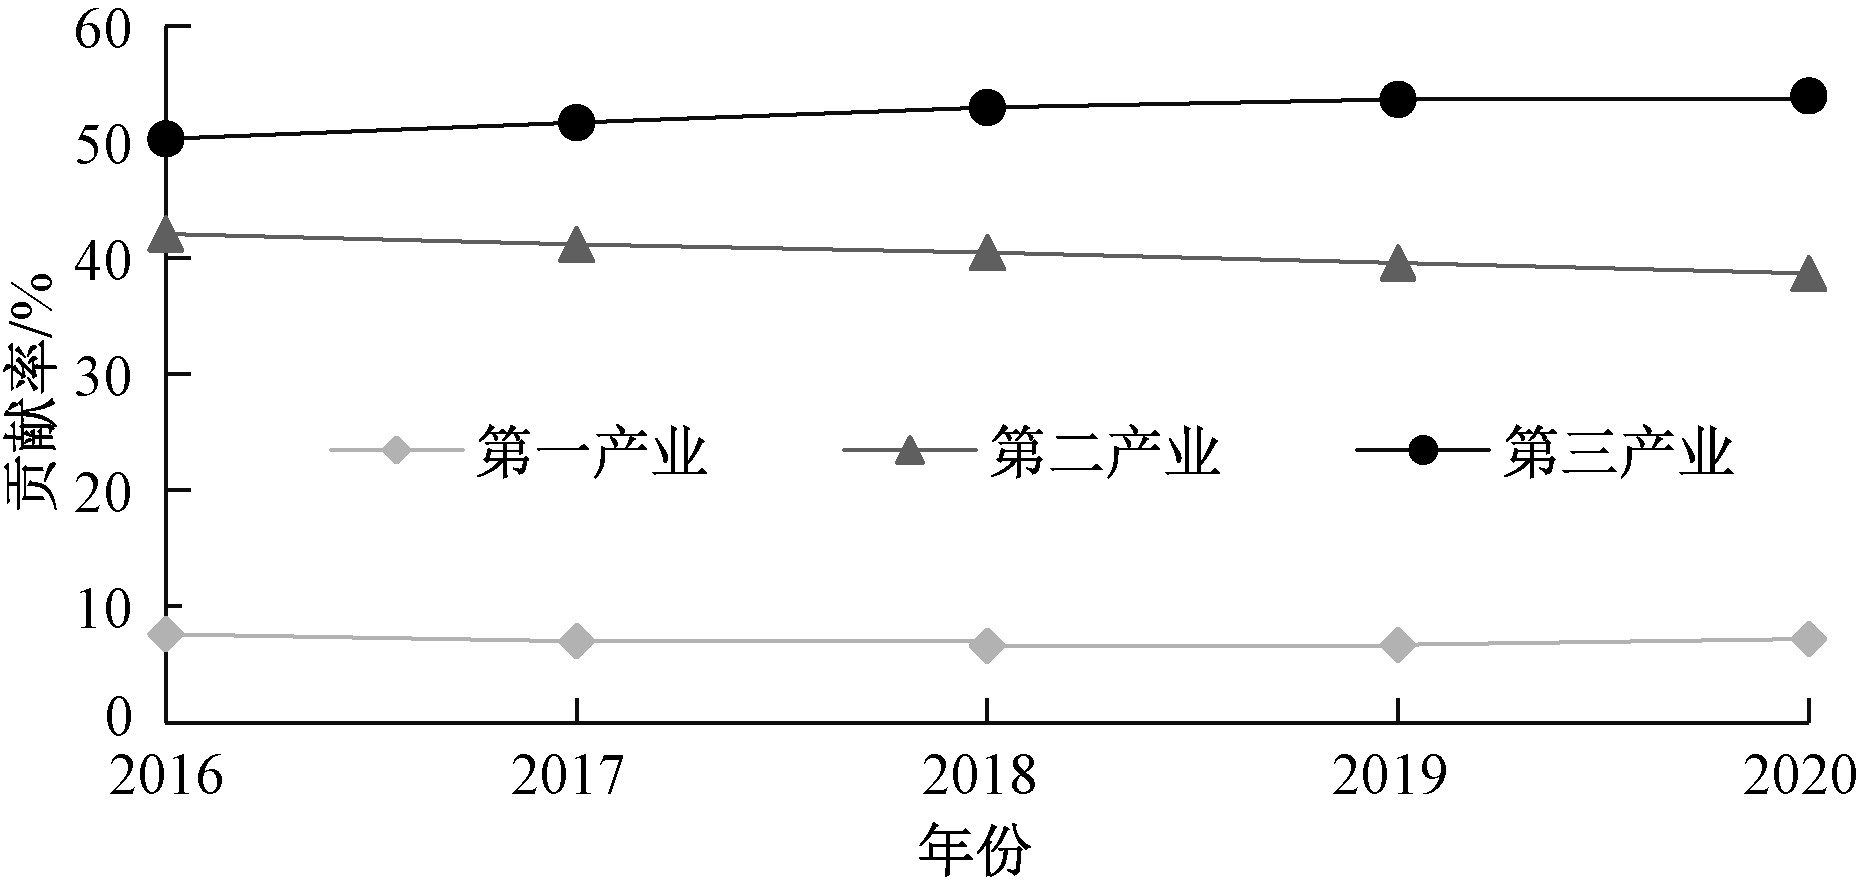
图 7 “十三五”时期长江经济带产业结构变化
Figure 7. Changes in industrial structure of YREB during the 13th Five-Year Plan period
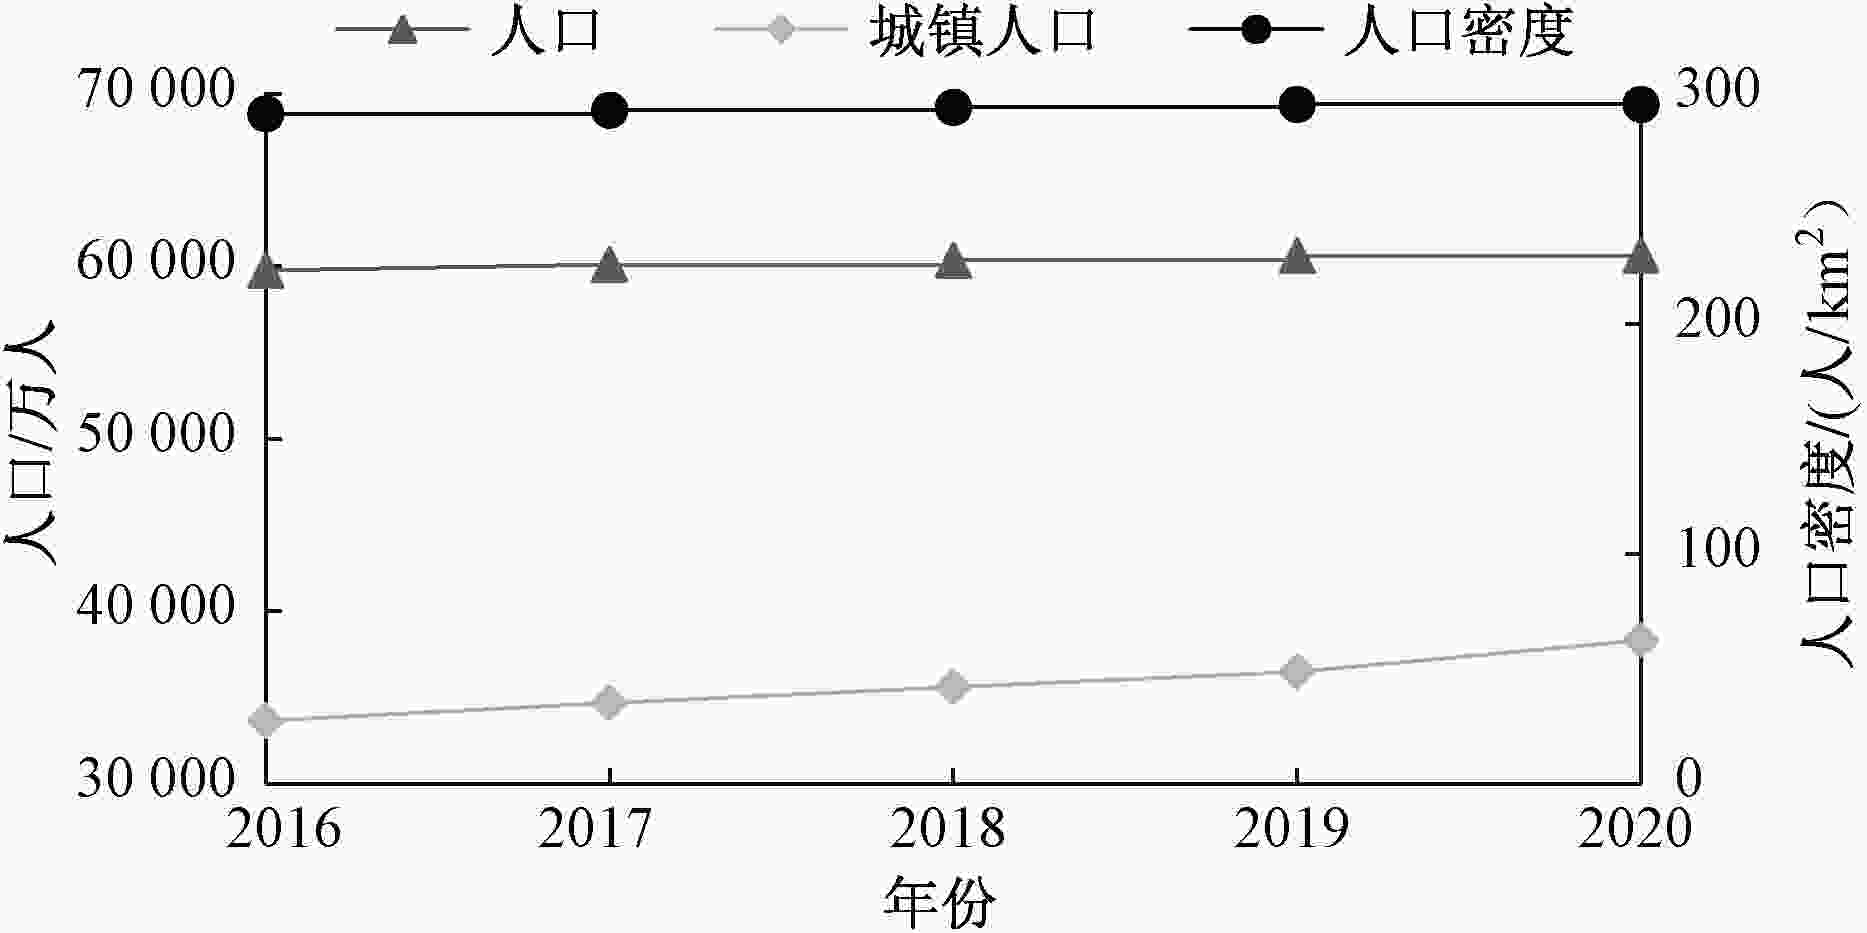
图 8 “十三五”时期长江经济带人口变化
Figure 8. Population changes in YREB during the 13th Five-Year Plan period
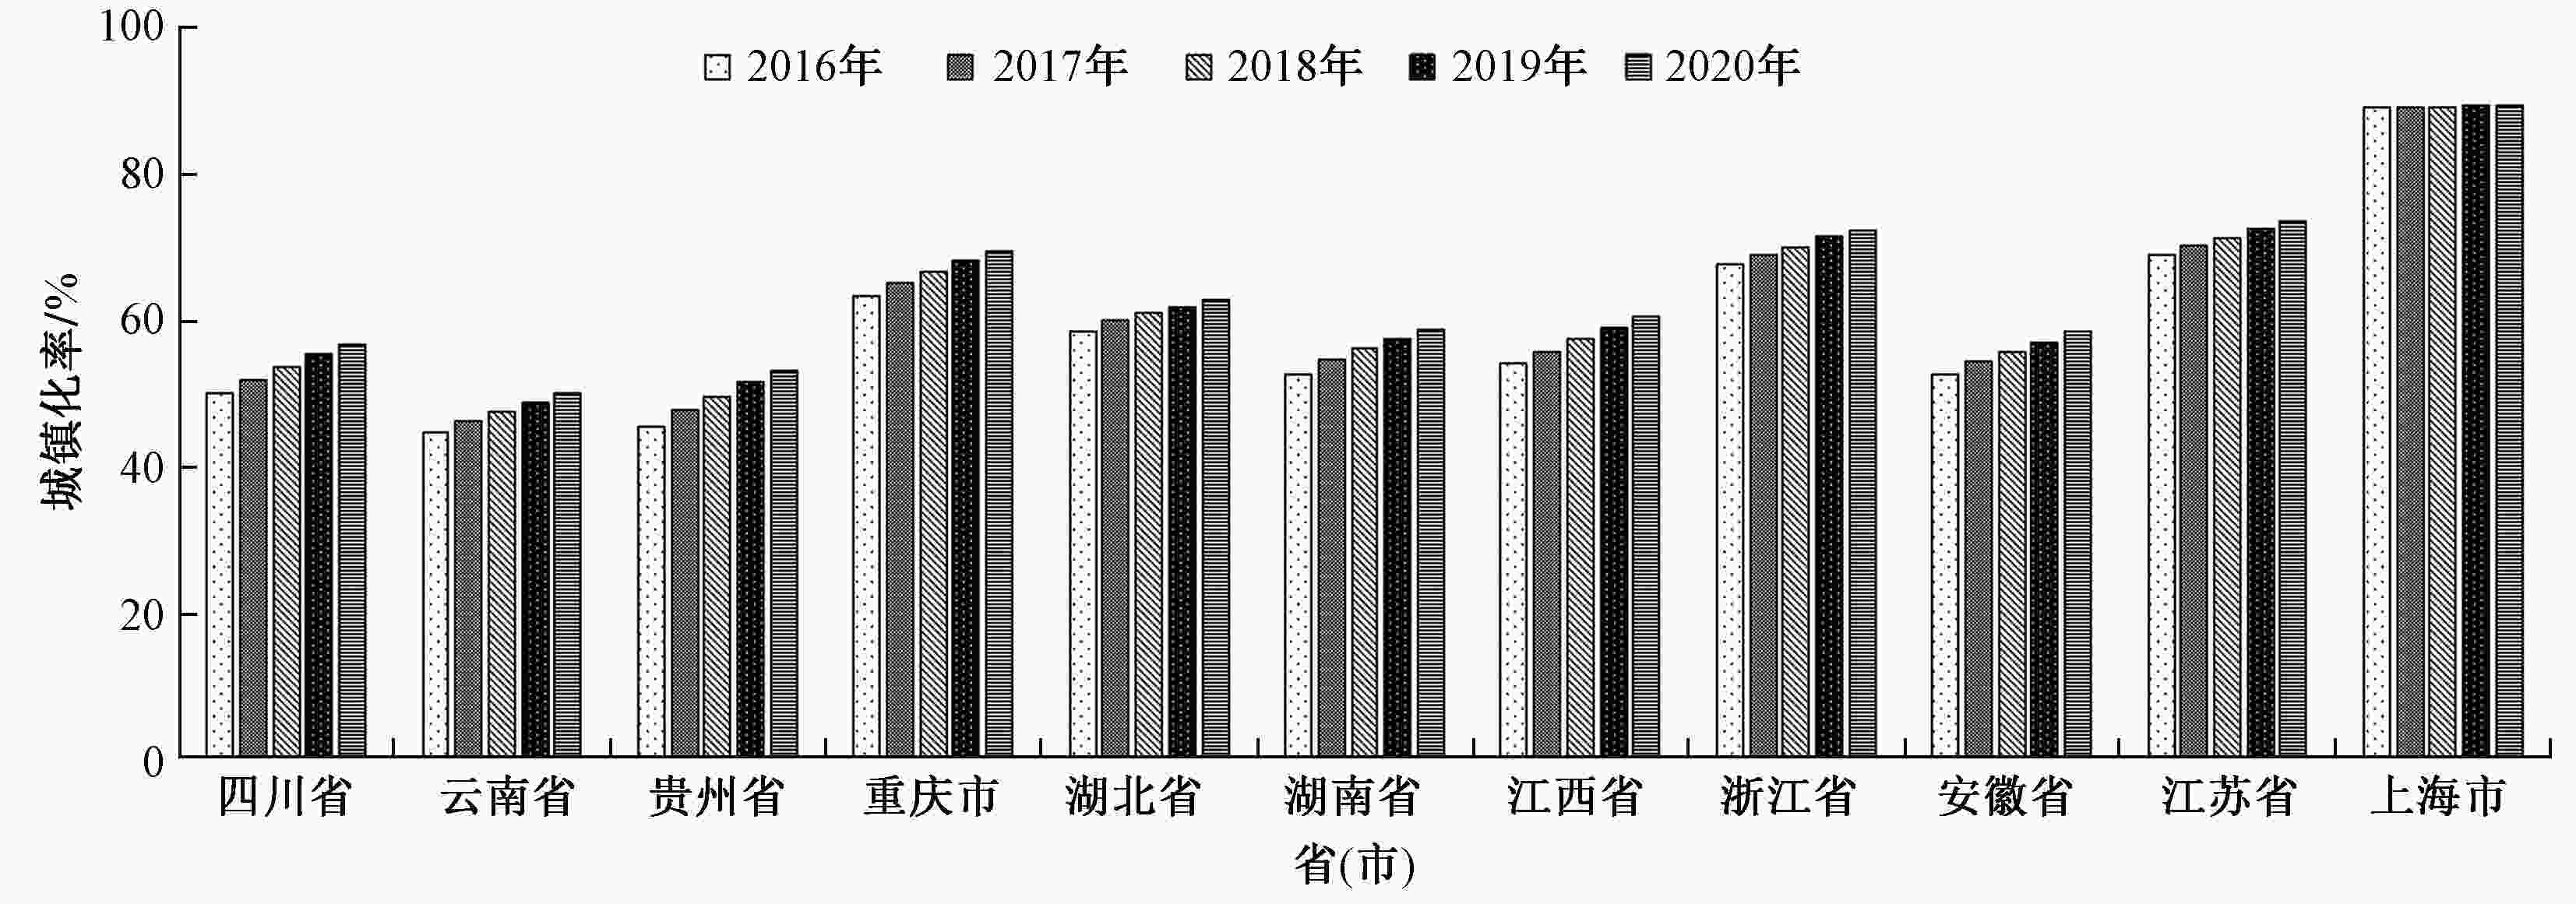
图 9 “十三五”时期11省(市)城镇化率变化
Figure 9. Changes in urbanization rate of 11 provinces (municipalities) in YREB during the 13th Five-Year Plan period

图 10 “十三五”时期长江经济带废/污水排放量
Figure 10. Wastewater discharge in YREB during the 13th Five-Year Plan period
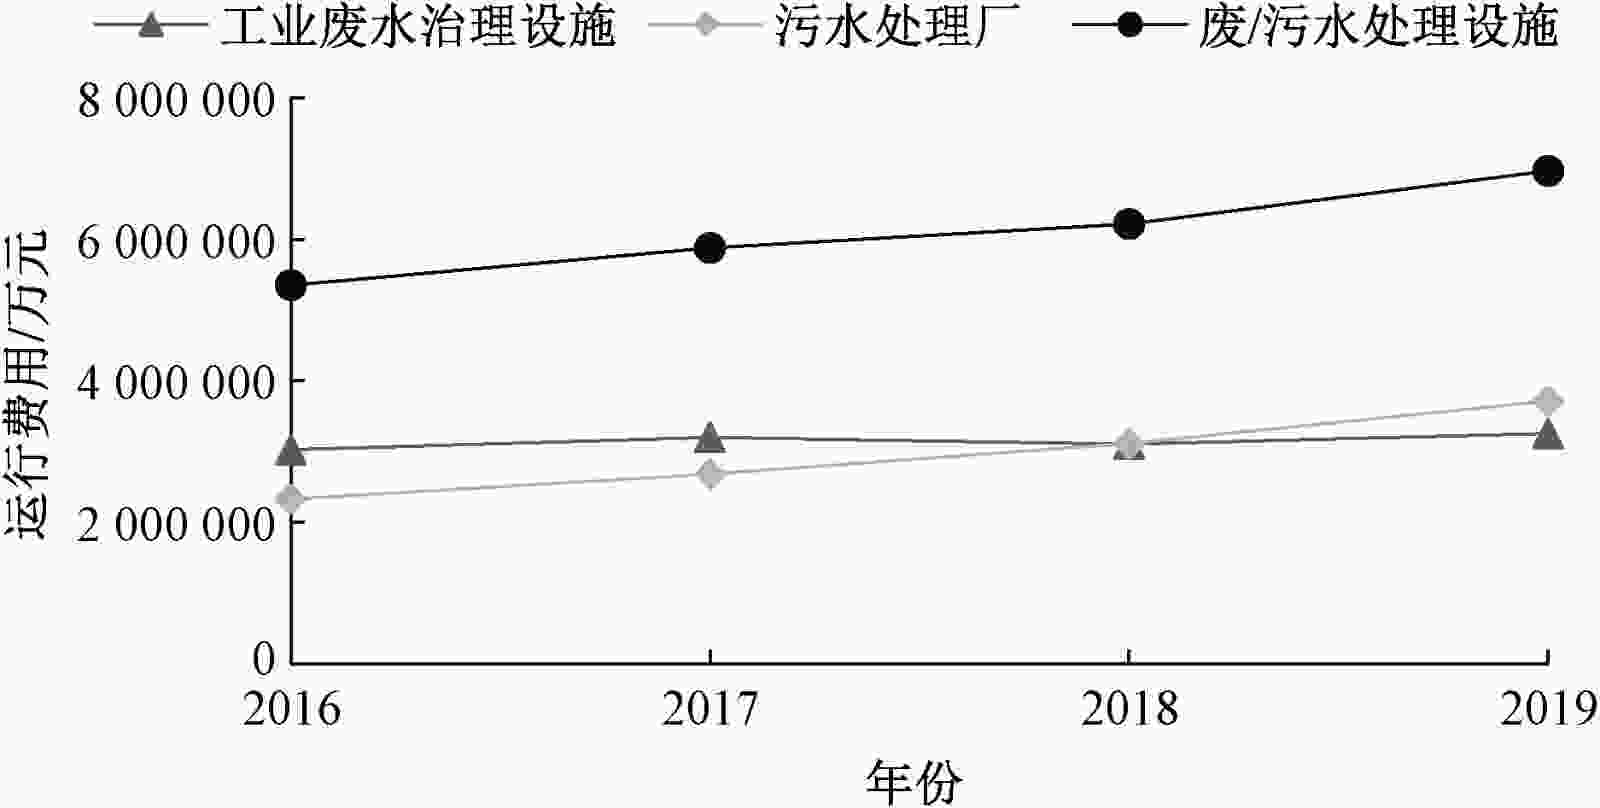
图 11 “十三五”时期长江经济带废/污水治理设施运行费用
Figure 11. Operation cost of wastewater treatment facilities in YREB during the 13th Five-Year Plan period
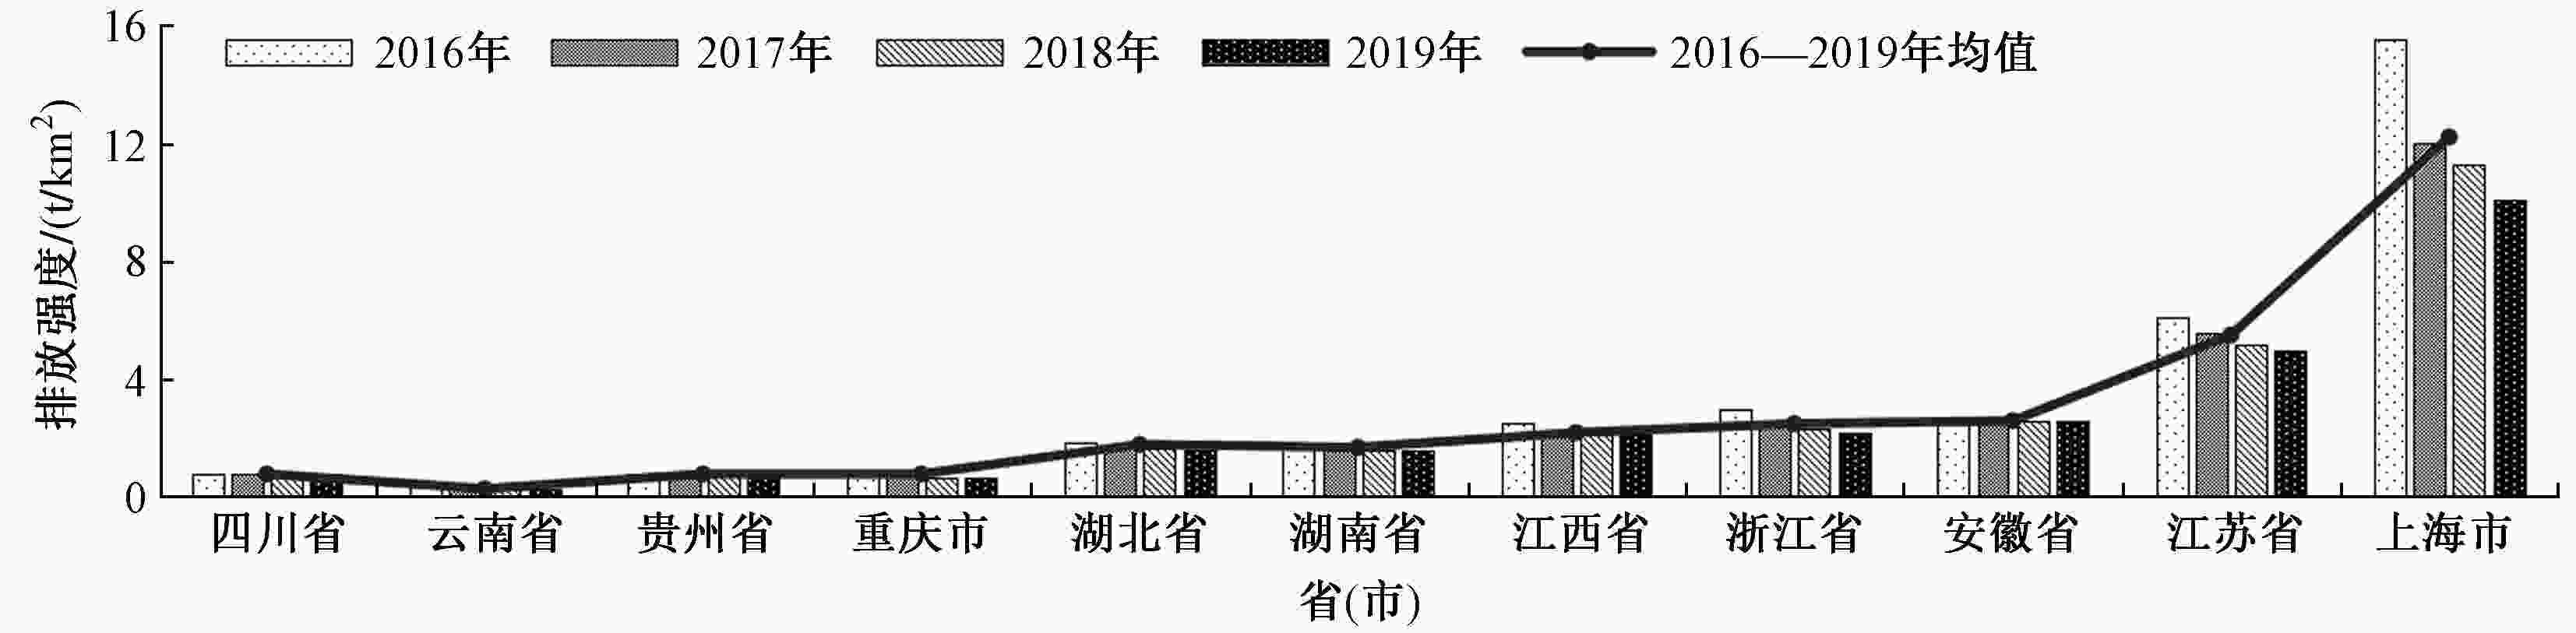
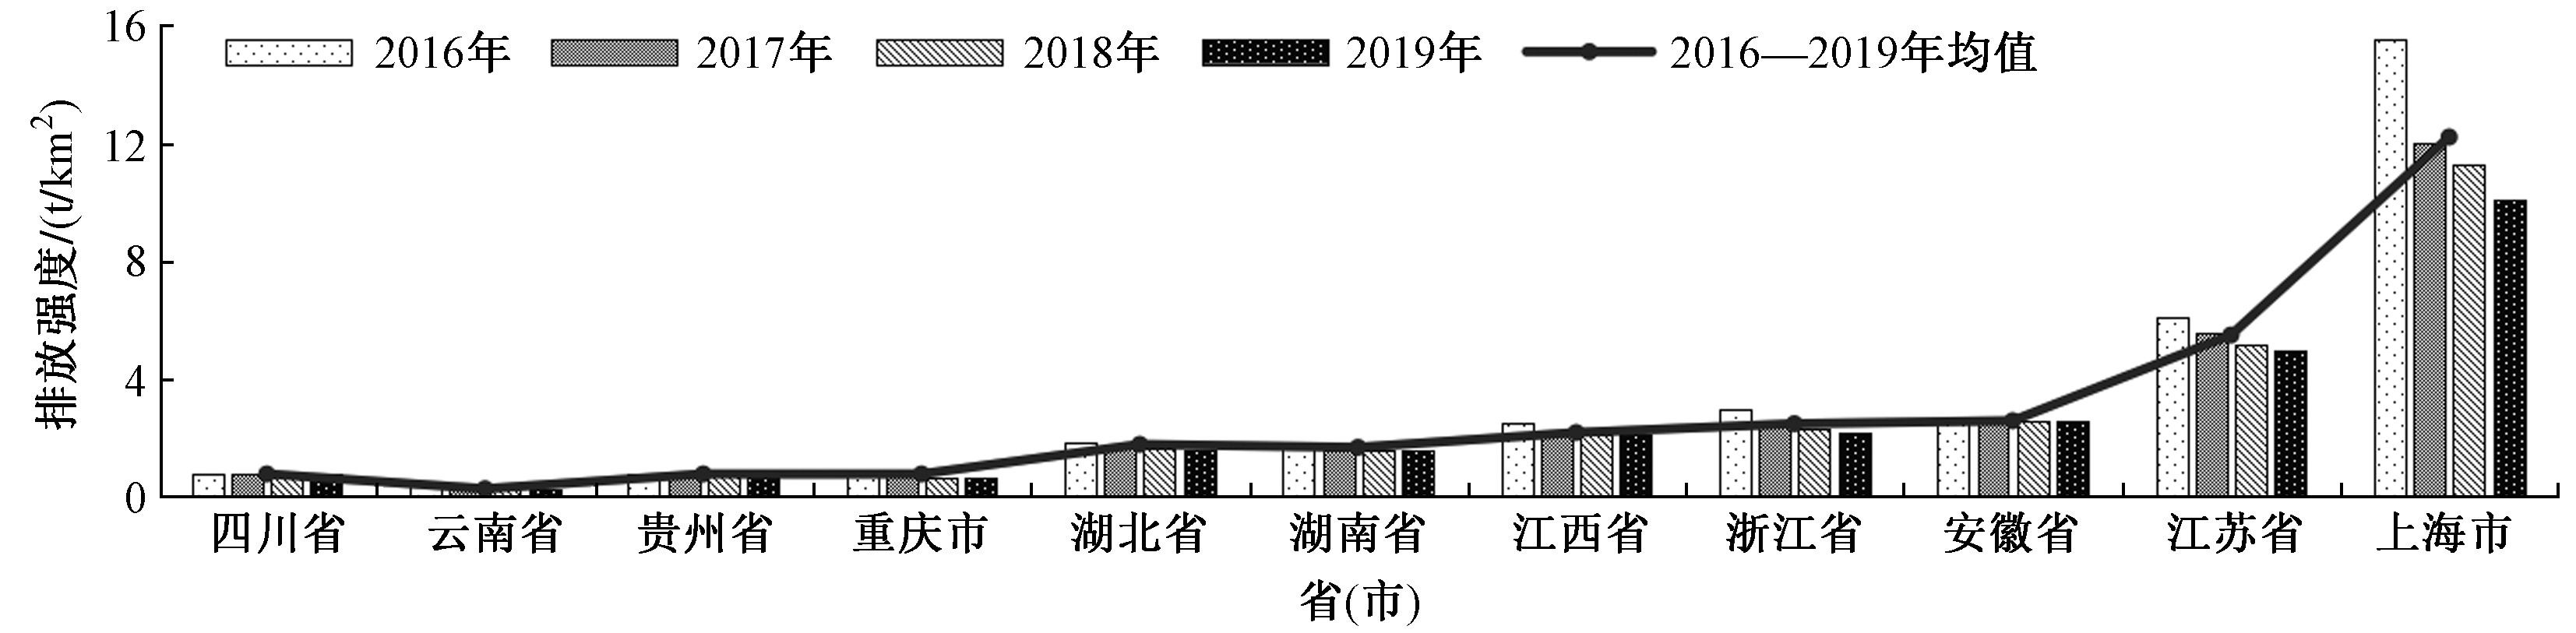
图 12 “十三五”时期11省(市)TP、COD和NH3-N单位面积排放强度
Figure 12. Discharge intensity of TP, COD and NH3-N per unit area in 11 provinces (municipalities) during the 13th Five-Year Plan period

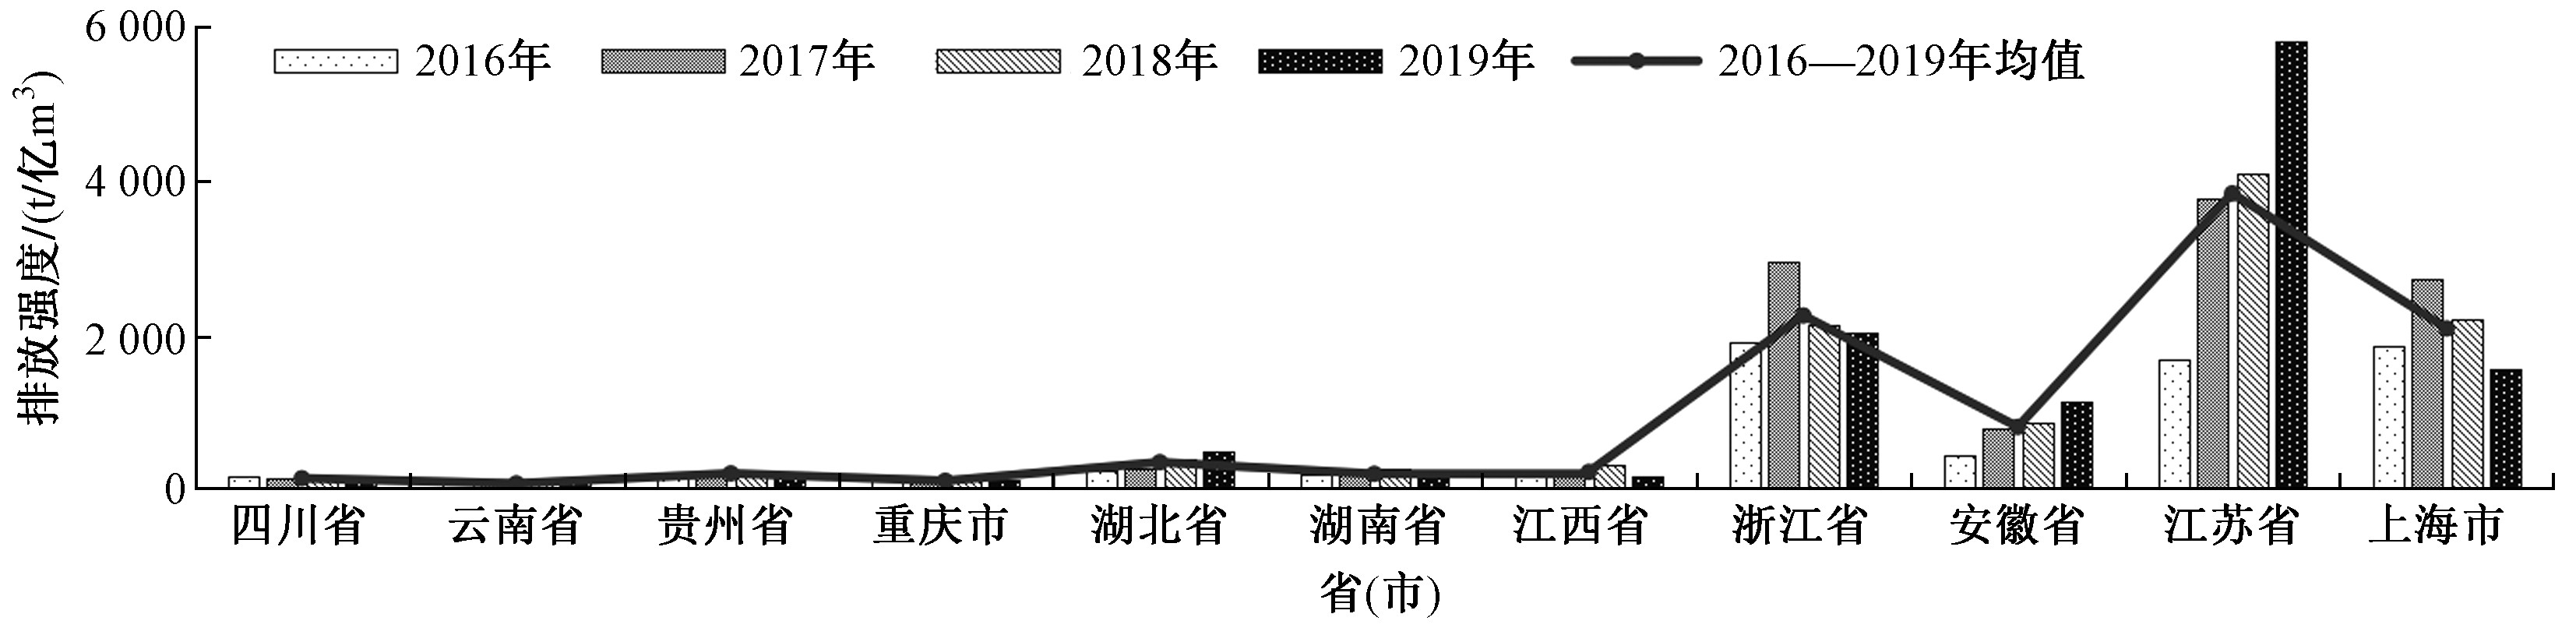
图 13 “十三五”时期11省(市)TP、COD和NH3-N单位水资源量排放强度
Figure 13. Discharge intensity of TP, COD and NH3-N per unit water resource in 11 provinces (municipalities) during the 13th Five-Year Plan period
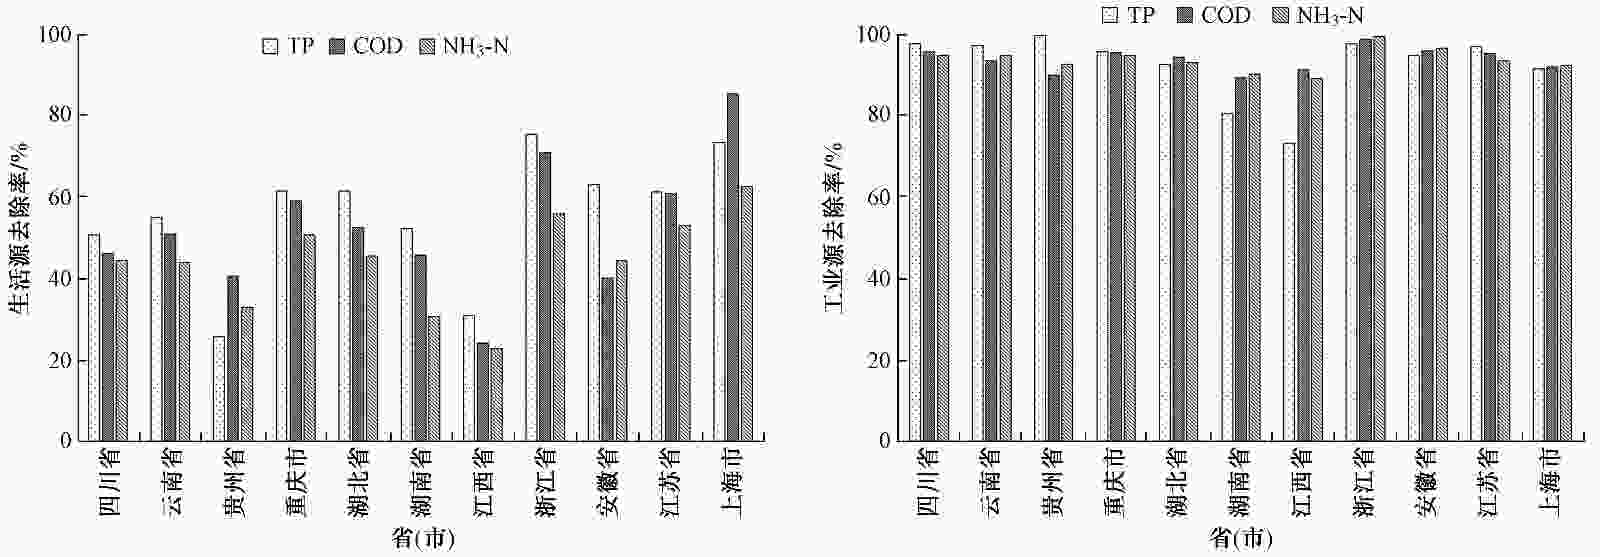
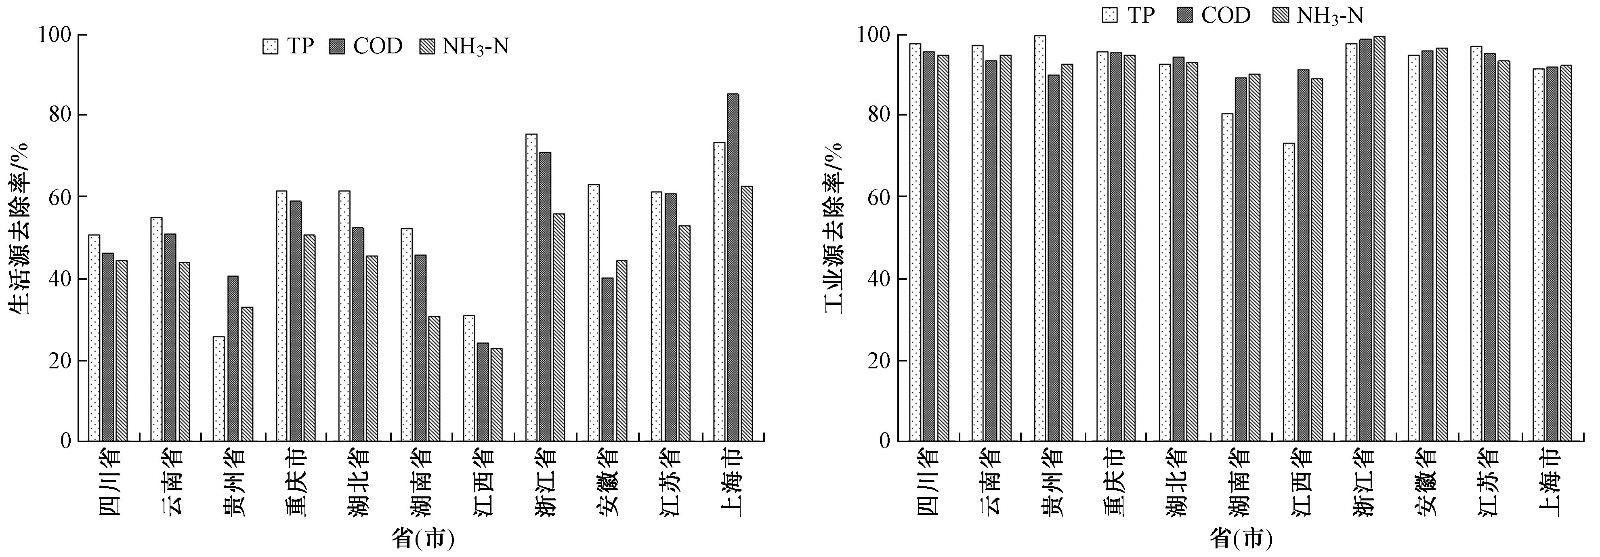
图 14 2019年11省(市)生活源和工业源TP、COD和NH3-N去除率
Figure 14. Removal rates of TP, COD and NH3-N from domestic and industrial sources in 11 provinces (municipalities) in 2019
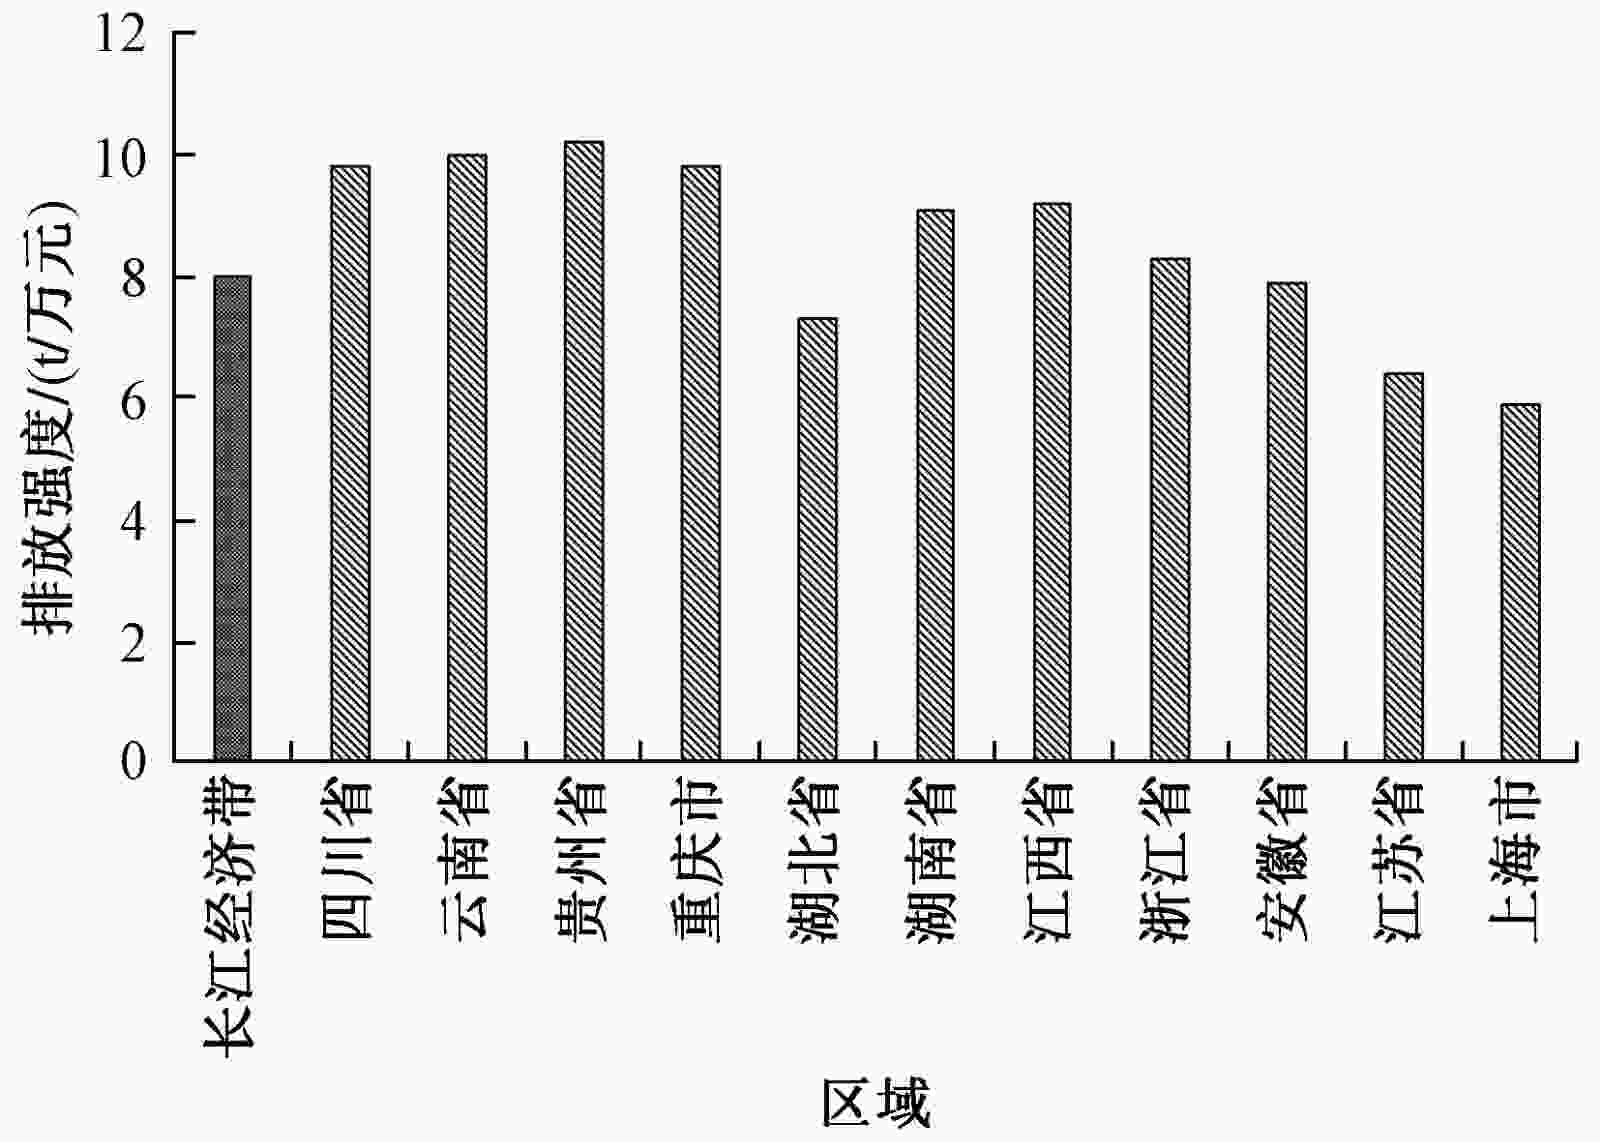
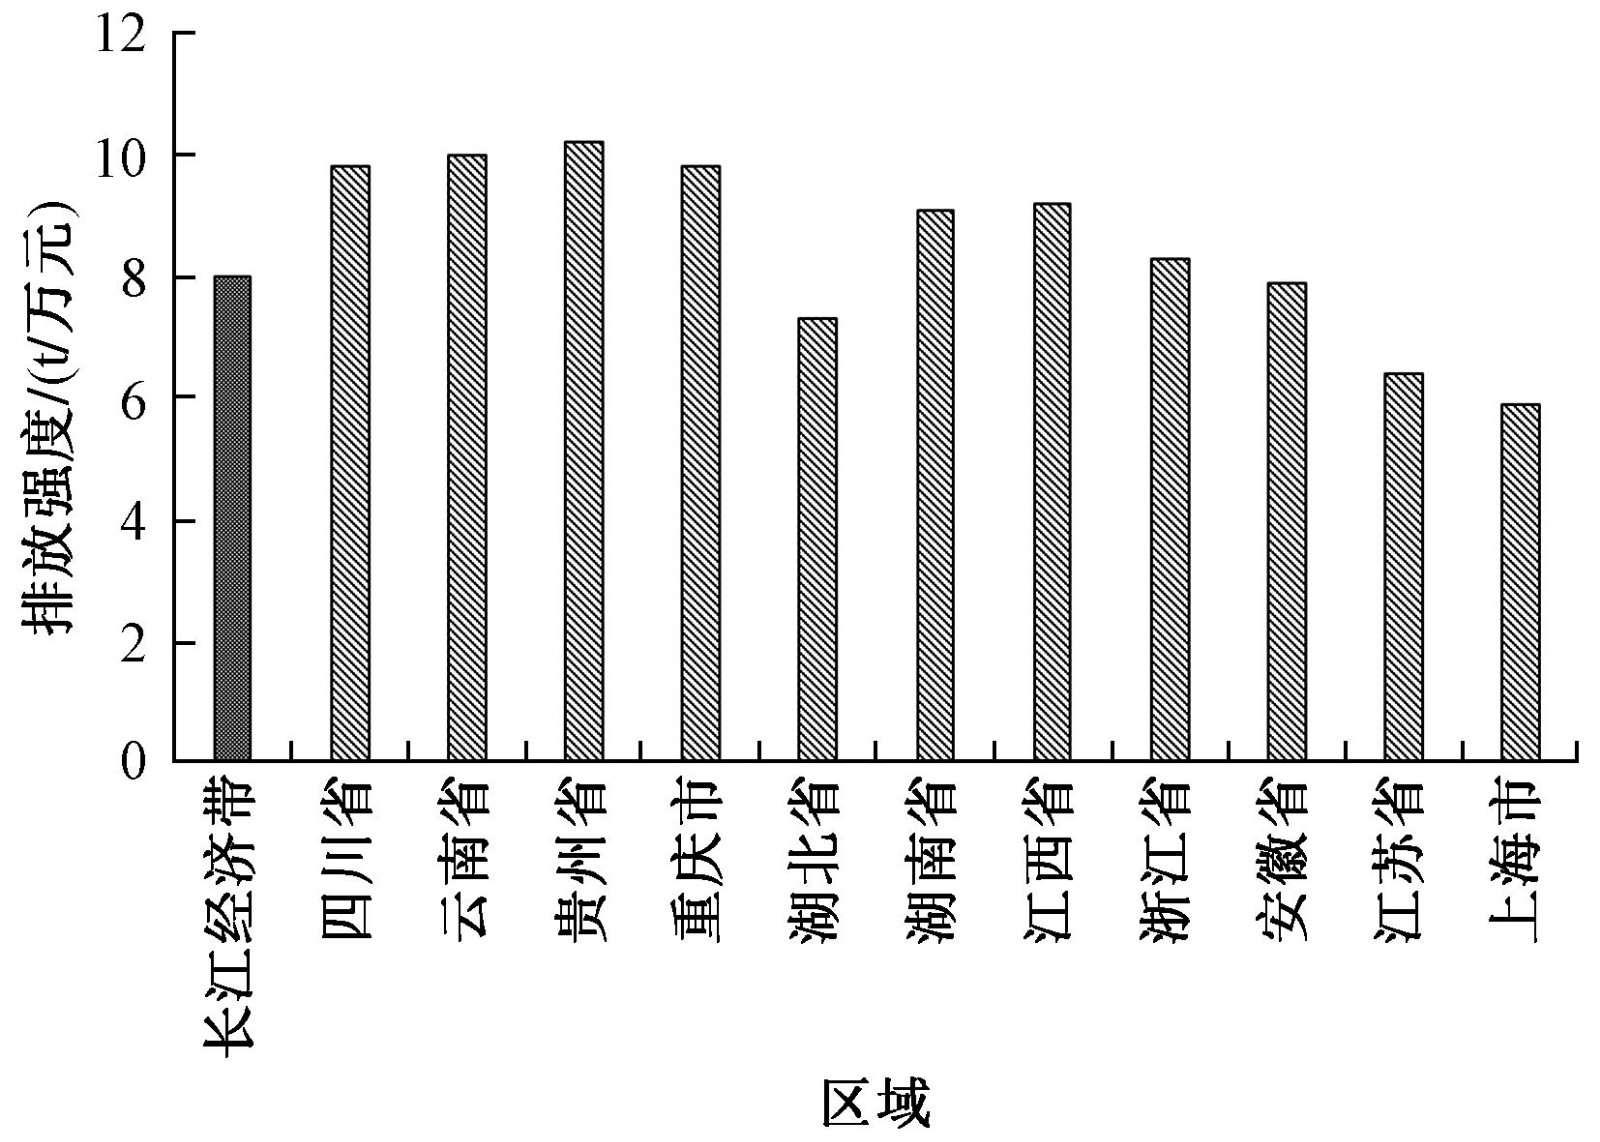
图 15 2019年11省(市)单位GDP废水排放强度
Figure 15. Wastewater discharge intensity per unit GDP of 11 provinces (municipalities) in 2019
表 1 “十三五”时期长江经济带地表水水质与关联指标相关系数
Table 1. Correlation coefficient between surface water quality and related indicators in YREB during the 13th Five-Year Plan period
指标 GDP 人口 TP排放量 COD排放量 NH3-N排放量 治理设施运行费用 TP浓度 −0.998 −0.995 0.942 0.946 0.950 −0.990 COD −0.990 −0.992 0.932 0.913 0.925 −0.999 NH3-N浓度 −0.974 −0.985 0.950 0.853 0.857 −0.987 Ⅰ类~Ⅲ类水质断面比例 0.944 0.938 −0.826 −0.884 −0.925 0.981  下载: 导出CSV
-
[1] 习近平在推动长江经济带发展座谈会上强调 走生态优先绿色发展之路 让中华民族母亲河永葆生机活力[EB/OL]. (2016-01-07)[2021-11-25]. http://www.gov.cn/xinwen/2016-01/07/content_5031289.htm. [2] 习近平. 在深入推动长江经济带发展座谈会上的讲话[EB/OL]. (2018-04-26)[2021-11-25]. http://www.gov.cn/xinwen/2018-06/13/content_5298492.htm. [3] 徐敏, 秦顺兴, 马乐宽, 等.水生态环境保护回顾与展望: 从污染防治到三水统筹[J]. 中国环境管理,2021,13(5):69-78.XU M, QIN S X, MA L K, et al. Review and prospect of water ecology and environment protection: from pollution prevention and control to overall planning about water environment improvement, water resource security and water ecology protection[J]. Chinese Journal of Environmental Management,2021,13(5):69-78. [4] 李海生, 王丽婧, 张泽乾, 等.长江生态环境协同治理的理论思考与实践[J]. 环境工程技术学报,2021,11(3):409-417. doi: 10.12153/j.issn.1674-991X.20210071LI H S, WANG L J, ZHANG Z Q, et al. Theoretical thought and practice of eco-environment synergistic management in the Yangtze River[J]. Journal of Environmental Engineering Technology,2021,11(3):409-417. doi: 10.12153/j.issn.1674-991X.20210071 [5] 张慧, 高吉喜, 乔亚军.长江经济带生态环境形势和问题及建议[J]. 环境与可持续发展,2019,44(5):28-32.ZHANG H, GAO J X, QIAO Y J. Current situation, problems and suggestions on ecology and environment in the Yangtze River Economic Belt[J]. Environment and Sustainable Development,2019,44(5):28-32. [6] 刘录三, 黄国鲜, 王璠, 等.长江流域水生态环境安全主要问题、形势与对策[J]. 环境科学研究,2020,33(5):1081-1090.LIU L S, HUANG G X, WANG F, et al. Main problems, situation and countermeasures of water eco-environment security in the Yangtze River Basin[J]. Research of Environmental Sciences,2020,33(5):1081-1090. [7] TIAN P, WU H Q, YANG T T, et al. Evaluation of urban water ecological civilization: a case study of three urban agglomerations in the Yangtze River Economic Belt, China[J]. Ecological Indicators,2021,123:107351. doi: 10.1016/j.ecolind.2021.107351 [8] 燕波, 孙启宏, 李小敏, 等.差异化标准下长江经济带省际环境绩效比较研究[J]. 环境工程技术学报,2020,10(3):504-511. doi: 10.12153/j.issn.1674-991X.20190198YAN B, SUN Q H, LI X M, et al. Comparative study of environmental performance in Yangtze River Economic Belt under different standards[J]. Journal of Environmental Engineering Technology,2020,10(3):504-511. doi: 10.12153/j.issn.1674-991X.20190198 [9] DENG C N, LI H S, PENG D Z, et al. Modelling the coupling evolution of the water environment and social economic system using PSO-SVM in the Yangtze River Economic Belt, China[J]. Ecological Indicators,2021,129:108012. doi: 10.1016/j.ecolind.2021.108012 [10] CUI X L, SHEN Z, LI Z H, et al. Spatiotemporal evolutions and driving factors of green development performance of cities in the Yangtze River Economic Belt[J]. Ecological Informatics,2021,66:101476. doi: 10.1016/j.ecoinf.2021.101476 [11] 李曼, 敬红, 贾曼, 等.2016—2019年长江经济带总磷污染及治理特征分析[J]. 中国环境监测,2021,37(5):94-102.LI M, JING H, JIA M, et al. Analysis of total phosphorus pollution and treatment characteristics in the Yangtze River Economic Belt during 2016-2019[J]. Environmental Monitoring in China,2021,37(5):94-102. [12] ZHOU K, WU J X, LIU H C. Spatiotemporal variations and determinants of water pollutant discharge in the Yangtze River Economic Belt, China: a spatial econometric analysis[J]. Environmental Pollution,2021,271:116320. doi: 10.1016/j.envpol.2020.116320 [13] LIU D D, BAI L, LI X Y, et al. Spatial characteristics and driving forces of anthropogenic phosphorus emissions in the Yangtze River Economic Belt, China[J]. Resources, Conservation and Recycling,2022,176:105937. doi: 10.1016/j.resconrec.2021.105937 [14] 万炳彤, 赵建昌, 鲍学英, 等.基于SVR的长江经济带水环境承载力评价[J]. 中国环境科学,2020,40(2):896-905. doi: 10.3969/j.issn.1000-6923.2020.02.051WAN B T, ZHAO J C, BAO X Y, et al. Evaluation of water environment bearing capacity of Yangtze River Economic Belt based on SVR Model[J]. China Environmental Science,2020,40(2):896-905. doi: 10.3969/j.issn.1000-6923.2020.02.051 [15] 胡溪, 刘年磊, 蒋洪强, 等.基于环境质量标准的长江经济带水环境承载力评价[J]. 环境保护,2018,46(21):36-40.HU X, LIU N L, JIANG H Q, et al. The water environmental carrying capacity assessment of Yangtze River economic zone based on environmental quality standards[J]. Environmental Protection,2018,46(21):36-40. [16] 杨倩, 胡锋, 赵自阳, 等.长江经济带水资源水环境指标评估及对策[J]. 北京师范大学学报(自然科学版),2019,55(6):731-740.YANG Q, HU F, ZHAO Z Y, et al. Evaluation of water resource and water environment in the Yangtze River Economic Belt and relevant policy strategy[J]. Journal of Beijing Normal University (Natural Science),2019,55(6):731-740. [17] ZHANG Y Y, SUN M Y, YANG R J, et al. Decoupling water environment pressures from economic growth in the Yangtze River Economic Belt, China[J]. Ecological Indicators,2021,122:107314. doi: 10.1016/j.ecolind.2020.107314 [18] 陈善荣, 何立环, 林兰钰, 等.近40年来长江干流水质变化研究[J]. 环境科学研究,2020,33(5):1119-1128.CHEN S R, HE L H, LIN L Y, et al. Change trends of surface water quality in the mainstream of the Yangtze River during the past four decades[J]. Research of Environmental Sciences,2020,33(5):1119-1128. [19] 陈善荣, 何立环, 张凤英, 等.2016—2019年长江流域水质时空分布特征[J]. 环境科学研究,2020,33(5):1100-1108.CHEN S R, HE L H, ZHANG F Y, et al. Spatiotemporal characteristics of surface water quality of the Yangtze River Basin during 2016-2019[J]. Research of Environmental Sciences,2020,33(5):1100-1108. [20] GRIFFITHS J A, CHAN F K S, ZHU F F, et al. Reach-scale variation surface water quality in a reticular canal system in the Lower Yangtze River Delta region, China[J]. Journal of Environmental Management,2017,196:80-90. [21] 生态环境部. 中国生态环境统计年报(2006—2019年)[M]. 北京: 中国环境出版集团. [22] 国家统计局. 中国统计年鉴(2006—2019)[EB/OL]. [2021-11-25]. http://www.stats.gov.cn/. [23] 中央人民政府网. 中华人民共和国行政区划. [EB/OL]. (2005-06-15)[2021-11-25]. http://www.gov.cn/guoqing/2005-09/13/content_5043917.htm. [24] 长江水利网. 长江流域重要控制断面水资源监测通报[EB/OL]. [2021-11-25]. http://www.cjw.gov.cn/zwzc/bmgb/. [25] 环境保护部. 关于印发《“十三五”国家地表水环境质量监测网设置方案》的通知[EB/OL]. (2016-03-16)[2021-11-25]. https://www.mee.gov.cn/gkml/hbb/bwj/201603/t20160322_334062.htm. [26] 欧阳志宏, 郭怀成, 王婉晶, 等.1982—2012年滇池水质变化及社会经济发展对水质的影响[J]. 中国环境监测,2015,31(2):68-73. doi: 10.3969/j.issn.1002-6002.2015.02.014OUYANG Z H, GUO H C, WANG W J, et al. Analysis of water quality change and impacts from socio-economic development in Lake Dianchi from 1982 to 2012[J]. Environmental Monitoring in China,2015,31(2):68-73. doi: 10.3969/j.issn.1002-6002.2015.02.014 [27] 张勇, 王云, 叶文虎.上海市地表水水质近20年的变化[J]. 环境科学学报,2002,22(2):247-251. doi: 10.3321/j.issn:0253-2468.2002.02.023ZHANG Y, WANG Y, YE W H. Surface water quality changes in Shanghai City in past 20 years[J]. Acta Scientiae Circumstantiae,2002,22(2):247-251. doi: 10.3321/j.issn:0253-2468.2002.02.023 [28] 李名升, 张建辉, 罗海江, 等.“十一五”期间中国化学需氧量减排与水环境质量变化关联分析[J]. 生态环境学报,2011,20(3):463-467. doi: 10.3969/j.issn.1674-5906.2011.03.013LI M S, ZHANG J H, LUO H J, et al. Relation between water quality and COD discharge in China in the Eleventh Five-Year Plan[J]. Ecology and Environmental Sciences,2011,20(3):463-467. doi: 10.3969/j.issn.1674-5906.2011.03.013 [29] 李名升, 孙媛, 陈远航, 等.污染排放与环境质量关系模型构建与应用[J]. 环境科学,2014,35(3):1198-1204.LI M S, SUN Y, CHEN Y H, et al. Establishment and application of pollutant discharge-environment quality model[J]. Environmental Science,2014,35(3):1198-1204. □ -

 下载:
下载:


 点击查看大图
计量
- 文章访问数: 288
- HTML全文浏览量: 217
- PDF下载量: 53
- 被引次数: 0