

Nitrogen flow pattern and influencing factors of food production and consumption system in the Yangtze River Delta city cluster based on material flow model
-
摘要:
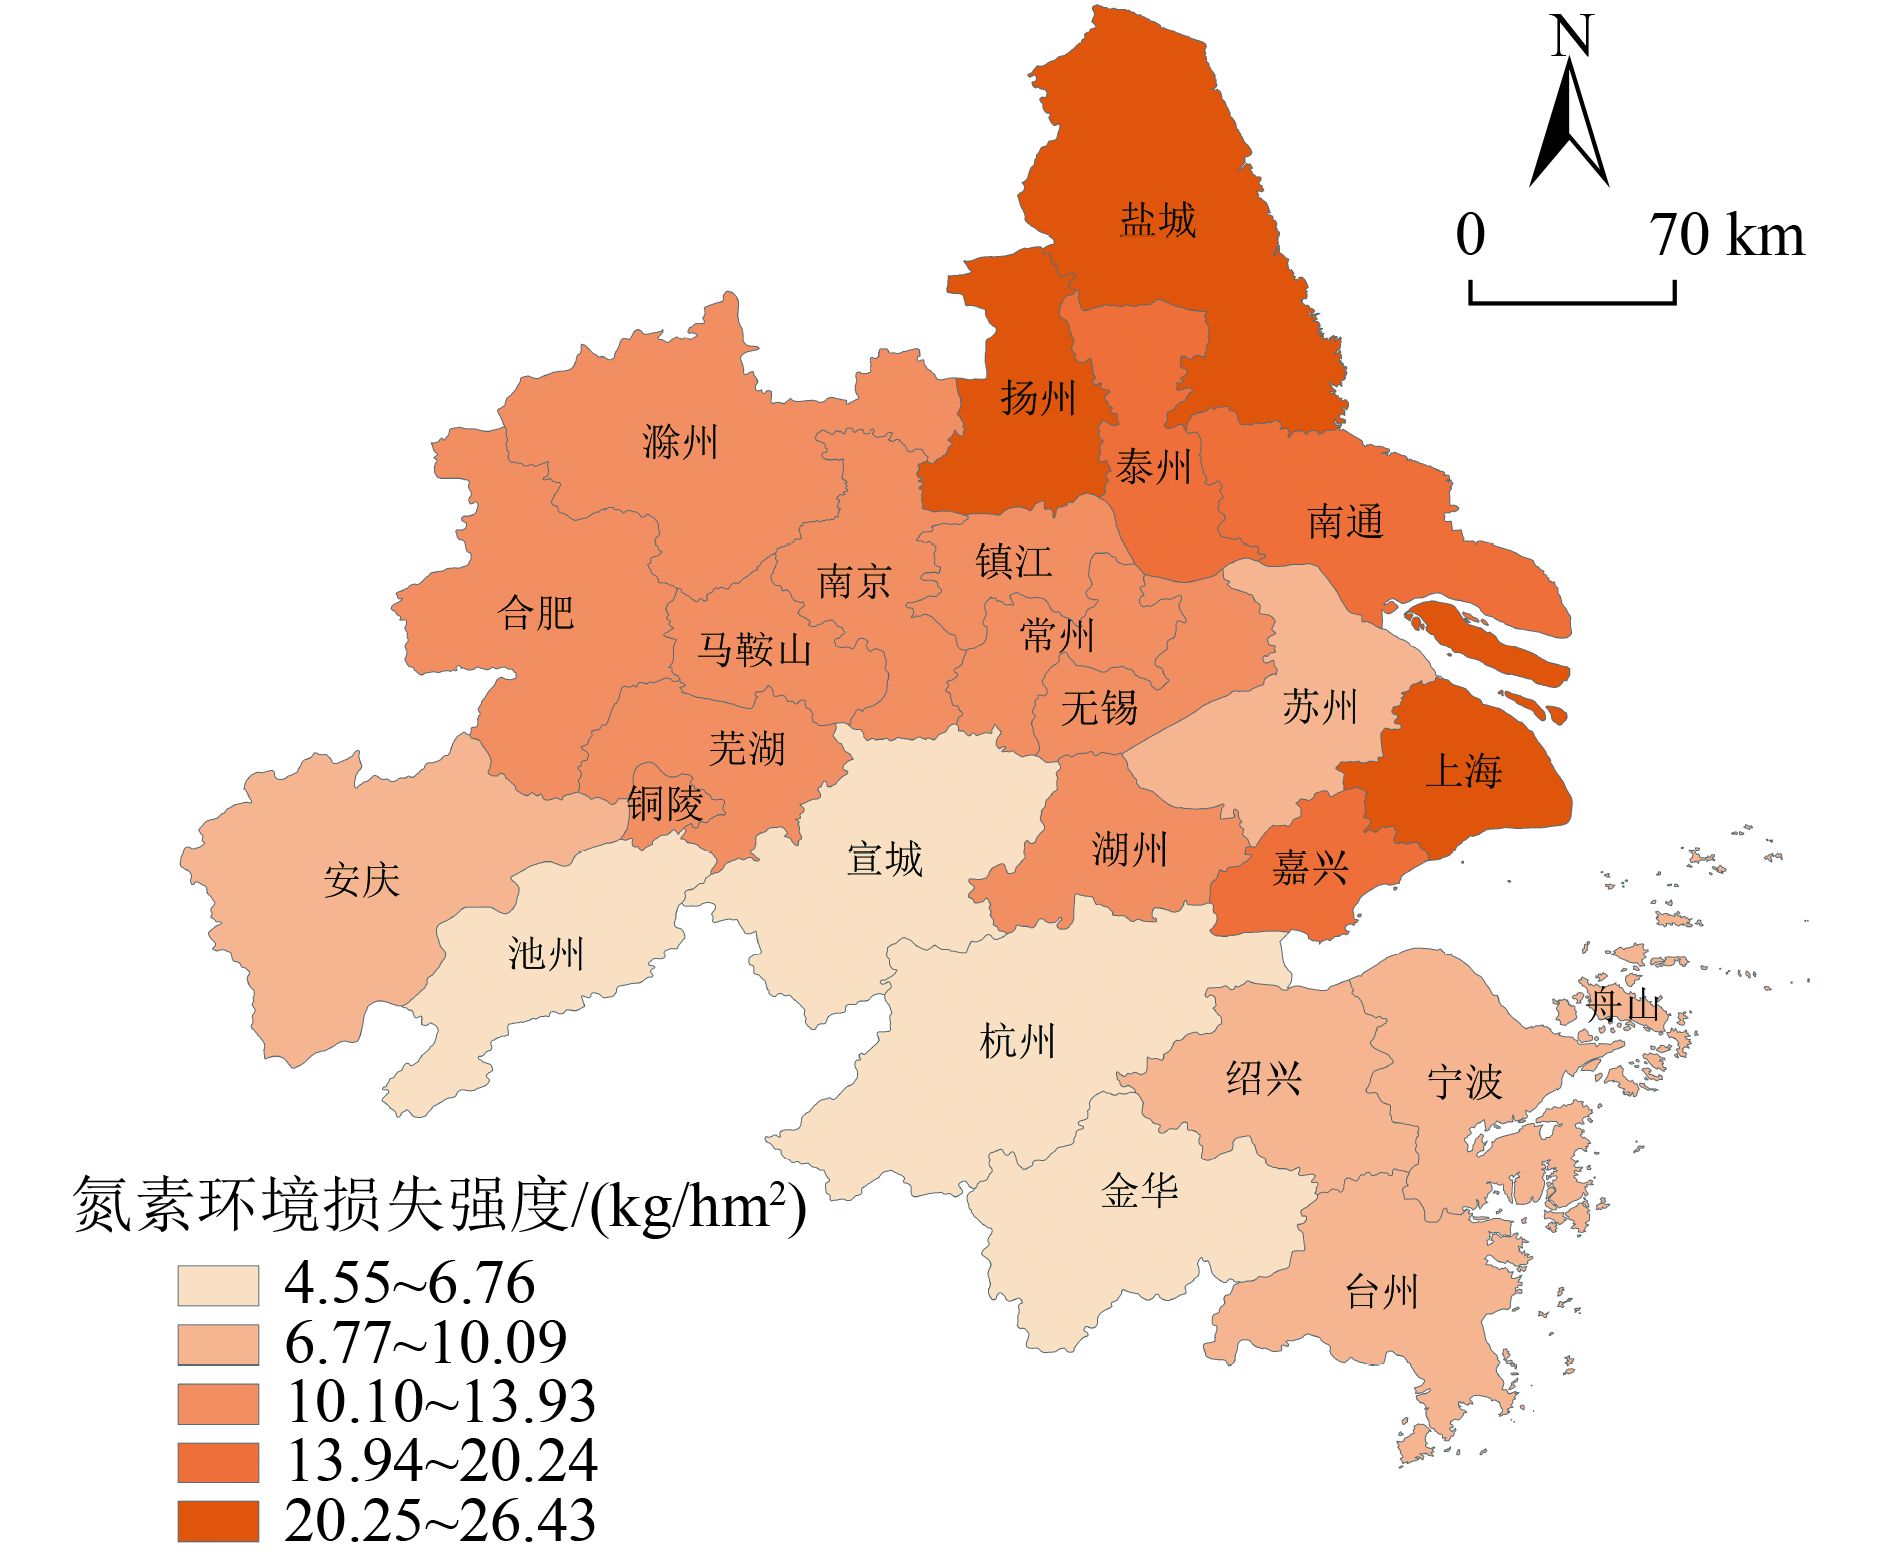
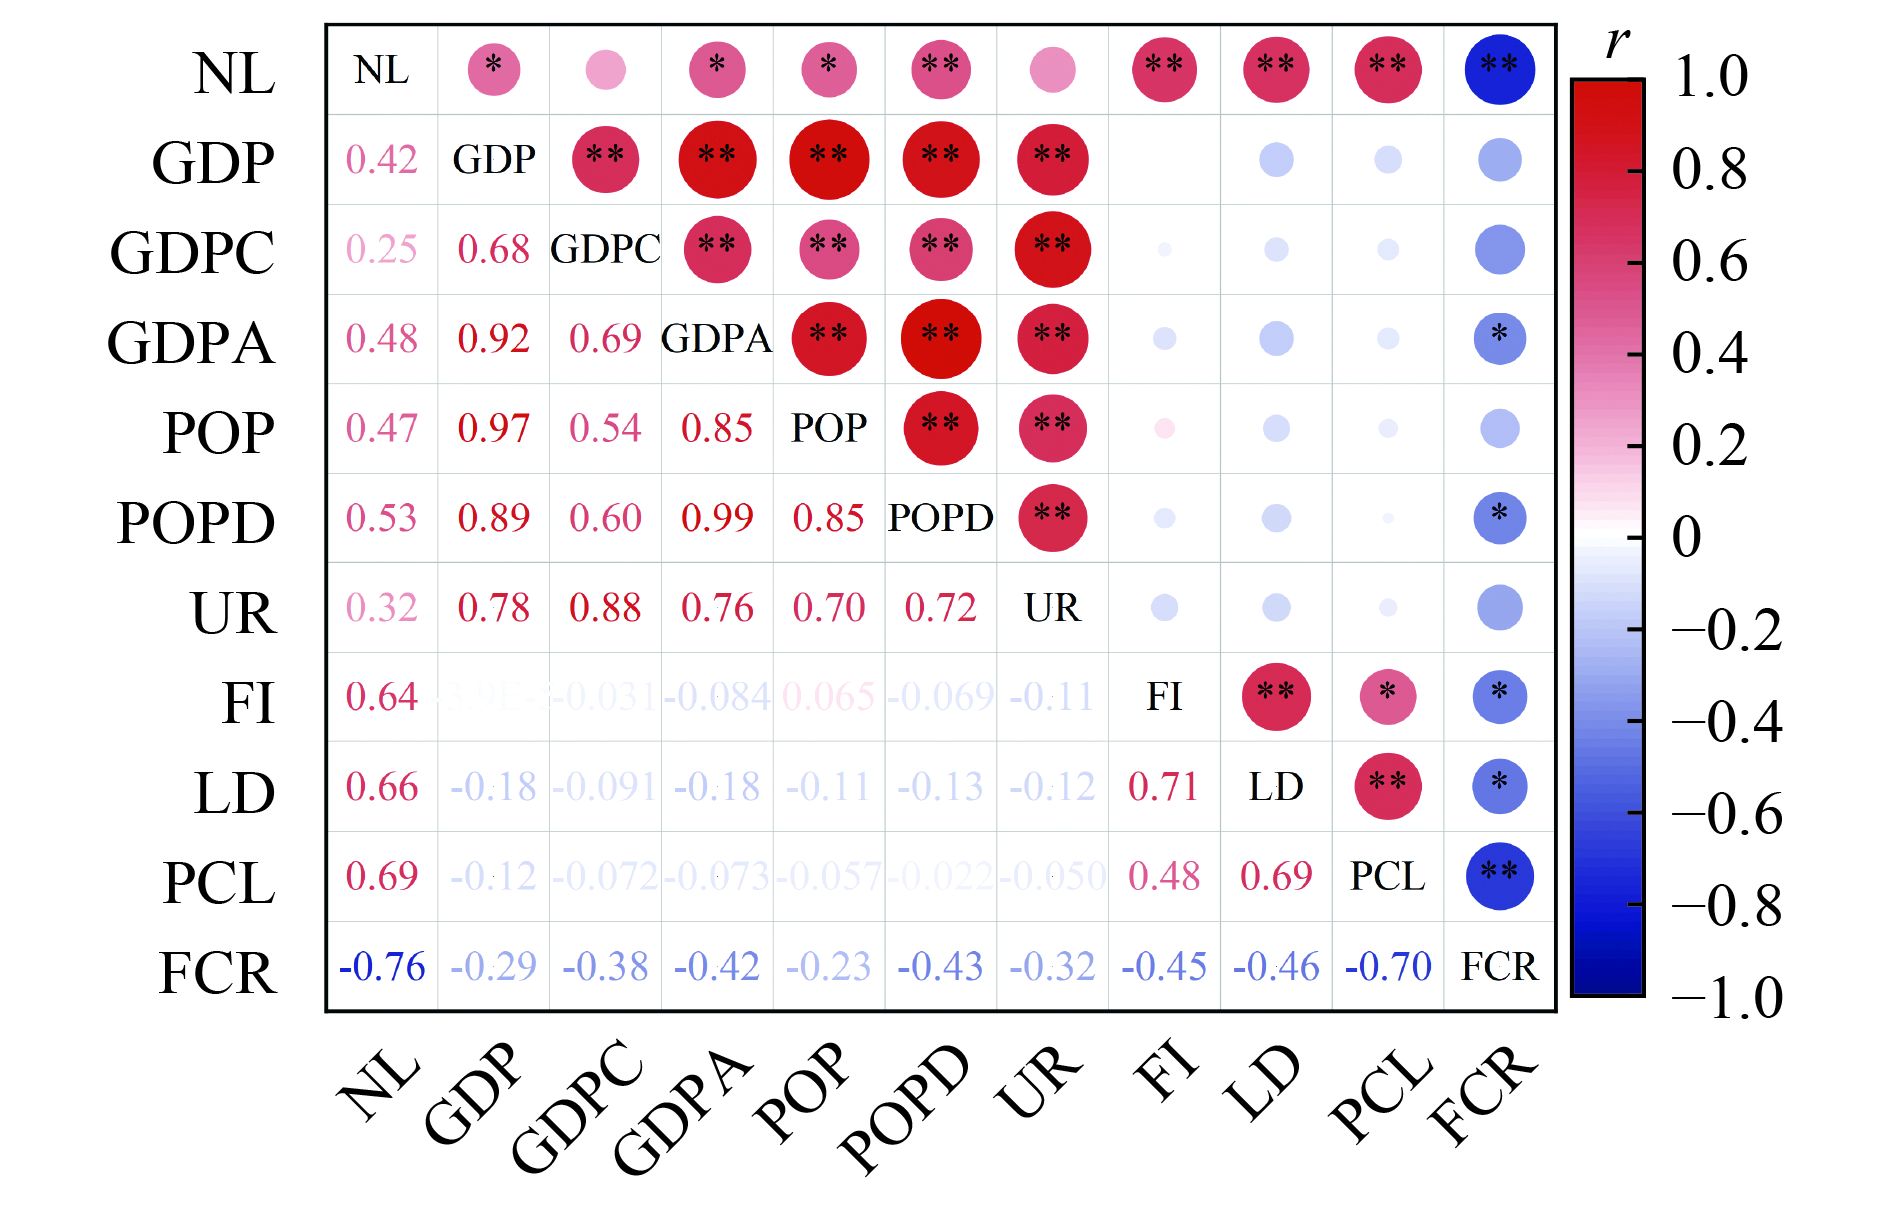
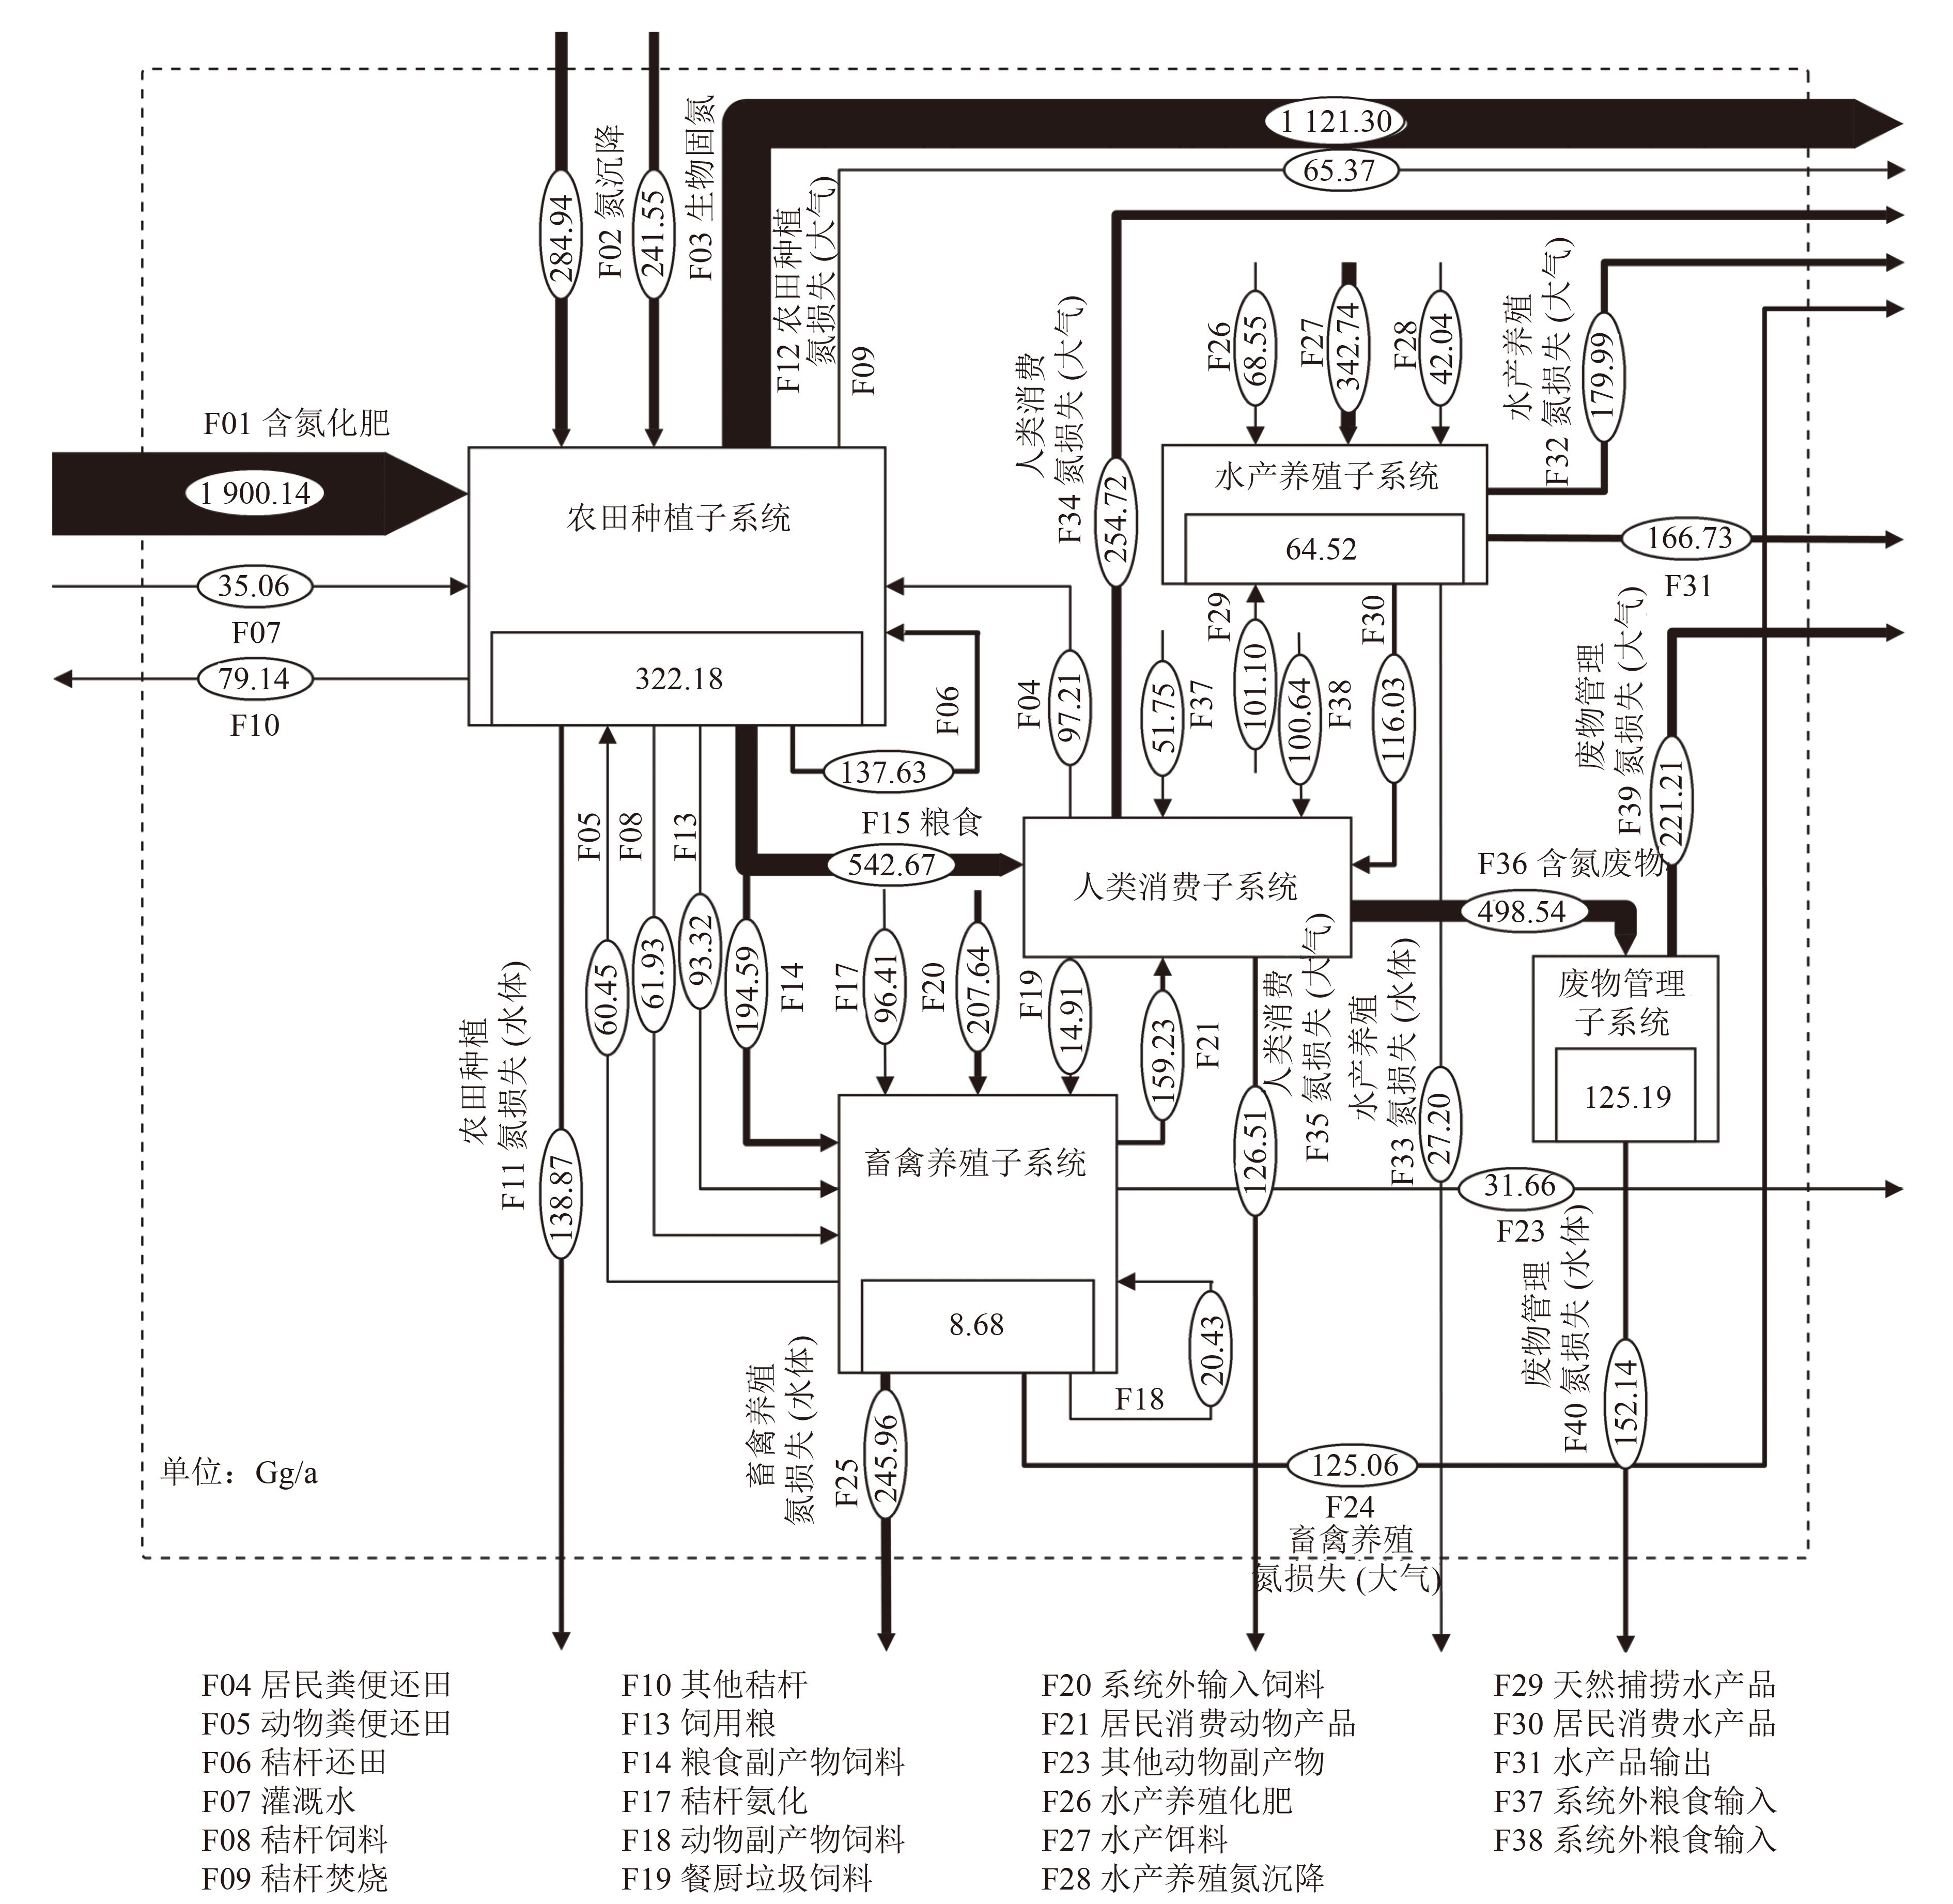
作为区域社会经济发展的重要增长极,城市群食物生产与消费系统活性氮的释放对区域氮素循环格局有着重要影响。采用物质流分析模型,定量分析2019年长三角城市群农田种植、畜禽养殖、水产养殖和人类消费子系统的氮素流动格局,评估各子系统氮素损失的结构,阐明氮素损失的空间分布,并探究氮素损失强度的主要影响因素。结果表明,系统总体氮输入为3 472.56 Gg/a,最大氮素输入项为化肥输入;系统总体氮输出为3 061.29 Gg/a,主要表现为氮素损失,占90.9%。农田种植、畜禽养殖和水产养殖子系统的氮素利用效率分别为42.6%、30.8%和40.1%。农田种植子系统对系统氮素损失的贡献最大,为1 325.53 Gg/a,占比为47.6%;其后依次为人类消费子系统、畜禽养殖子系统和水产养殖子系统。长三角各城市氮素损失强度空间异质性较大,上海、扬州、盐城较高,分别为26.43、23.20和22.26 kg/hm2;杭州、宣城、池州较低,分别为6.14、5.83和4.55 kg/hm2。氮素损失强度空间异质性与经济、人口、农业生产和土地利用等因素的相关性具有统计学意义(P<0.05或0.01),相关系数为0.42~0.76。
Abstract:As an important growth pole, the release of reactive nitrogen from food production and consumption system of city clusters greatly affects regional nitrogen cycle. The material flow analysis model was introduced to quantitatively analyze the nitrogen flow patterns among cropland, livestock, aquaculture and human consumption subsystems in the Yangtze River Delta city cluster in 2019. The structure of nitrogen loss to the environment from each subsystem, the spatial distribution of nitrogen loss, and the main influencing factors of nitrogen loss intensity were also investigated. The results indicated that the total nitrogen input to the food production and consumption system was 3 472.56 Gg/a. The largest component of the total nitrogen input came from fertilizer application. The total nitrogen output from the system was 3 061.29 Gg/a, mainly represented by nitrogen loss (90.9%). The nitrogen use efficiency (NUE) of cropland, livestock, and aquaculture subsystems was 42.6%, 30.8%, and 40.1%, respectively. Moreover, nitrogen loss from cropland subsystem was the highest, which was 1 325.53 Gg/a, accounting for 47.6% of the total nitrogen loss, followed by that from human consumption subsystem, livestock subsystem and aquaculture subsystem. The spatial heterogeneity of nitrogen loss intensity among cities in the Yangtze River Delta was significant. Shanghai, Yangzhou and Yancheng rank the top three in terms of nitrogen loss intensity, which was 26.43, 23.20 and 22.26 kg/hm2, respectively, while the nitrogen loss intensity of Hangzhou, Xuancheng and Chizhou was low, being 6.14, 5.83 and 4.55 kg/hm2, respectively. The result of Pearson correlation analysis showed that the spatial heterogeneity of nitrogen loss intensity was significantly correlated with factors including economy, population, agricultural production, and land use (P<0.05 or 0.01), with the correlation coefficients ranging from 0.42 to 0.76.
-
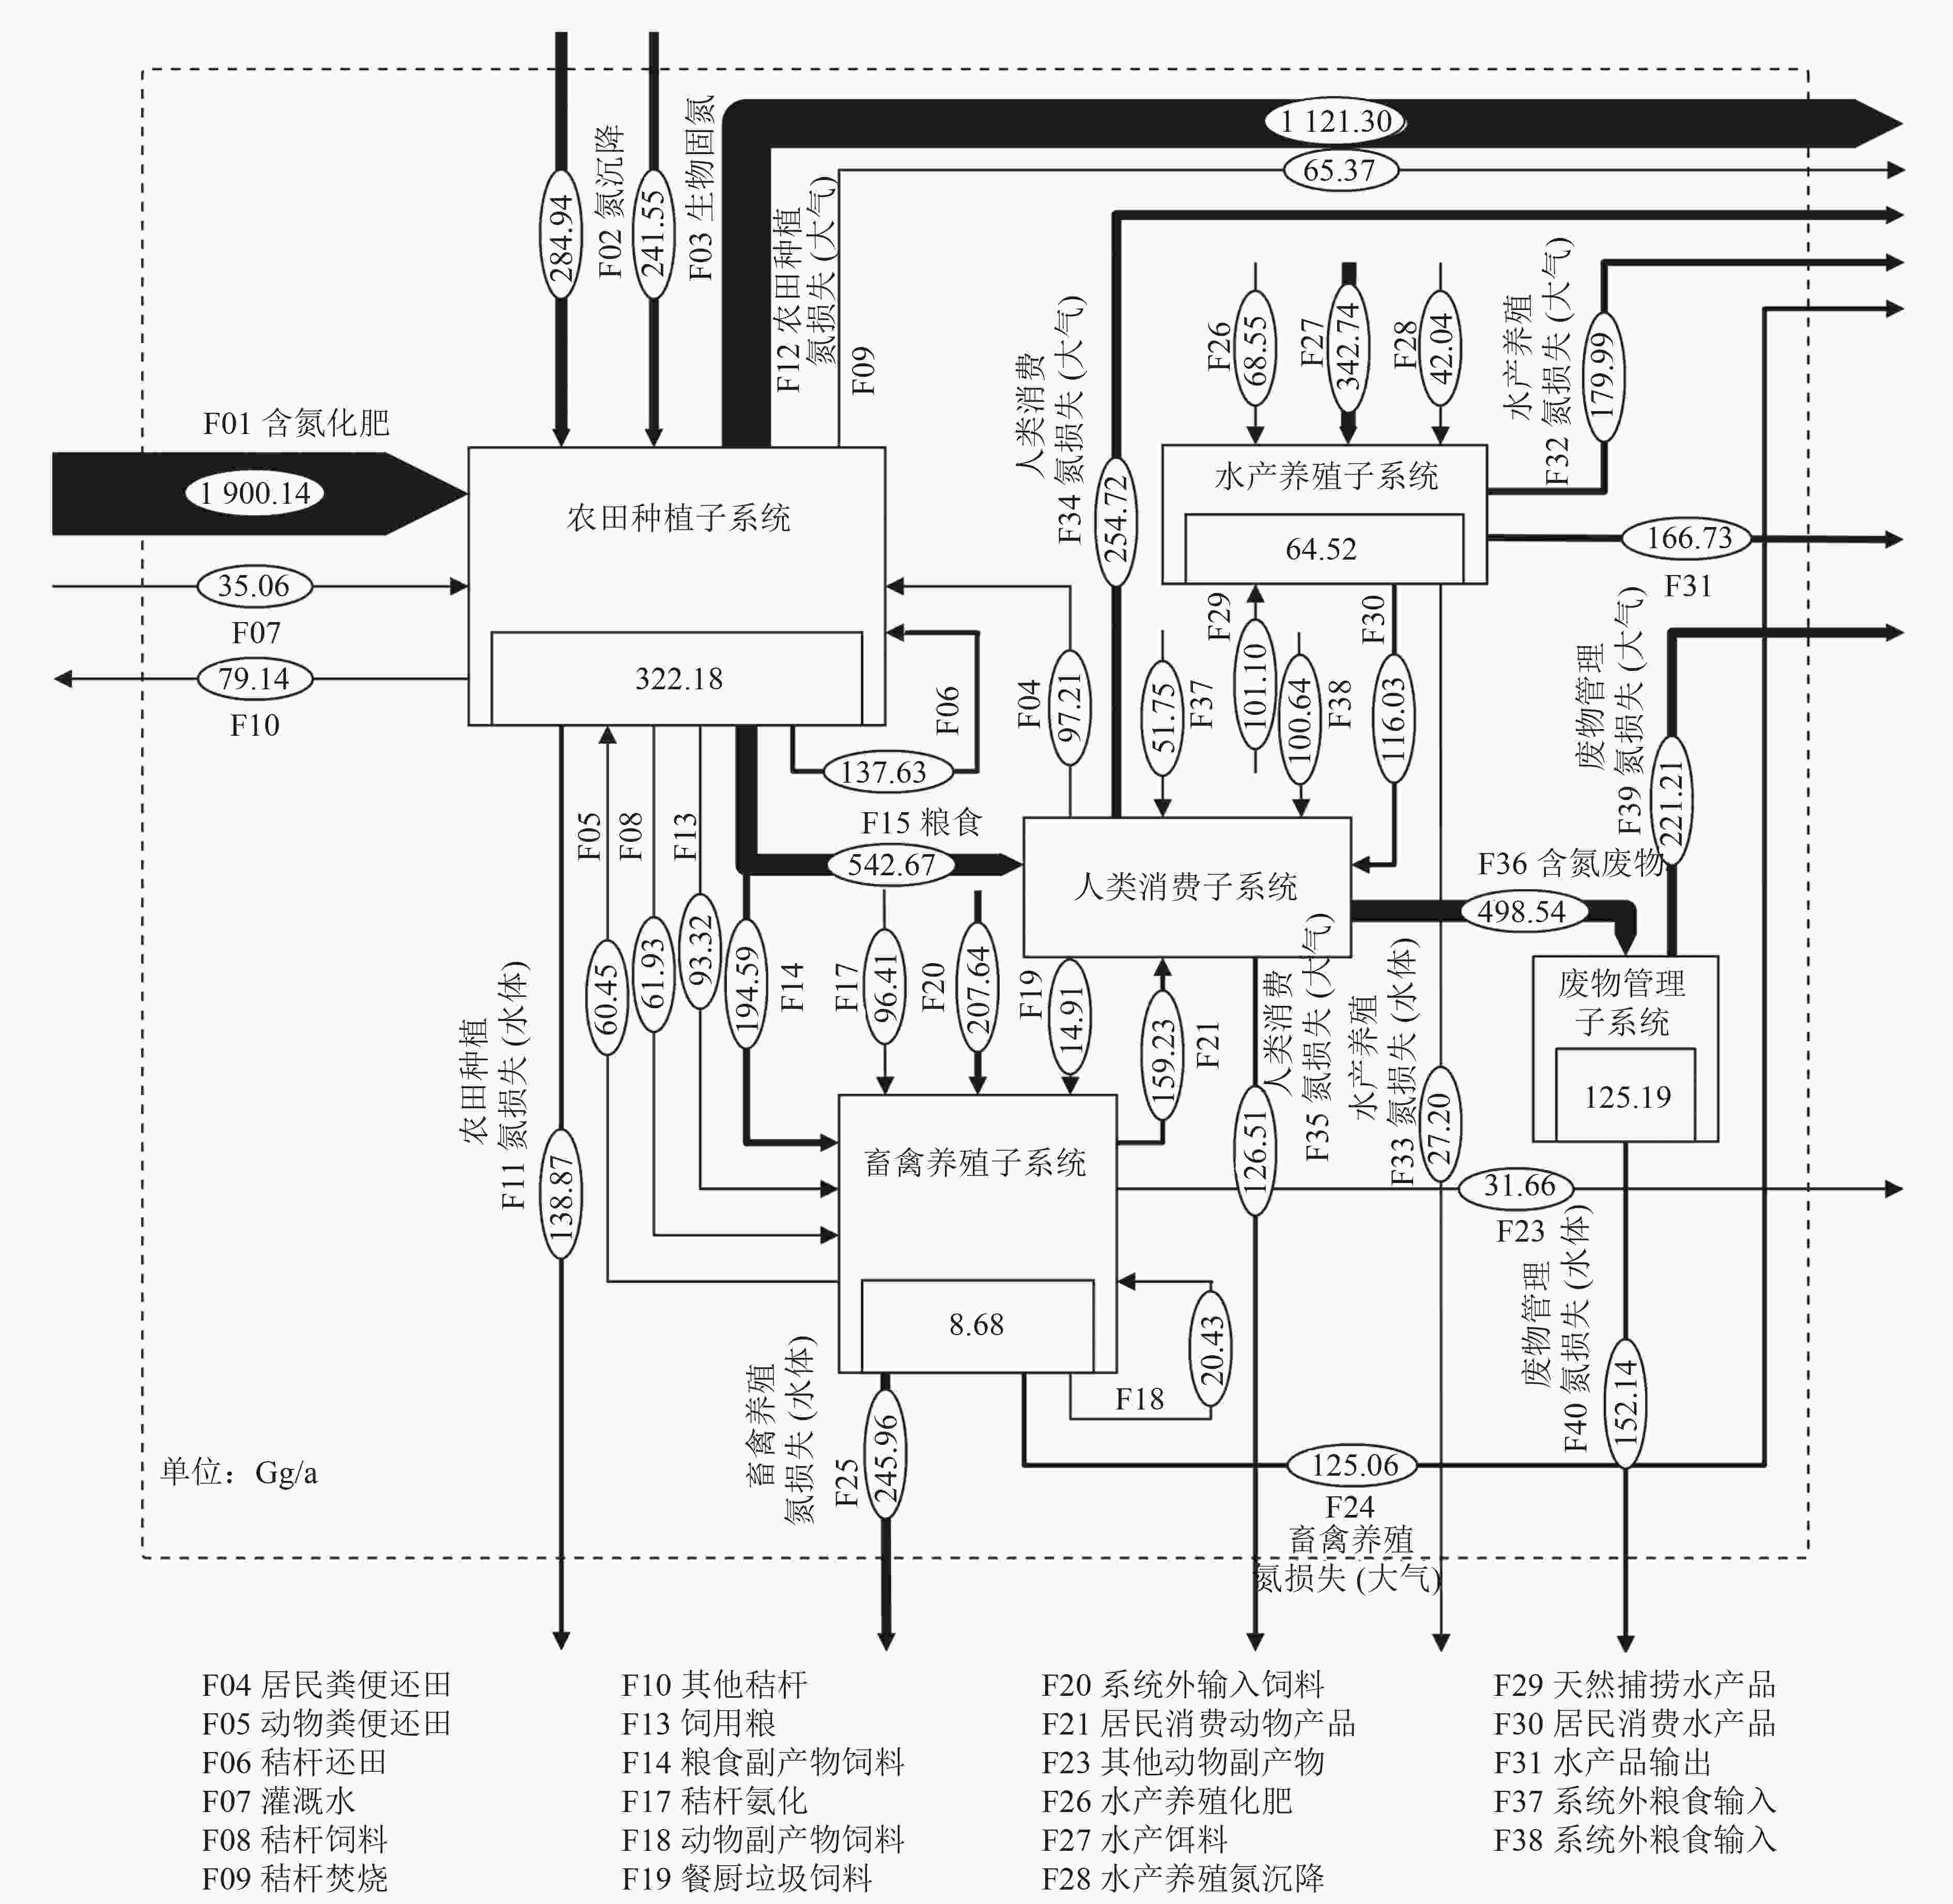
图 1 食物生产与消费系统氮素流动框架模型
Figure 1. Nitrogen flow framework for the food production and consumption system
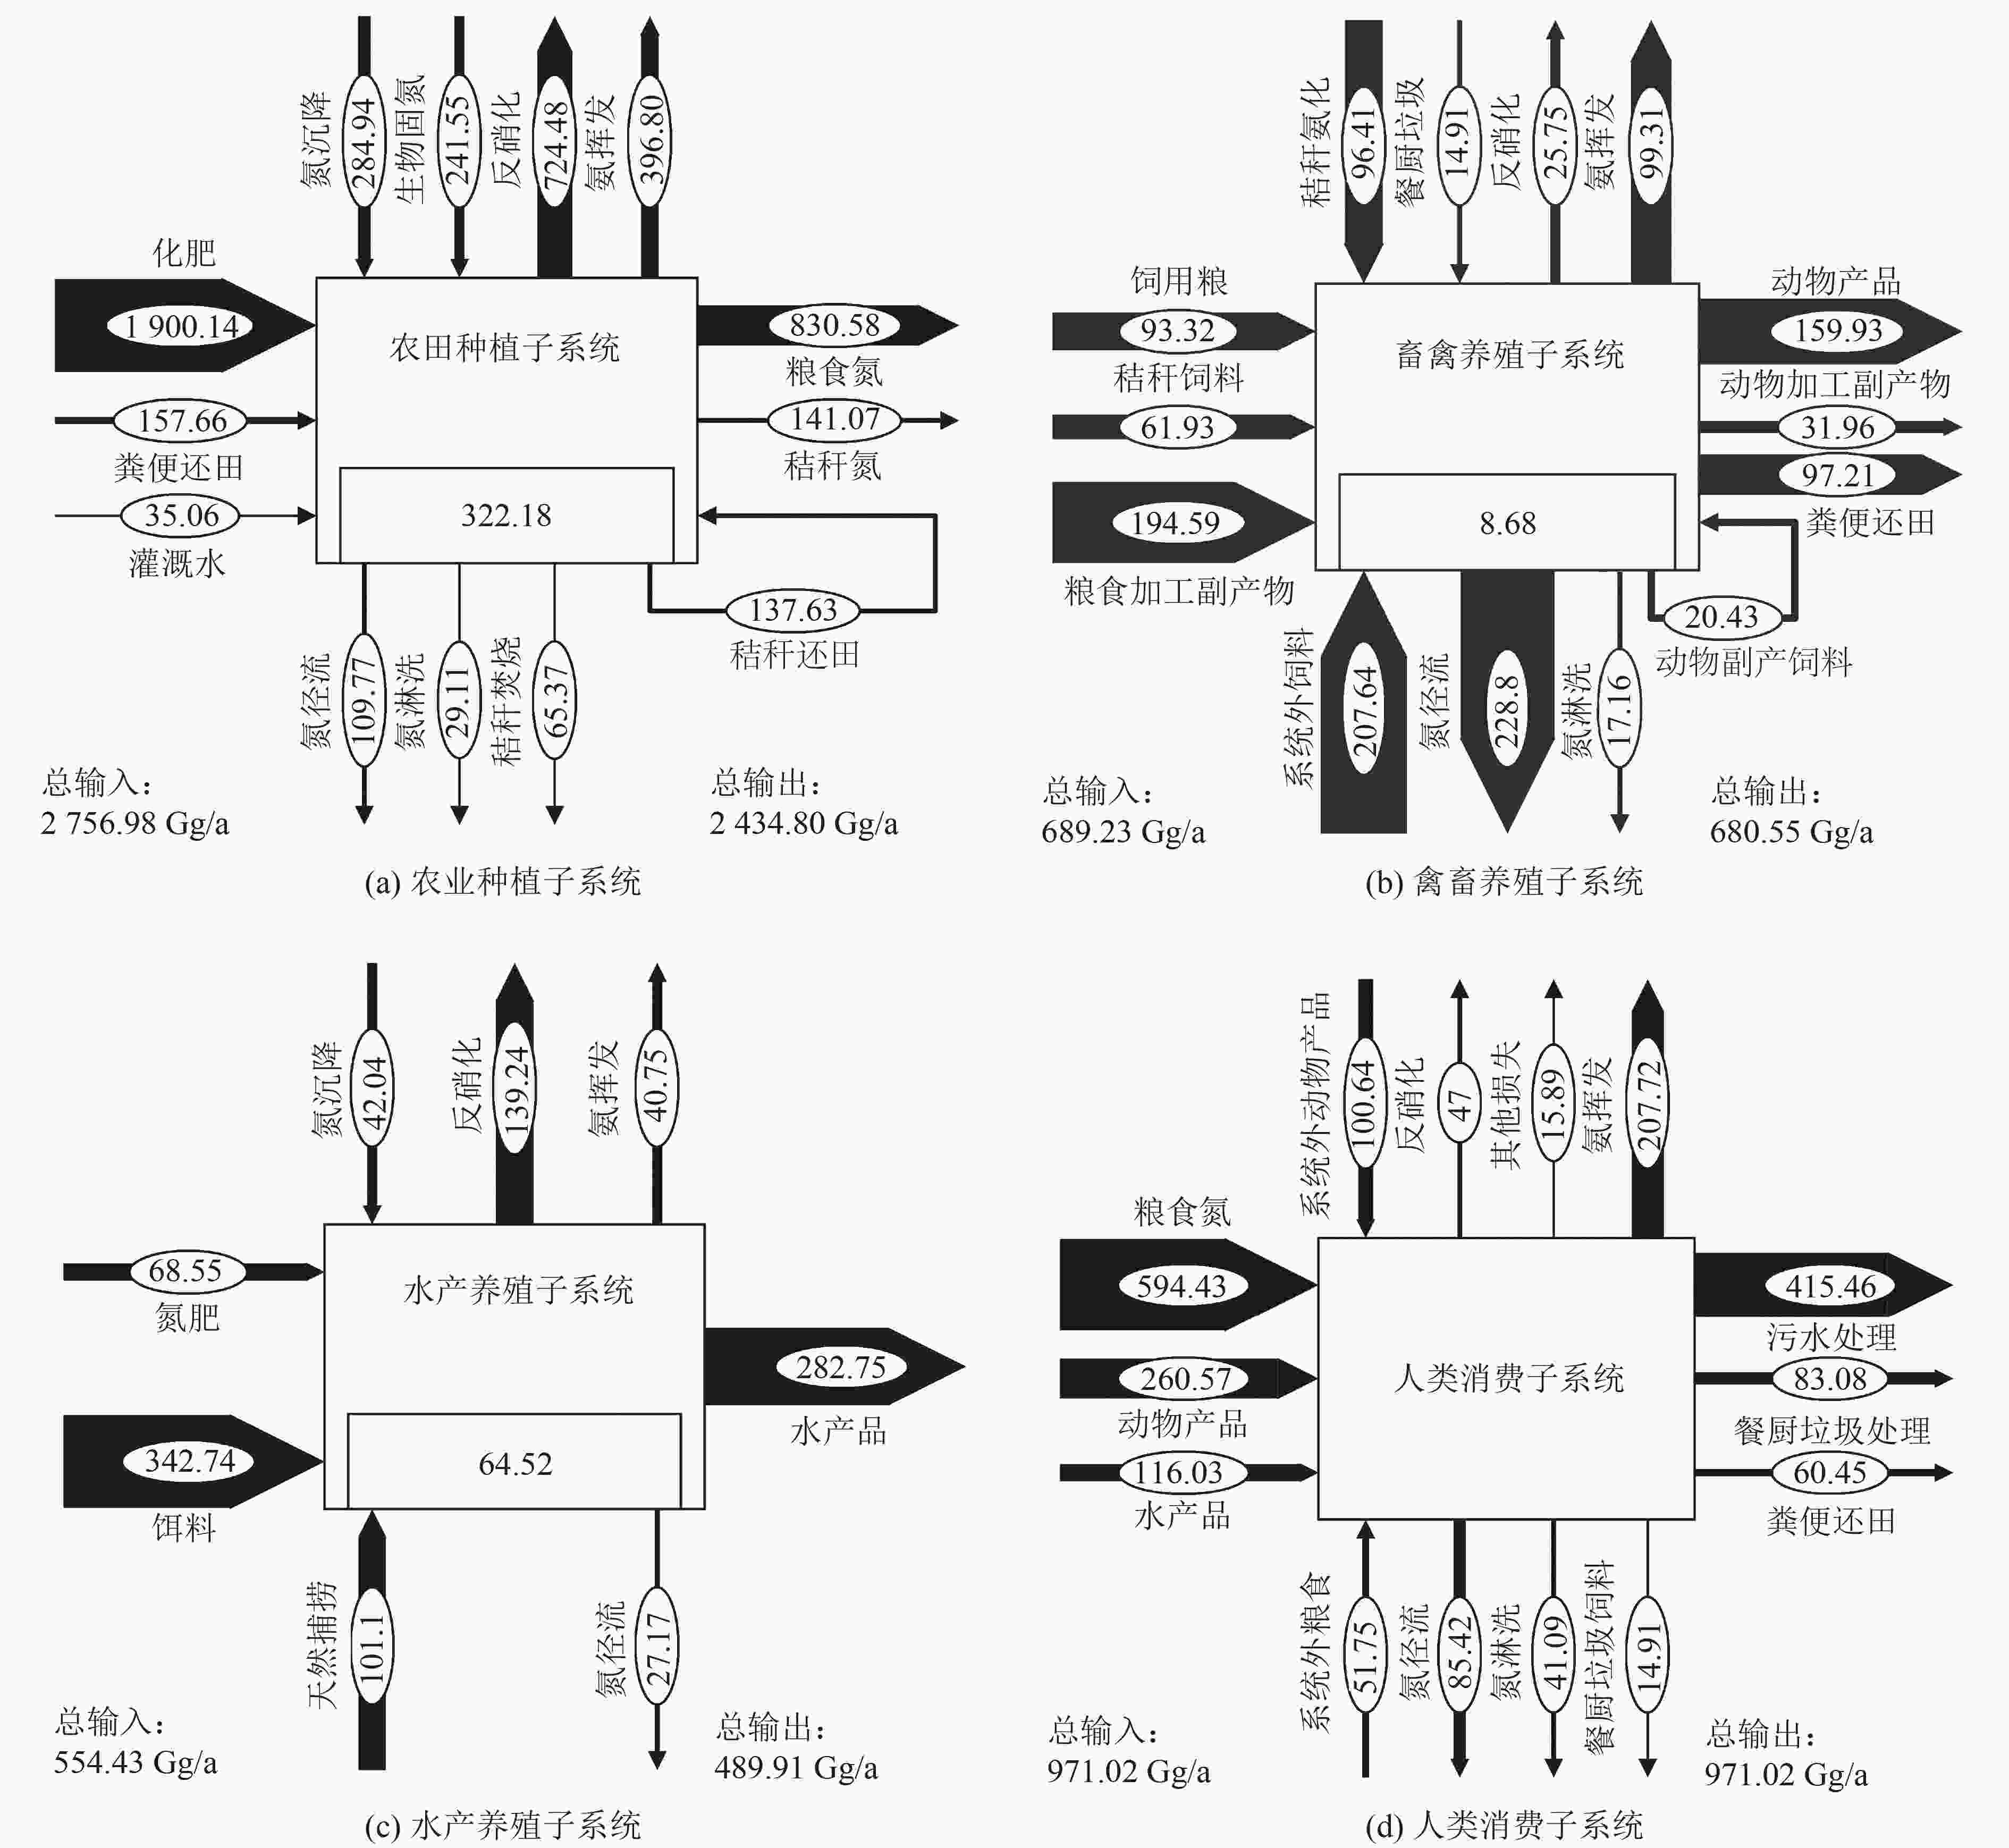
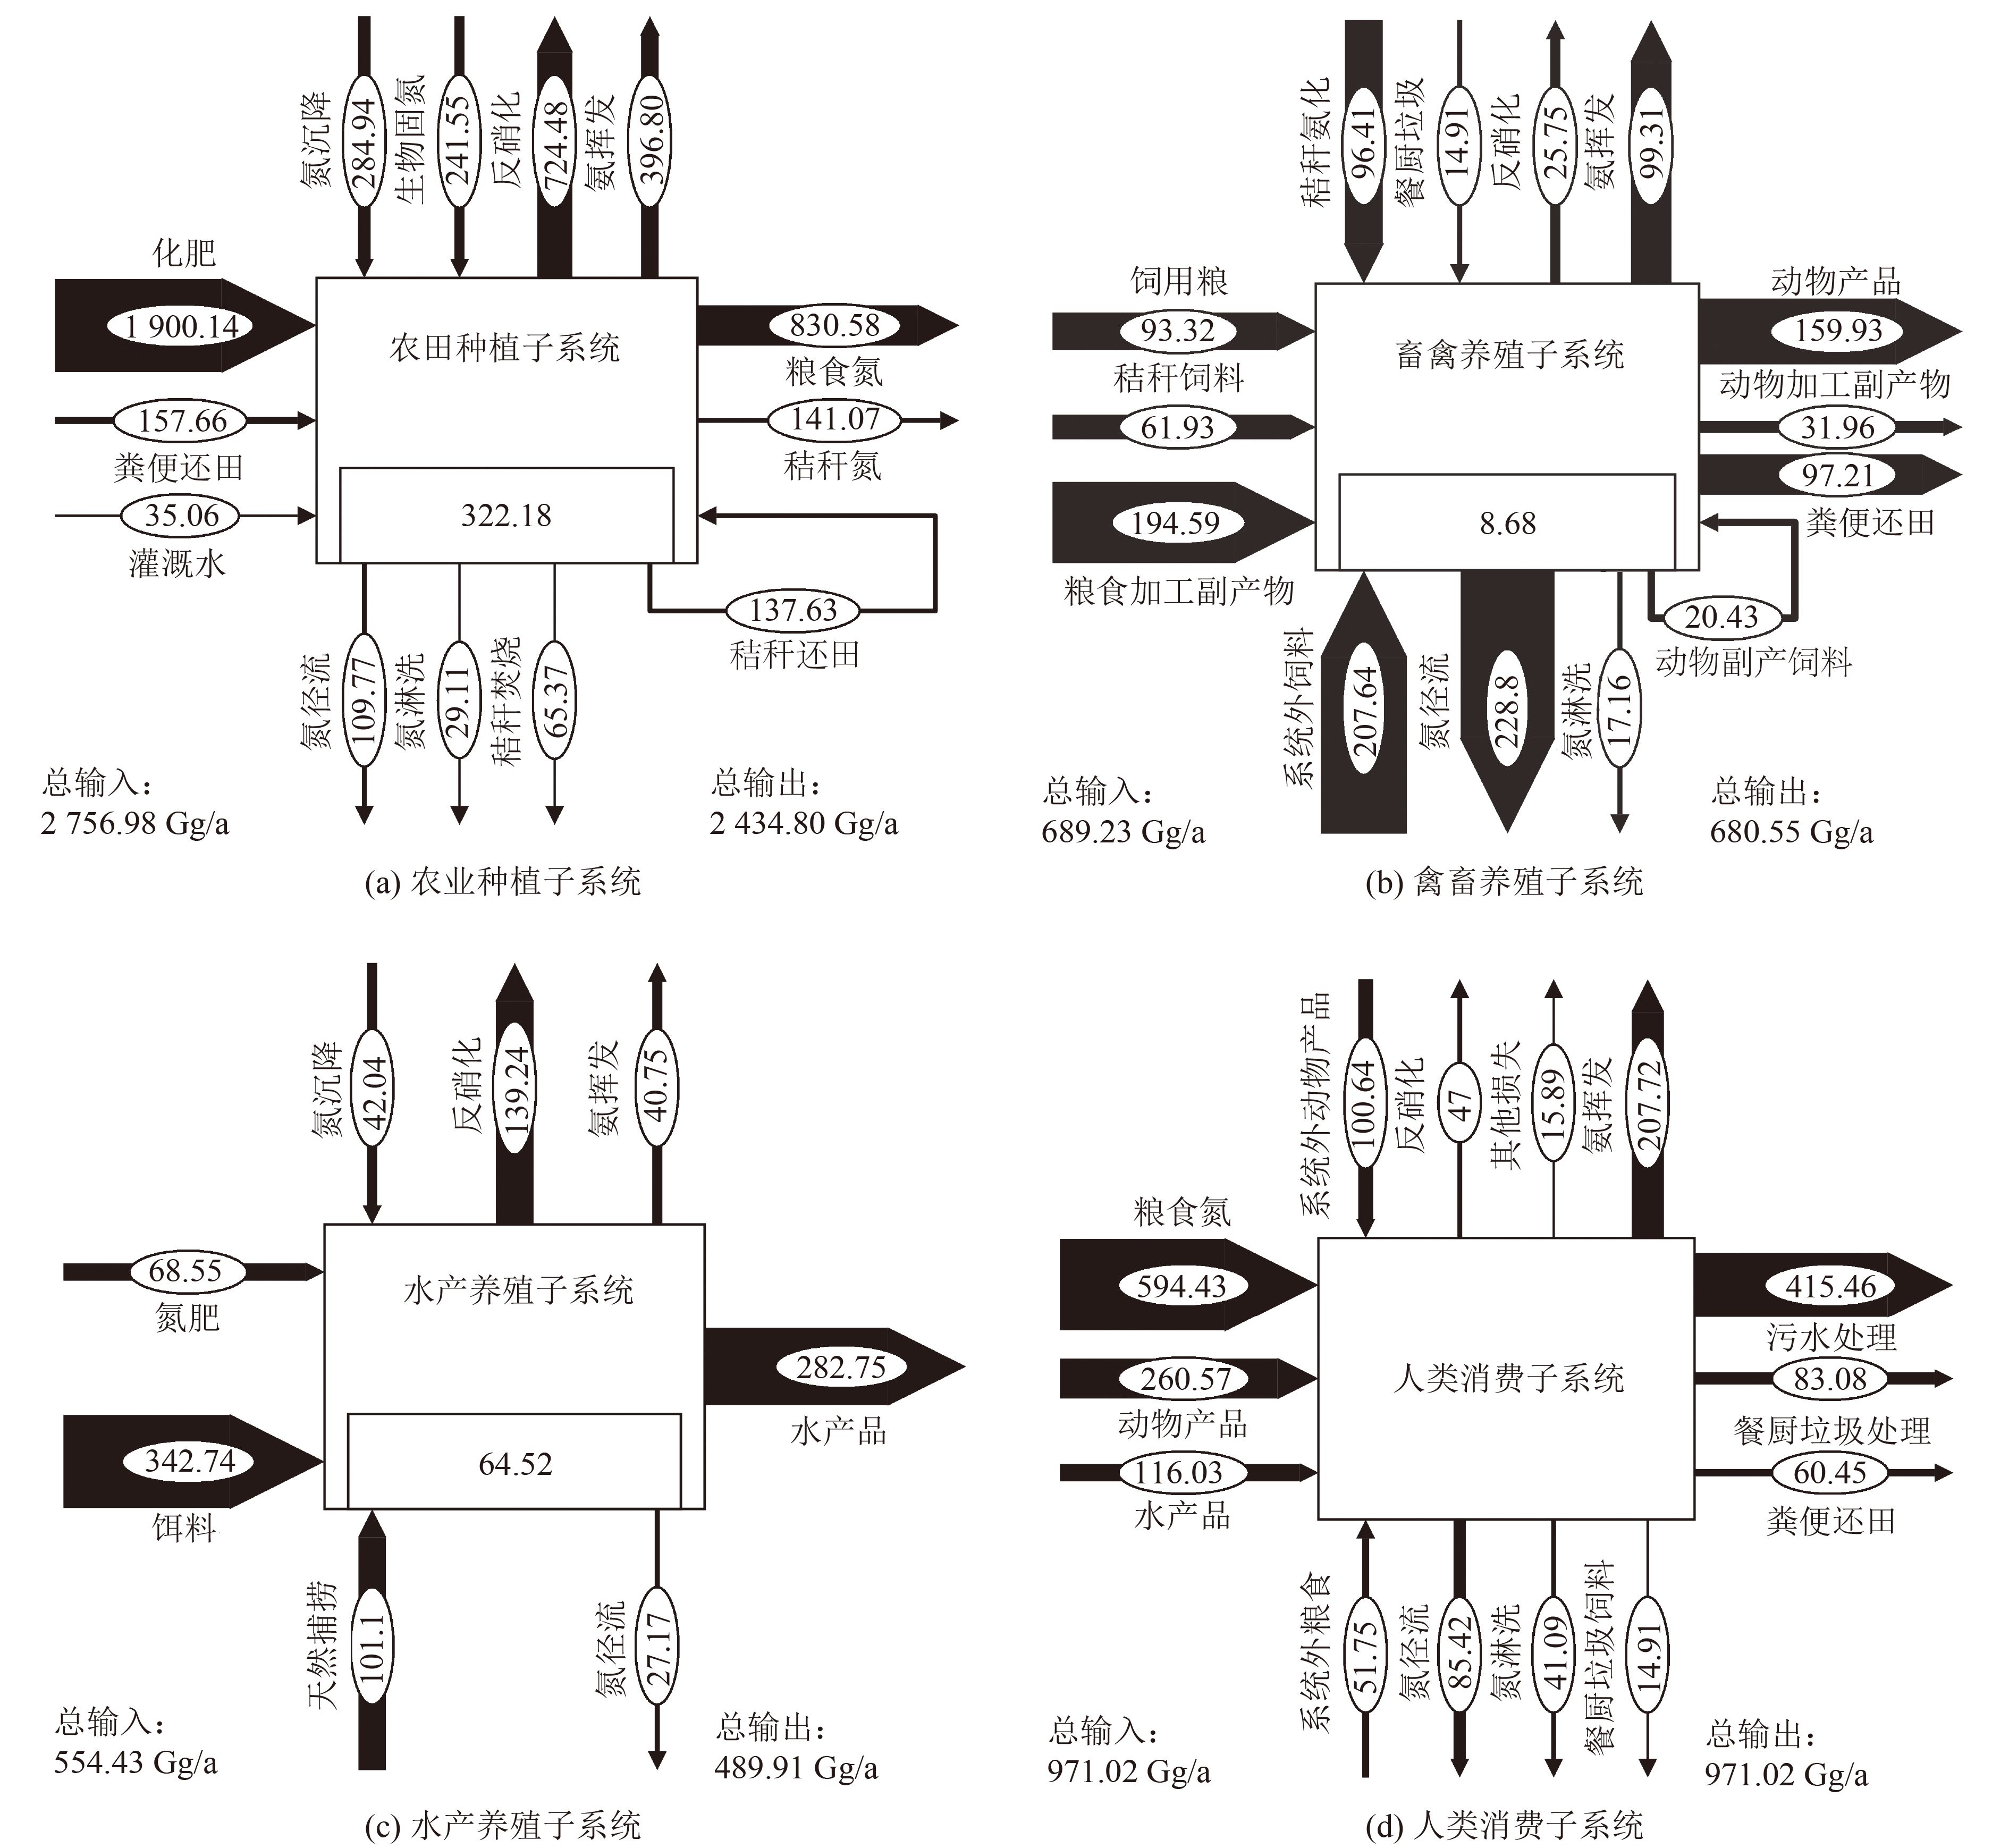
图 2 2019年长三角城市群食物生产与消费系统各子系统氮输入和氮输出
Figure 2. Nitrogen inputs and outputs in subsystems of food production and consumption system in the Yangtze River Delta city cluster in 2019

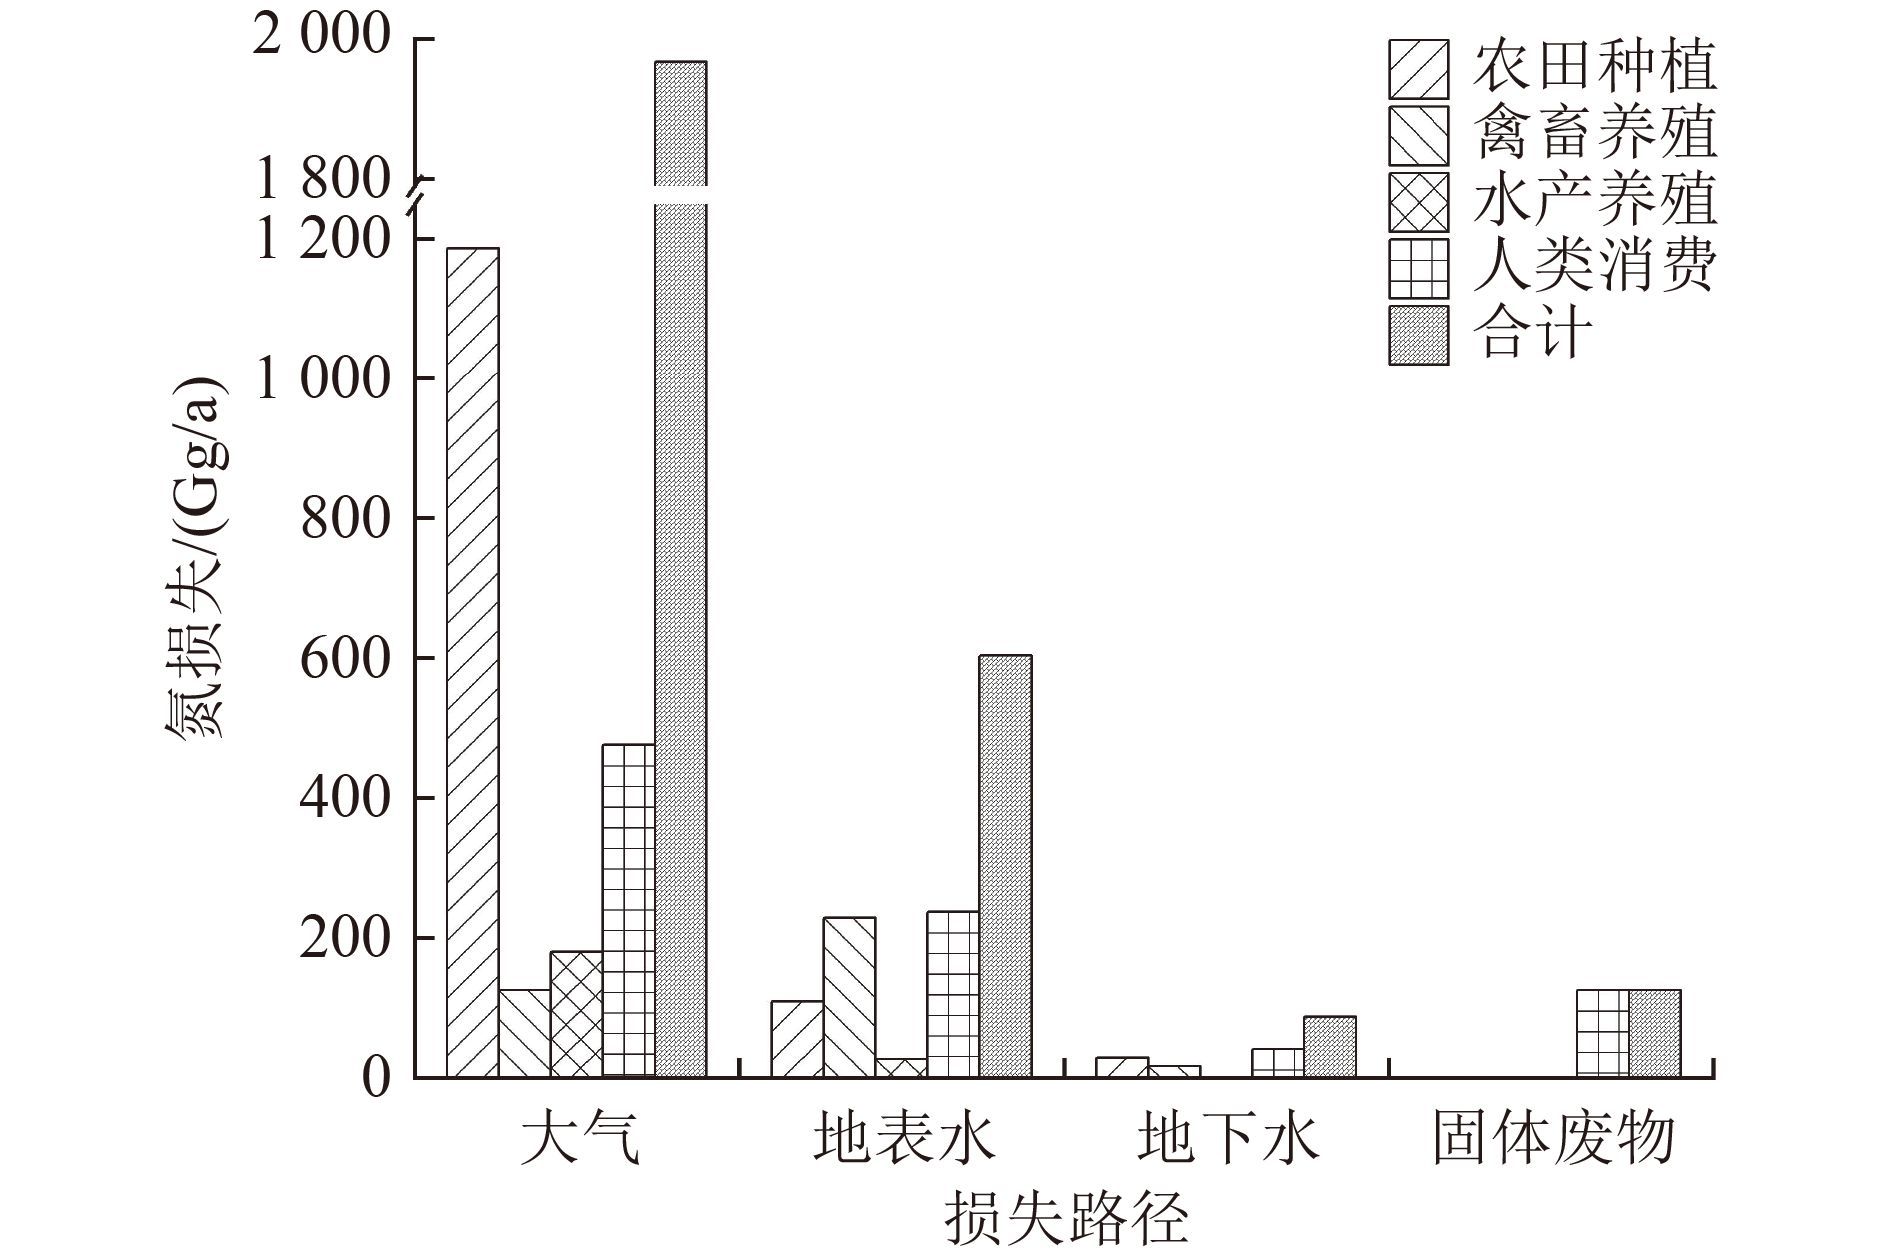
图 3 食物生产与消费系统氮素损失路径
Figure 3. Nitrogen loss paths to the environment from food production and consumption system

图 4 食物生产与消费系统氮素损失空间分布
Figure 4. Spatial distribution pattern of nitrogen losses to the environment from food production and consumption system

图 5 氮素损失强度与社会经济因素皮尔逊相关分析
注:*代表P≤0.05;**代表P≤0.01。NL—氮素损失强度;GDP—国内生产总值;GDPC—人均国内生产总值;GDPA—单位面积国内生产总值;POP—人口数量;POPD—人口密度;UR—城镇化率;FI—化肥施用强度;LD—单位面积畜禽养殖数量;PCL—耕地面积占比;FCR—森林覆盖率。
Figure 5. Pearson correlation analysis between nitrogen loss intensity and local socioeconomic factors

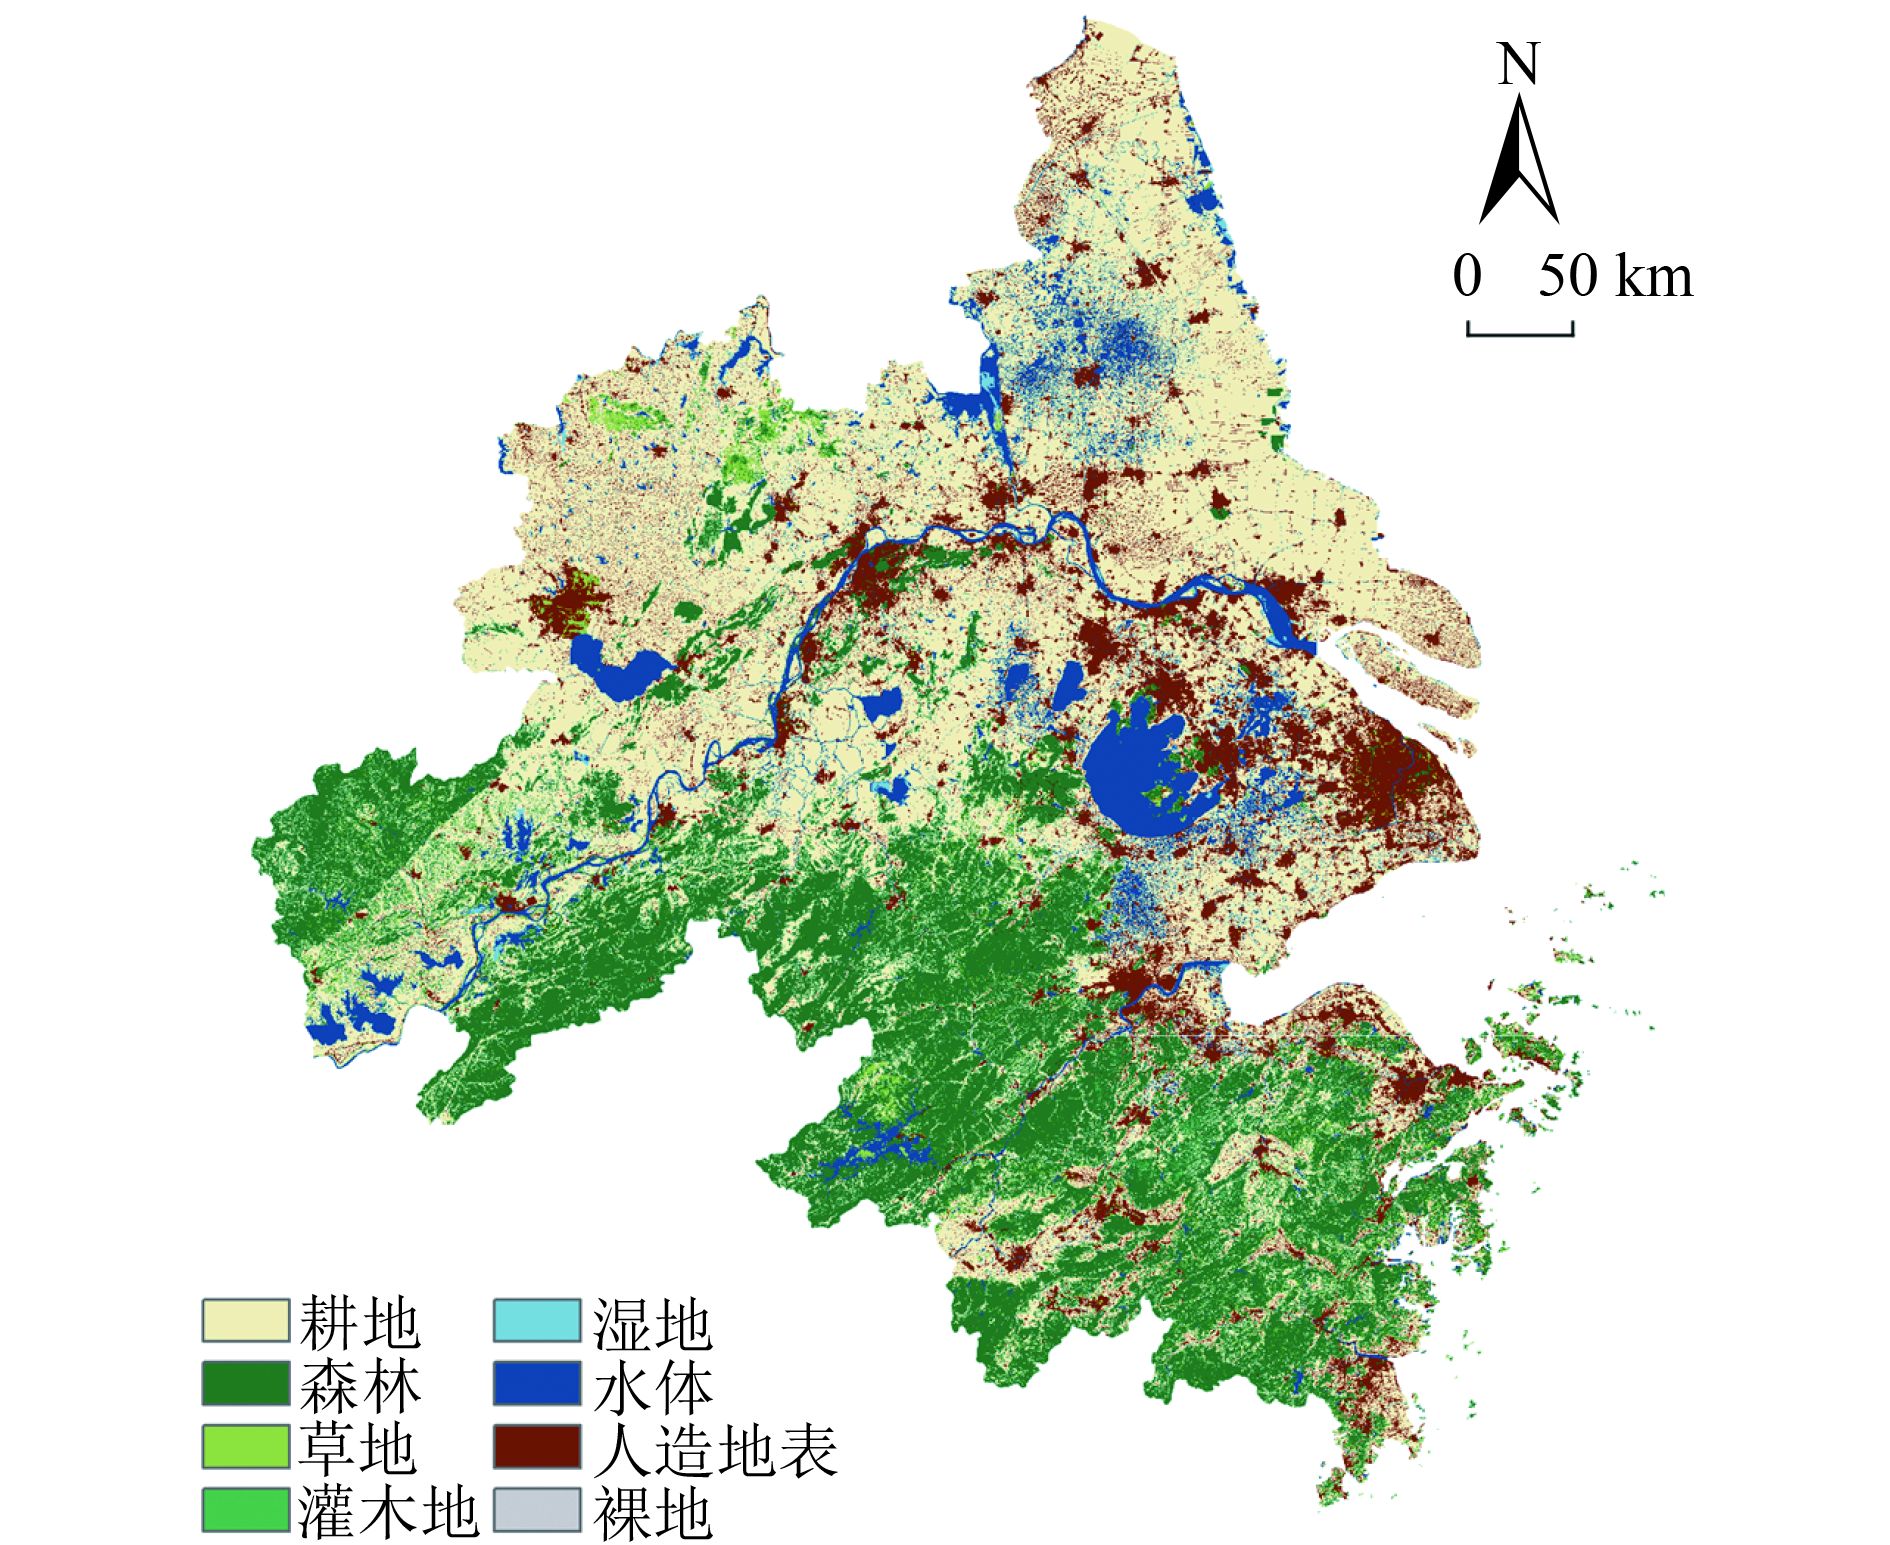
图 6 长三角城市群土地利用情况
注:数据来源于国家基础地理信息中心全球地表覆盖数据产品服务网站(DOI:10.11769)。
Figure 6. Land use types of the Yangtze River Delta city cluster
表 1 本研究与其他研究子系统划分和指标设置情况对比
Table 1. Comparison of subsystem division and index setting between this study and other studies
研究对象 子系统划分 主要指标设置 北京市食物系统氮磷流动[15] 作物生产、畜禽生产、家庭消费、废物管理 作物生产:谷类、蔬菜、水果
禽畜生产:猪、奶牛、肉牛、蛋鸡、肉鸡和绵羊
家庭消费:谷物、大豆、蔬菜、水果、猪肉、牛肉、羊肉、鸡肉、牛奶、鸡蛋,分农村和城市南京市食物生产消费活性氮通量变化及效率[16] 作物生产、动物生产、家庭消费、废物管理 作物生产:小麦、大麦、豆类、稻谷、玉米、薯类、花生、油菜、芝麻、棉花、麻类、蔬菜、瓜果、甘蔗
动物生产:牛、猪、羊、禽、兔
食物消费:粮食、植物油、蔬菜、猪肉、牛羊肉、蛋类、水产品、水果、糕点、酸奶、豆制品、家禽,分农村和城市上海市食物生产与消费系统氮素流动[19] 农田生产、禽畜养殖、食物消费 农田生产:水稻、小麦、玉米、豆类、薯类、花生、油菜、棉花、蔬菜、瓜果、芝麻、甘蔗
禽畜养殖:猪、肉牛、家禽、羊、兔
食物消费:粮食、蔬菜、瓜果、猪肉、牛肉、羊肉、禽肉、蛋类、奶类、食用油、糖类,分农村和城市人类生产和消费驱动下的广州市活性氮流动[21] 农田、城市绿地、牲畜、森林、水产养殖、工业、人类、污水处理、垃圾处理、地表水、地下水、大气 农田:大米、土豆、大豆、甘蔗、花生、棉花、烟草、蔬菜、香蕉、柑橘、菠萝、瓜类、荔枝、龙眼、枣、大麻、茶
牲畜:猪、牛、羊、家禽、兔子、马、鸟、鸡、鸭、鹅
水产:水产品产量
人类:粮食消费、畜禽产品消费和水产消费,分城市和农村长三角城市群食物生产与消费系统氮素流动(本研究) 农田种植、畜禽养殖、水产养殖、人类消费、废物管理、环境支持 农田种植:水稻、小麦、玉米、豆类、薯类、花生、油菜籽、棉花、甘蔗、蔬菜和水果
畜禽养殖:猪、牛、羊、兔、禽
水产养殖:鱼、蟹和虾,考虑水产养殖和水产捕捞
人类消费:谷物、蔬菜、水果、猪肉、牛肉、羊肉、禽肉、鸡蛋、牛奶和水产,同时考虑家庭饮食和外出就餐,分城市和农村 下载: 导出CSV
表 2 不同国家和地区食物生产与消费系统氮素利用效率对比
Table 2. Comparison of NUEs in food production and consumption systems in different countries and areas
下载: 导出CSV
表 3 食物生产与消费系统主要氮流的不确定性分析
Table 3. Uncertainty analysis of main nitrogen flows in food production and consumption system
项目 子系统名称 氮流通量(M±SD)1)/(Gg/a) 不确定性/% 氮输入 农田种植子系统 2 756.98±184.72 ±6.7 畜禽养殖子系统 689.23±84.09 ±12.2 水产养殖子系统 554.43±57.66 ±10.4 人类消费子系统 971.02±101.96 ±10.5 氮输出 农田种植子系统 2 434.80±87.65 ±3.6 畜禽养殖子系统 680.55±53.76 ±7.9 水产养殖子系统 489.91±52.91 ±10.8 人类消费子系统 955.13±80.23 ±8.4 氮累积 农田种植子系统 322.18±205.22 ±63.7 畜禽养殖子系统 8.68±1.77 ±20.4 水产养殖子系统 64.52±78.32 ±121.4 1)M±SD为误差传播方程计算的氮流通量的平均值及标准差。
下载: 导出CSV
-
[1] 冼超凡, 欧阳志云.城市生态系统氮代谢研究进展[J]. 生态学杂志,2014,33(9):2548-2557. doi: 10.13292/j.1000-4890.2014.0173XIAN C F, OUYANG Z Y. Urban ecosystem nitrogen metabolism: research progress[J]. Chinese Journal of Ecology,2014,33(9):2548-2557. doi: 10.13292/j.1000-4890.2014.0173 [2] GALLOWAY J N, WINIWARTER W, LEIP A, et al. Nitrogen footprints: past, present and future[J]. Environmental Research Letters,2014,9(11):115003. doi: 10.1088/1748-9326/9/11/115003 [3] SCHLESINGER W H, BERNHARDT E S. The global cycles of nitrogen and phosphorus[M]//Biogeochemistry. Amsterdam: Elsevier, 2013: 445-467. [4] CHEN X, CUI Z, FAN M, et al. Producing more grain with lower environmental costs[J]. Nature,2014,514:486-489. doi: 10.1038/nature13609 [5] GALLOWAY J N, ABER J D, ERISMAN J W, et al. The nitrogen cascade[J]. BioScience,2003,53(4):341. doi: 10.1641/0006-3568(2003)053[0341:TNC]2.0.CO;2 [6] GRUBER N, GALLOWAY J N. An earth-system perspective of the global nitrogen cycle[J]. Nature,2008,451:293-296. doi: 10.1038/nature06592 [7] GALLOWAY J N, TOWNSEND A R, ERISMAN J W, et al. Transformation of the nitrogen cycle: recent trends, questions, and potential solutions[J]. Science,2008,320:889-892. doi: 10.1126/science.1136674 [8] GU B J, LEACH A M, MA L, et al. Nitrogen footprint in China: food, energy, and nonfood goods[J]. Environmental Science & Technology,2013,47(16):9217-9224. [9] CUI S, SHI Y, GROFFMAN P M, et al. Centennial-scale analysis of the creation and fate of reactive nitrogen in China (1910-2010)[J]. PNAS,2013,110(6):2052-2057. doi: 10.1073/pnas.1221638110 [10] KENNEDY C A, STEWART I, FACCHINI A, et al. Energy and material flows of megacities[J]. Proceedings of the National Academy of Sciences of the United States of America,2015,112(19):5985-5990. doi: 10.1073/pnas.1504315112 [11] BAKER L A, HOPE D, XU Y, et al. Nitrogen balance for the central Arizona–Phoenix (CAP) ecosystem[J]. Ecosystems,2001,4(6):582-602. doi: 10.1007/s10021-001-0031-2 [12] SINGH S, BAKSHI B R. Accounting for the biogeochemical cycle of nitrogen in input-output life cycle assessment[J]. Environmental Science & Technology,2013,47:9388-9396. [13] 刘晓利, 许俊香, 王方浩, 等.畜牧系统中氮素平衡计算参数的探讨[J]. 应用生态学报,2006,17(3):3417-3423. doi: 10.3321/j.issn:1001-9332.2006.03.013LIU X L, XU J X, WANG F H, et al. Estimation parameters of nitrogen balance in stock farming system of China[J]. Chinese Journal of Applied Ecology,2006,17(3):3417-3423. doi: 10.3321/j.issn:1001-9332.2006.03.013 [14] BARLES S. Feeding the city: food consumption and flow of nitrogen, Paris, 1801-1914[J]. Science of the Total Environment,2007,375(1/2/3):48-58. [15] MA L, GUO J H, VELTHOF G L, et al. Impacts of urban expansion on nitrogen and phosphorus flows in the food system of Beijing from 1978 to 2008[J]. Global Environmental Change,2014,28:192-204. doi: 10.1016/j.gloenvcha.2014.06.015 [16] 周迪. 南京市食物生产消费活性氮通量变化及效率[D]. 南京: 南京师范大学, 2016. [17] 周迪, 谢标, 杨浩, 等.南京城市化食物生产消费系统氮素流动变化[J]. 生态学报,2017,37(3):960-968.ZHOU D, XIE B, YANG H, et al. Nitrogen flow associated with food production and consumption in Nanjing City[J]. Acta Ecologica Sinica,2017,37(3):960-968. [18] 汪雪野. 昆明市食物生产消费系统氮磷碳素流动及其环境负荷[D]. 南京: 南京师范大学, 2017. [19] 夏玉玲. 基于N-Calculator和物质流模型的上海市食物生产消费系统氮素流动研究[D]. 上海: 华东师范大学, 2020. [20] 王晓玉, 薛帅, 谢光辉.大田作物秸秆量评估中秸秆系数取值研究[J]. 中国农业大学学报,2012,17(1):1-8. doi: 10.11841/j.issn.1007-4333.2012.01.001WANG X Y, XUE S, XIE G H. Value-taking for residue factor as a parameter to assess the field residue of field crops[J]. Journal of China Agricultural University,2012,17(1):1-8. doi: 10.11841/j.issn.1007-4333.2012.01.001 [21] DONG Y, XU L, YANG Z, et al. Aggravation of reactive nitrogen flow driven by human production and consumption in Guangzhou City China[J]. Nature Communications,2020,11:1209. doi: 10.1038/s41467-020-14699-x [22] LIAO C S, XIA Y L, WU D M. Nitrogen flows associated with food production and consumption system of Shanghai[J]. Environmental Pollution,2021,279:116906. doi: 10.1016/j.envpol.2021.116906 [23] LIN T, WANG J, BAI X M, et al. Quantifying and managing food-sourced nutrient metabolism in Chinese cities[J]. Environment International,2016,94:388-395. doi: 10.1016/j.envint.2016.04.036 [24] SETO K C, SÁNCHEZ-RODRÍGUEZ R, FRAGKIAS M. The new geography of contemporary urbanization and the environment[J]. Annual Review of Environment and Resources,2010,35:167-194. doi: 10.1146/annurev-environ-100809-125336 [25] CUI M, GUO Q J, WEI R F, et al. Anthropogenic nitrogen and phosphorus inputs in a new perspective: environmental loads from the mega economic zone and city clusters[J]. Journal of Cleaner Production,2021,283:124589. doi: 10.1016/j.jclepro.2020.124589 [26] 国家统计局. 2020中国统计年鉴[M]. 北京: 中国统计出版社, 2020. [27] 国家发展和改革委员会, 住房和城乡建设部. 关于印发长江三角洲城市群发展规划的通知: 发改规划〔2016〕1176号[A/OL]. (2016-06-03). http://www.gov.cn/xinwen/2016-06/03/content_5079264.htm [28] ZHU X, SHEN J L, LI Y, et al. Nitrogen emission and deposition budget in an agricultural catchment in subtropical central China[J]. Environmental Pollution,2021,289:117870. doi: 10.1016/j.envpol.2021.117870 [29] IPCC. Quantifying uncertainties in practice[M]//Good practice guidance and uncertainty management in national greenhouse gas inventories. Kanagawa, Japan: The Institute for Global Environmental Strategies, 2000. [30] 朱兆良.推荐氮肥适宜施用量的方法论刍议[J]. 植物营养与肥料学报,2006,12(1):1-4. doi: 10.3321/j.issn:1008-505X.2006.01.001ZHU Z L. On the methodology of recommendation for the application rate of chemical fertilizer nitrogen to crops[J]. Plant Nutrition and Fertilizer Science,2006,12(1):1-4. doi: 10.3321/j.issn:1008-505X.2006.01.001 [31] 巨晓棠, 谷保静.我国农田氮肥施用现状、问题及趋势[J]. 植物营养与肥料学报,2014,20(4):783-795. doi: 10.11674/zwyf.2014.0401JU X T, GU B J. Status-quo, problem and trend of nitrogen fertilization in China[J]. Journal of Plant Nutrition and Fertilizer,2014,20(4):783-795. doi: 10.11674/zwyf.2014.0401 [32] 马林, 魏静, 王方浩, 等.基于模型和物质流分析方法的食物链氮素区域间流动: 以黄淮海区为例[J]. 生态学报,2009,29(1):475-483. doi: 10.3321/j.issn:1000-0933.2009.01.056MA L, WEI J, WANG F H, et al. Nitrogen flow in food chain among regions based on MFA and model: a case of Huang-Huai-Hai Plain[J]. Acta Ecologica Sinica,2009,29(1):475-483. doi: 10.3321/j.issn:1000-0933.2009.01.056 [33] 朱兆良.农田中氮肥的损失与对策[J]. 土壤与环境,2000,9(1):1-6.ZHU Z L. Loss of fertilizer N from plants-soil system and the strategies and techniques for its reduction[J]. Soil and Environmental Sciences,2000,9(1):1-6. [34] 巨晓棠, 张翀.论合理施氮的原则和指标[J]. 土壤学报,2021,58(1):1-13. doi: 10.11766/trxb202006220322JU X T, ZHANG C. The principles and indicators of rational N fertilization[J]. Acta Pedologica Sinica,2021,58(1):1-13. doi: 10.11766/trxb202006220322 [35] 黄涛. 长期碳氮投入对土壤有机碳氮库及环境影响的机制[D]. 北京: 中国农业大学, 2014. [36] 耿维, 胡林, 崔建宇, 等.中国区域畜禽粪便能源潜力及总量控制研究[J]. 农业工程学报,2013,29(1):171-179.GENG W, HU L, CUI J Y, et al. Biogas energy potential for livestock manure and gross control of animal feeding in region level of China[J]. Transactions of the Chinese Society of Agricultural Engineering,2013,29(1):171-179. [37] 上海市统计局. 2020上海统计年鉴[M]. 北京: 中国统计出版社, 2020. [38] 江苏省统计局. 2020江苏统计年鉴[M]. 北京: 中国统计出版社, 2020. [39] 浙江省统计局. 浙江统计年鉴2020[M]. 北京: 中国统计出版社, 2020. [40] 安徽省统计局. 安徽统计年鉴2020[M]. 北京: 中国统计出版社, 2020. [41] GAO B, HUANG Y F, HUANG W, et al. Driving forces and impacts of food system nitrogen flows in China, 1990 to 2012[J]. Science of the Total Environment,2018,610/611:430-441. doi: 10.1016/j.scitotenv.2017.08.071 [42] GU B J, JU X T, CHANG J, et al. Integrated reactive nitrogen budgets and future trends in China[J]. Proceedings of the National Academy of Sciences of the United States of America,2015,112(28):8792-8797. doi: 10.1073/pnas.1510211112 [43] 马云倩, 徐海泉, 郭燕枝.中国居民食物消费结构变化及未来发展政策建议[J]. 中国食物与营养,2016,22(11):46-50. doi: 10.3969/j.issn.1006-9577.2016.11.011MA Y Q, XU H Q, GUO Y Z. Development of Chinese residents' food consumption structure and future development policy suggestions[J]. Food and Nutrition in China,2016,22(11):46-50. doi: 10.3969/j.issn.1006-9577.2016.11.011 [44] 巨晓棠, 谷保静.氮素管理的指标[J]. 土壤学报,2017,54(2):281-296. doi: 10.11766/trxb201609150320JU X T, GU B J. Indexes of nitrogen management[J]. Acta Pedologica Sinica,2017,54(2):281-296. doi: 10.11766/trxb201609150320 [45] LIU Q, WANG J M, BAI Z H, et al. Global animal production and nitrogen and phosphorus flows[J]. Soil Research,2017,55(6):451. doi: 10.1071/SR17031 [46] 赖敏, 王伟力.社会经济系统氮素流动及其环境负荷: 以长江中下游城市群为例[J]. 中国人口·资源与环境,2015,25(12):15-24. doi: 10.3969/j.issn.1002-2104.2015.12.003LAI M, WANG W L. Environmental loading of anthropogenic nitrogen flow: a case study of urban agglomeration on the Middle-Lower Yangtze River Belt[J]. China Population, Resources and Environment,2015,25(12):15-24. doi: 10.3969/j.issn.1002-2104.2015.12.003 [47] LIU L, ZHANG X Y, XU W, et al. Challenges for global sustainable nitrogen management in agricultural systems[J]. Journal of Agricultural and Food Chemistry,2020,68(11):3354-3361. doi: 10.1021/acs.jafc.0c00273 [48] KARIMI R, POGUE S J, KRÖBEL R, et al. An updated nitrogen budget for Canadian agroecosystems[J]. Agriculture, Ecosystems & Environment,2020,304:107046. [49] LUO Z, HU S, CHEN D. The trends of aquacultural nitrogen budget and its environmental implications in China[J]. Scientific Reports,2018,8:10877. doi: 10.1038/s41598-018-29214-y [50] International Plant Nutrition Institute(IPNI). 4R plant nutrition manual: a manual for improving the management of plant nutrition[DB/OL]. (2014-10-06)[2021-11-22] http://www.ipni.net/article/IPNI-3255,2012. [51] DENG C N, LIU L S, PENG D Z, et al. Net anthropogenic nitrogen and phosphorus inputs in the Yangtze River Economic Belt: spatiotemporal dynamics, attribution analysis, and diversity management[J]. Journal of Hydrology,2021,597:126221. doi: 10.1016/j.jhydrol.2021.126221 [52] ZHANG X M, REN C C, GU B J, et al. Uncertainty of nitrogen budget in China[J]. Environmental Pollution,2021,286:117216. ⊗ doi: 10.1016/j.envpol.2021.117216 -

 下载:
下载:

 点击查看大图
计量
- 文章访问数: 211
- HTML全文浏览量: 111
- PDF下载量: 25
- 被引次数: 0