

Spatial-temporal distribution characteristics and retention efficiencies of nitrogen and phosphorus in Luban Reservoir in Jialing River
-
摘要: 鲁班水库是四川省第三大水库,具有灌溉、发电、防洪的功能。针对当前鲁班水库总氮(TN)、总磷(TP)浓度超标问题,阐明水库氮(N)、磷(P)时空分布特征,量化水库TN和TP的截留量及截留率,并识别影响水库水质的关键因素。结果表明:水库TN浓度年均值为(0.65±0.22)mg/L,TP浓度年均值为(0.05±0.03)mg/L。水库对TN和TP的截留率分别为55.38%和53.66%,其中,通过灌溉调水的途径去除的TN和TP分别占水库总截留量的38.11%和40.85%。除了外源N、P输入以外,水库中藻类的生长、死亡和分解过程影响水库N、P浓度,以及水库对N、P的截留率。可通过降低外源N、P输入,同时控制水库内部藻类的生长改善鲁班水库水质。Abstract: Luban Reservoir is the third largest reservoir in Sichuan Province, which plays an important role in irrigation, power generation and flood control. However, concentrations of total nitrogen (TN) and total phosphorus (TP) of the reservoir cannot achieve the water quality standard. In order to address this water quality problem, there is an urgent demand in illustrating the spatial-temporal distribution characteristics of nitrogen (N) and phosphorus (P), assessing the retention amount and efficiencies of N and P, and identifying the critical factors affecting the water quality of the reservoir. The results suggested that concentrations of TN and TP were (0.65±0.22) mg/L and (0.05±0.03) mg/L, respectively. The retention efficiencies of TN and TP by the reservoir were 55.38% and 53.66%, respectively. Irrigation and water transfer contributed 38.11% and 40.85% of TN and TP retention of the total interception of the reservoir, respectively. Apart from the external inputs of N and P in the reservoir, the growth, death and decomposition of algae in the reservoir affected the concentration of N and P and the retention efficiencies of N and P in the reservoir. Therefore, decreasing external inputs of N and P and controlling algae growth in the reservoir would effectively improve the water quality of Luban Reservoir.
-
Key words:
- Jialing River /
- Luban Reservoir /
- nitrogen retention /
- phosphorus retention /
- water quality
-
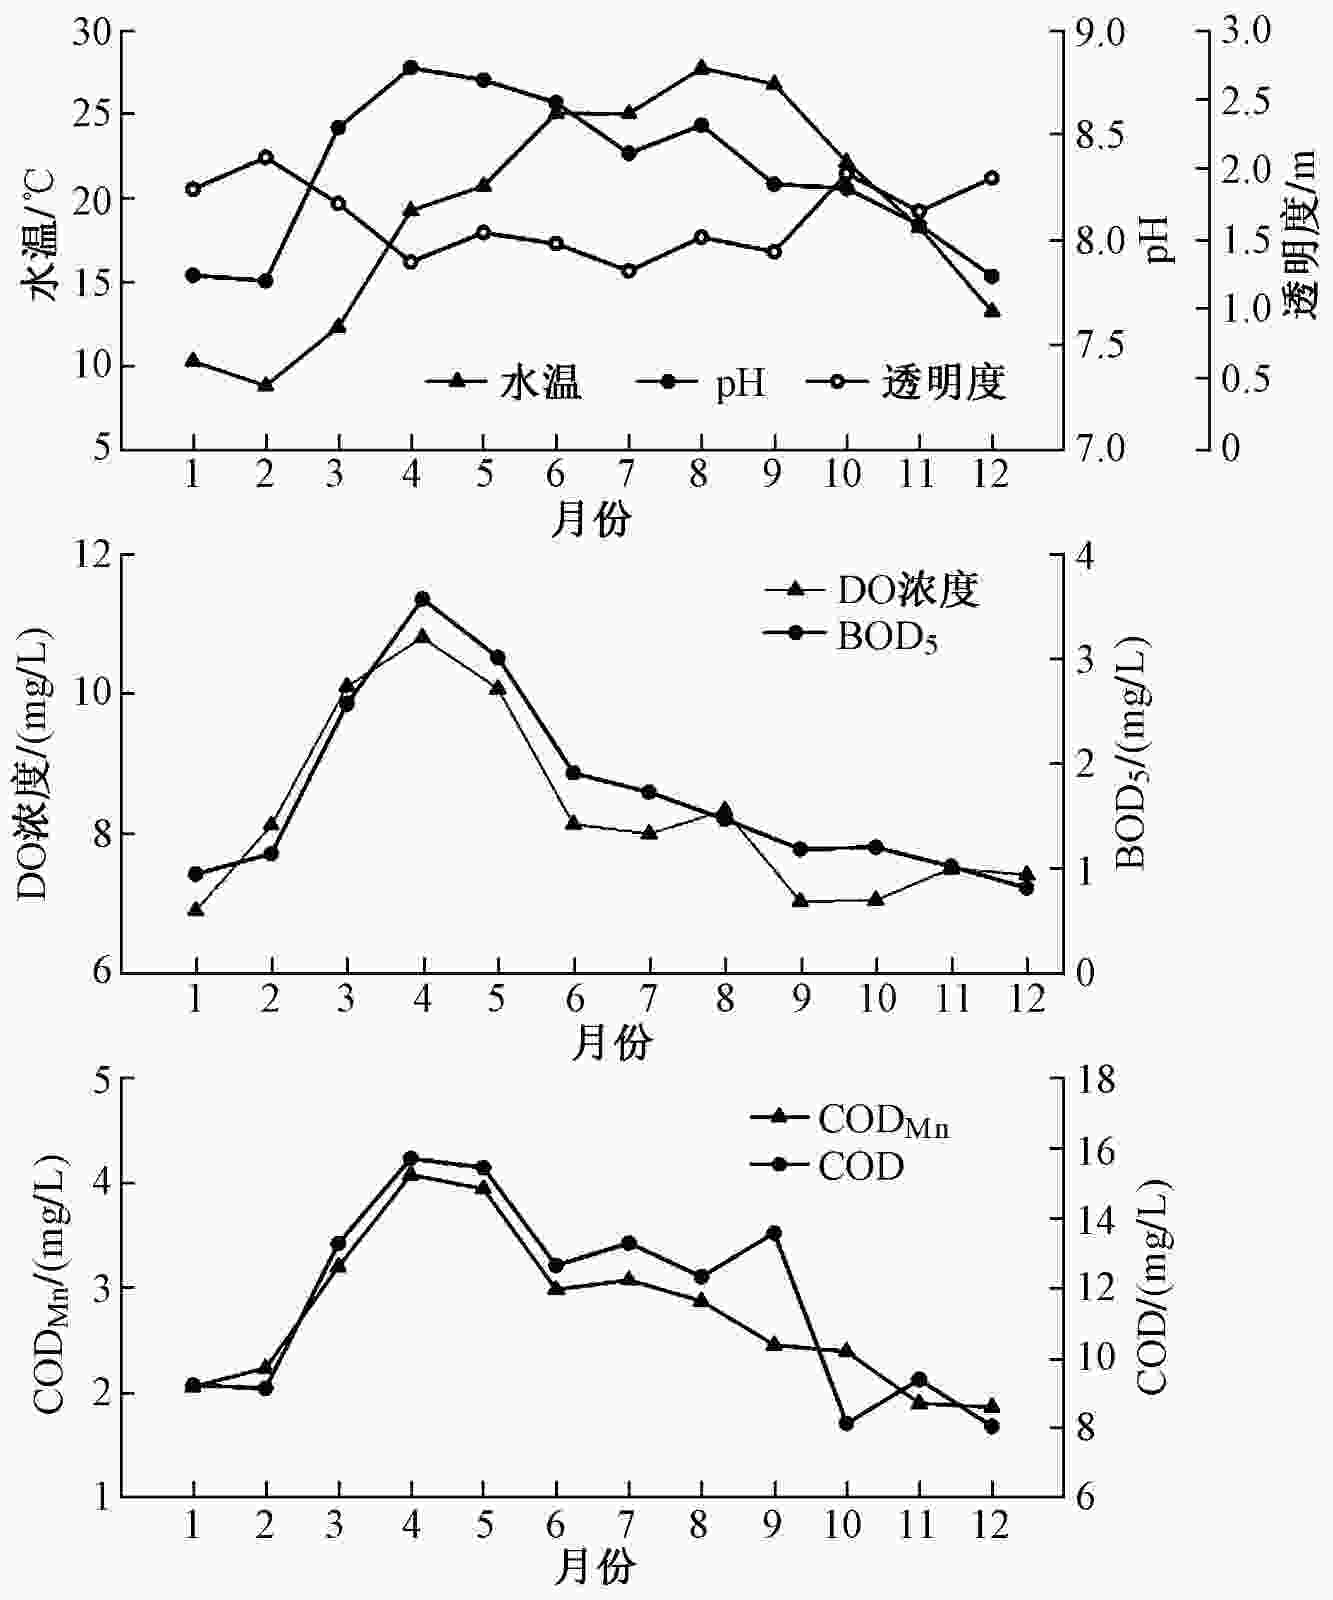
图 1 鲁班水库水温、pH、透明度、DO、CODMn、COD和BOD5逐月变化特征
Figure 1. Monthly variations of water temperature, pH, transparency , DO, CODMn, COD and BOD5 in Luban Reservoir
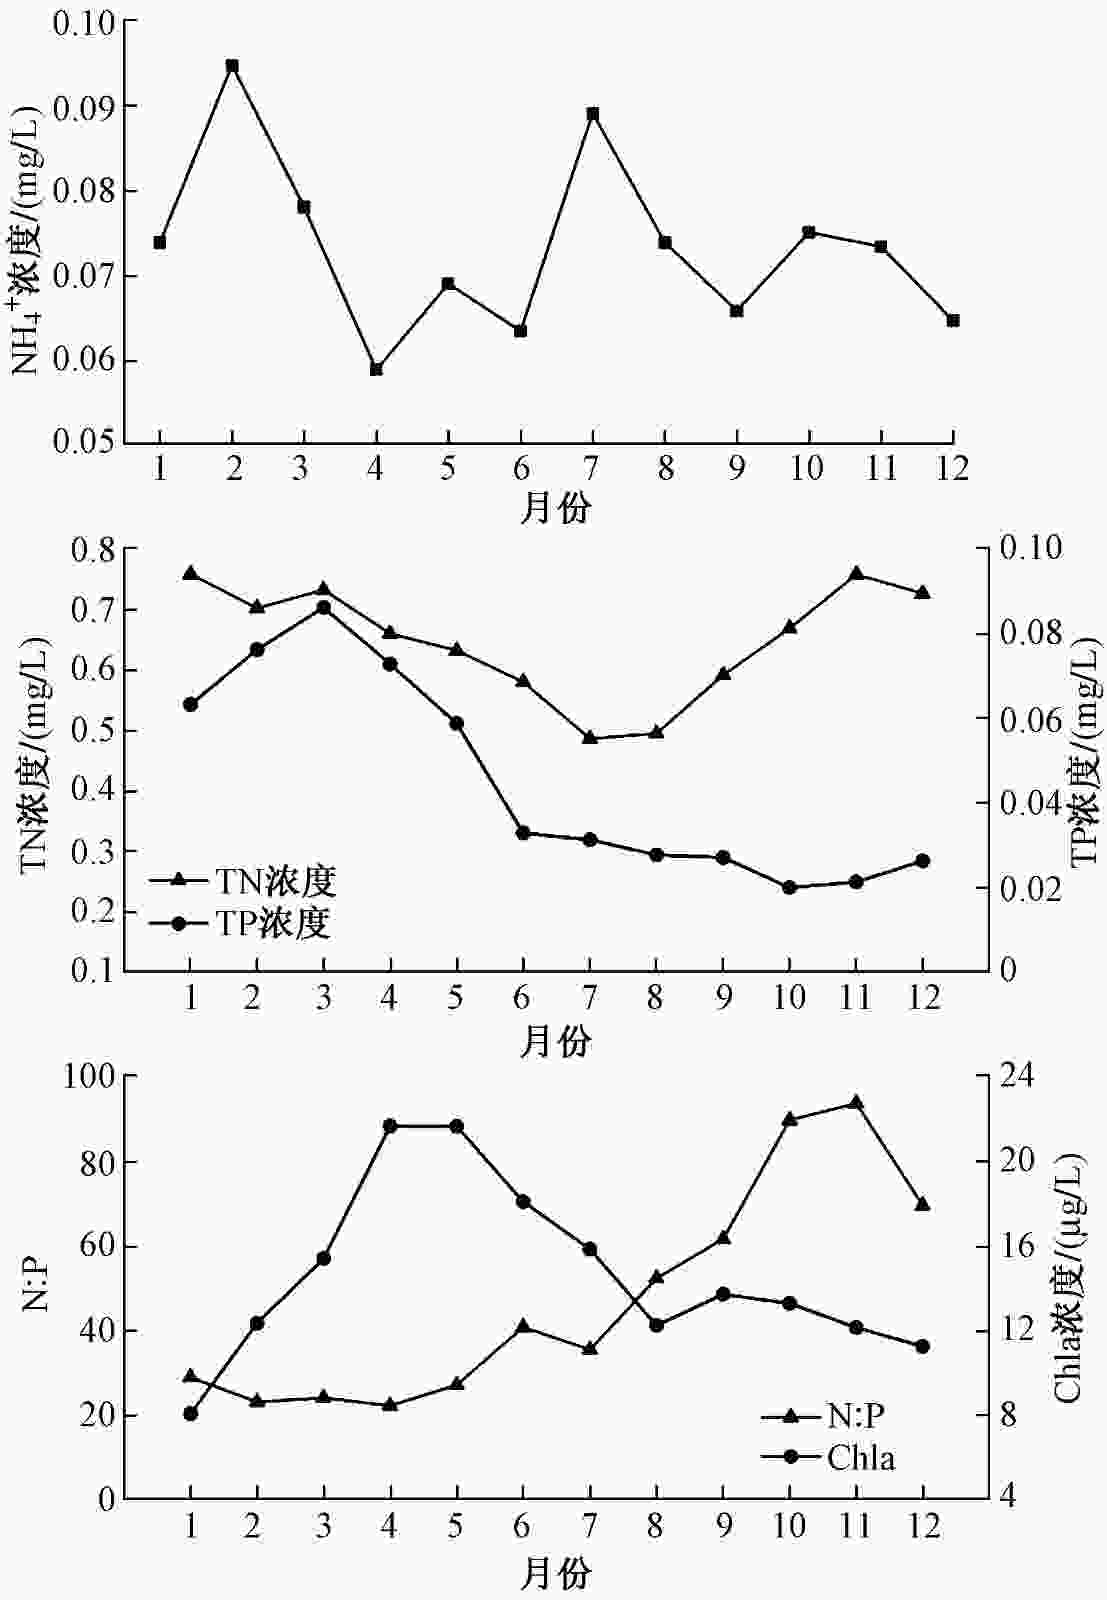
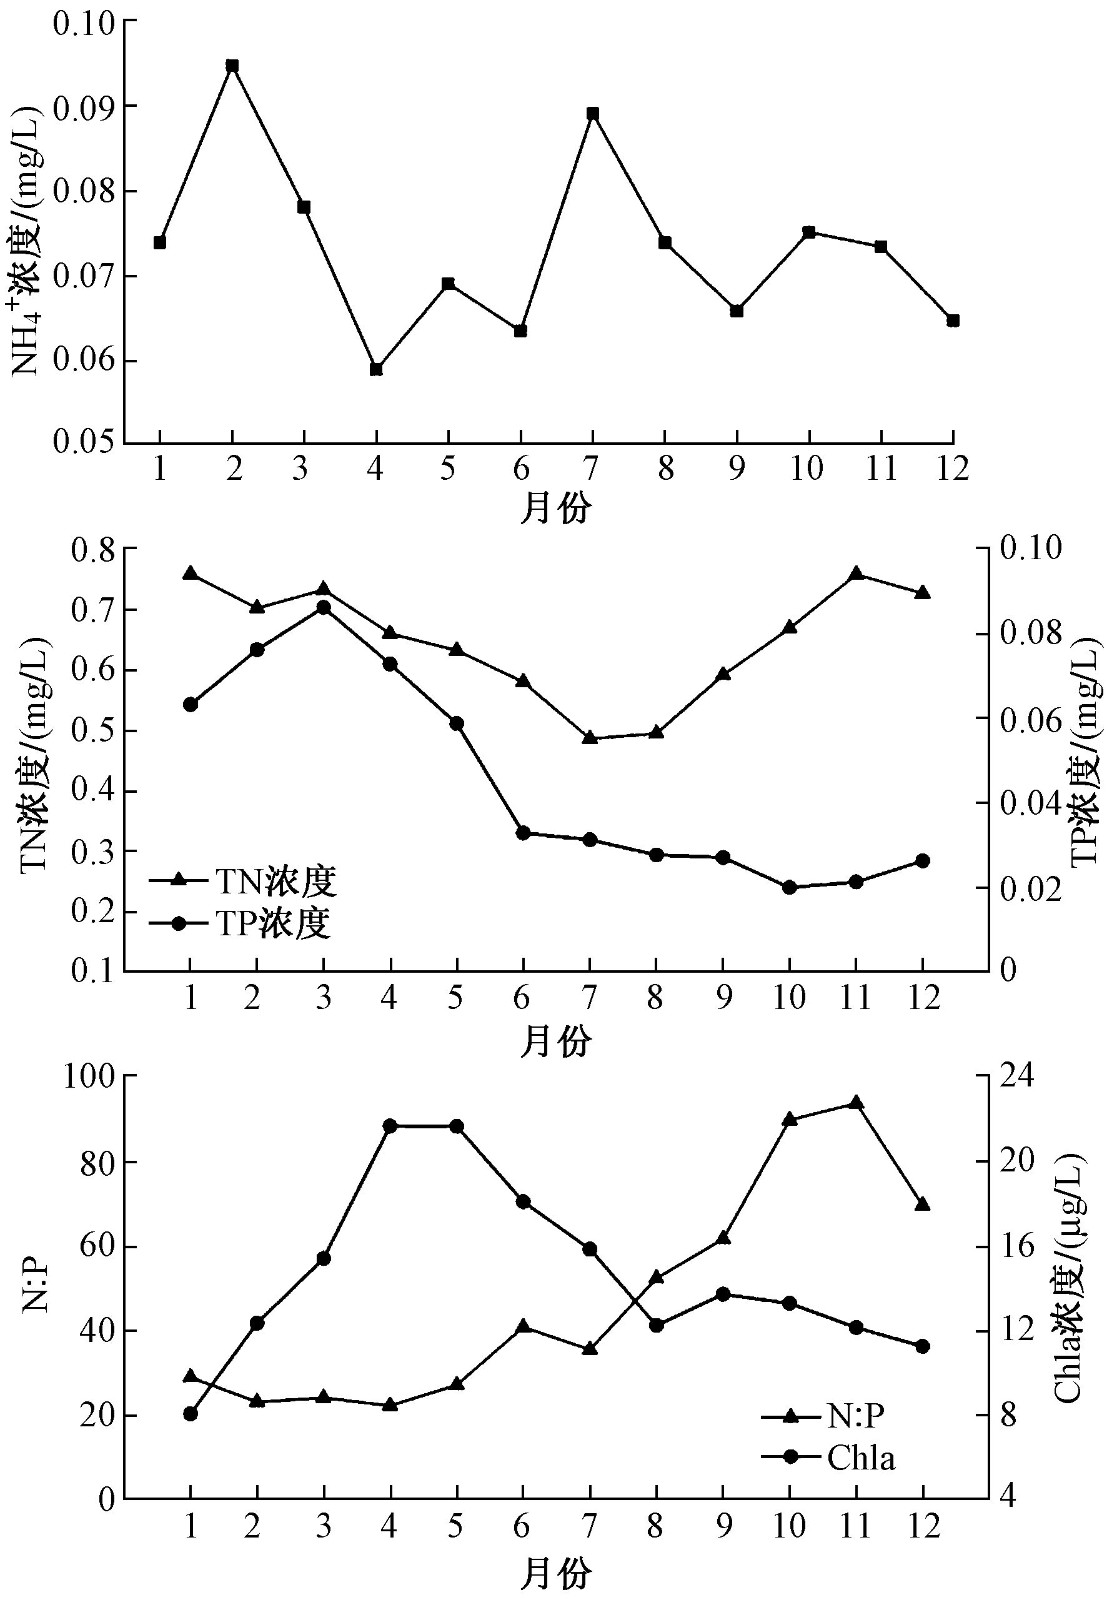
图 2 鲁班水库N、P和Chla浓度的逐月变化特征
Figure 2. Monthly variation characteristics of concentrations of N, P and Chla in Luban Reservoir
表 1 营养状态分级表
Table 1. Trophic state grading list
营养状态分级 TLI(∑) 定性评价 贫营养 0~30 优 中营养 30~50 良好 轻度富营养 50~60 轻度污染 中度富营养 60~70 中度污染 重度富营养 70~100 重度污染  下载: 导出CSV
表 2 2014—2019年鲁班水库各监测点位透明度、CODMn、TN浓度、TP浓度和N:P
Table 2. Transparency, CODMn, TN, TP contents and N:P of 4 sample sites in Luban Reservoir during the period from 2014 to 2019
水化学指标 进水口 鲁班岛 麻雀湾 库尾 透明度/m 1.48±0.46 1.81±0.58 1.63±0.49 1.71±0.55 CODMn/(mg/L) 3.03±1.02 2.56±0.79 2.75±0.88 2.69±0.90 TN浓度/(mg/L) 0.72±0.24 0.59±0.19 0.68±0.23 0.61±0.21 TP浓度/(mg/L) 0.05±0.03 0.04±0.03 0.05±0.04 0.04±0.03 N:P 43±27 51±42 48±43 48±39
下载: 导出CSV
表 3 相关理化参数的Pearson分析结果
Table 3. Pearson correlation coefficient for physiochemical characteristics
项目 水温 pH DO CODMn BOD5 NH4 +-N COD TN TP N:P 透明度 Chla 水温 1 pH 0.468** 1 DO 0.561** 1 CODMn 0.211** 0.646** 0.576** 1 BOD5 0.592** 0.563** 0.795** 1 NH4 +-N −0.123* 1 COD 0.241** 0.486** 0.406** 0.617** 0.469** 1 TN −0.310** −0.234** 0.120* 1 TP −0.503** 0.229** 0.295** 0.337** 0.129* 0.178** 0.190** 1 N:P 0.190** −0.223** −0.320** −0.351** −0.287** −0.296** 0.295** −0.576** 1 透明度 −0.316** −0.291** −0.155** −0.275** −0.189** −0.205** 0.126* 1 Chla 0.376** 0.307** 0.482** 0.378** 0.393** −0.137* 1 注:**表示在0.01级别(双尾)相关性显著;*表示在0.05级别(双尾)相关性显著。
下载: 导出CSV
表 4 鲁班水库水质类别变化
Table 4. Variations of water quality of Luban Reservoir
监测点位 水质类别 2014年 2015年 2016年 2017年 2018年 2019年 进水口 Ⅳ Ⅲ Ⅳ Ⅲ Ⅲ Ⅲ 鲁班岛 Ⅳ Ⅲ Ⅳ Ⅲ Ⅲ Ⅲ 麻雀湾 Ⅳ Ⅲ Ⅲ Ⅲ Ⅲ Ⅲ 库尾 Ⅳ Ⅲ Ⅲ Ⅲ Ⅲ Ⅲ
下载: 导出CSV
表 5 2016—2019年鲁班岛监测点位水体营养状态
Table 5. Water trophic state of the Luban Island section during the period from 2016 to 2019
年份 综合营养状态指数 营养状态分级 2016 44.7 中营养 2017 41.5 中营养 2018 42.3 中营养 2019 42.3 中营养
下载: 导出CSV
-
[1] HAMPEL J J, MCCARTHY M J, GARDNER W S, et al. Nitrification and ammonium dynamics in Taihu Lake, China: seasonal competition for ammonium between nitrifiers and cyanobacteria[J]. Biogeosciences,2018,15(3):733-748. doi: 10.5194/bg-15-733-2018 [2] CHEN X F, JIANG H Y, SUN X, et al. Nitrification and denitrification by algae-attached and free-living microorganisms during a cyanobacterial bloom in Lake Taihu, a shallow Eutrophic Lake in China[J]. Biogeochemistry,2016,131(1/2):135-146. [3] GUO J B, ZHANG C J, ZHENG G C, et al. The establishment of season-specific eutrophication assessment standards for a water-supply reservoir located in Northeast China based on chlorophyll-a levels[J]. Ecological Indicators,2018,85:11-20. doi: 10.1016/j.ecolind.2017.09.056 [4] MCCARTHY M J, LAVRENTYEV P J, YANG L Y, et al. Nitrogen dynamics and microbial food web structure during a summer cyanobacterial bloom in a subtropical, shallow, well-mixed, eutrophic lake (Lake Taihu, China)[J]. Hydrobiologia,2007,581(1):195-207. doi: 10.1007/s10750-006-0496-2 [5] YANG C T, NAN J, YU H Y, et al. Embedded reservoir and constructed wetland for drinking water source protection: effects on nutrient removal and phytoplankton succession[J]. Journal of Environmental Sciences,2020,87:260-271. doi: 10.1016/j.jes.2019.07.005 [6] HUANG J C, ZHANG Y J, ARHONDITSIS G B, et al. The magnitude and drivers of harmful algal blooms in China's lakes and reservoirs: a national-scale characterization[J]. Water Research,2020,181:115902. doi: 10.1016/j.watres.2020.115902 [7] van METER K J, CHOWDHURY S, BYRNES D K, et al. Biogeochemical asynchrony: ecosystem drivers of seasonal concentration regimes across the Great Lakes Basin[J]. Limnology and Oceanography,2020,65(4):848-862. doi: 10.1002/lno.11353 [8] LI Q Q, YU Q B, WANG F, et al. Nitrogen removal in the Chaohu Lake, China: implication in estimating lake N uptake velocity and modelling N removal efficiency of large lakes and reservoirs in the Changjiang River network[J]. Ecological Indicators,2021,124:107353. doi: 10.1016/j.ecolind.2021.107353 [9] KUYPERS M M M, MARCHANT H K, KARTAL B. The microbial nitrogen-cycling network[J]. Nature Reviews Microbiology,2018,16(5):263-276. doi: 10.1038/nrmicro.2018.9 [10] HUANG J C, ZHANG Y J, ARHONDITSIS G B, et al. How successful are the restoration efforts of China's lakes and reservoirs[J]. Environment International,2019,123:96-103. doi: 10.1016/j.envint.2018.11.048 [11] LEACH T H, BEISNER B E, CAREY C C, et al. Patterns and drivers of deep chlorophyll maxima structure in 100 lakes: the relative importance of light and thermal stratification[J]. Limnology and Oceanography,2018,63(2):628-646. doi: 10.1002/lno.10656 [12] 韩雪梅, 富国, 刘庆庆, 等.变权综合营养状态指数(TLICW)评价方法及其在三峡库区支流龙河的应用[J]. 环境工程技术学报,2018,8(6):627-634. doi: 10.3969/j.issn.1674-991X.2018.06.083HAN X M, FU G, LIU Q Q, et al. Changed weight trophic level index method and its application to Longhe tributary of the Three Gorges Reservoir area[J]. Journal of Environmental Engineering Technology,2018,8(6):627-634. doi: 10.3969/j.issn.1674-991X.2018.06.083 [13] 米养民, 罗会刚.鲁班水库水体营养状态[J]. 四川环境,2012,31(4):90-93. doi: 10.3969/j.issn.1001-3644.2012.04.018 [14] KWAK D H, JEON Y T, DUCK HUR Y. Phosphorus fractionation and release characteristics of sediment in the Saemangeum Reservoir for seasonal change[J]. International Journal of Sediment Research,2018,33(3):250-261. doi: 10.1016/j.ijsrc.2018.04.008 [15] WU Z, LIU Y, LIANG Z Y, et al. Internal cycling, not external loading, decides the nutrient limitation in eutrophic lake: a dynamic model with temporal Bayesian hierarchical inference[J]. Water Research,2017,116:231-240. doi: 10.1016/j.watres.2017.03.039 [16] 刘俊, 田学达, 王琳杰, 等.洞庭湖表层沉积物营养盐空间分布及来源解析[J]. 环境工程技术学报,2019,9(6):701-706. doi: 10.12153/j.issn.1674-991X.2019.05.180LIU J, TIAN X D, WANG L J, et al. Spatial distribution and source analysis of surface sediment nutrients in Lake Dongting[J]. Journal of Environmental Engineering Technology,2019,9(6):701-706. doi: 10.12153/j.issn.1674-991X.2019.05.180 [17] MAAVARA T, AKBARZADEH Z, van CAPPELLEN P. Global dam-driven changes to riverine N:P:Si ratios delivered to the coastal ocean[J]. Geophysical Research Letters, 2020, 47(15):doi: 10.1029/2020gl088288. [18] MCCARTHY M J, GARDNER W S, LEHMANN M F, et al. Benthic nitrogen regeneration, fixation, and denitrification in a temperate, eutrophic lake: effects on the nitrogen budget and cyanobacteria blooms[J]. Limnology and Oceanography,2016,61(4):1406-1423. doi: 10.1002/lno.10306 [19] ROLAND F A E, DARCHAMBEAU F, BORGES A V, et al. Denitrification, anaerobic ammonium oxidation, and dissimilatory nitrate reduction to ammonium in an East African Great Lake (Lake Kivu)[J]. Limnology and Oceanography,2018,63(2):687-701. doi: 10.1002/lno.10660 [20] VAROL M. Spatio-temporal changes in surface water quality and sediment phosphorus content of a large reservoir in Turkey[J]. Environmental Pollution,2020,259:113860. doi: 10.1016/j.envpol.2019.113860 [21] VILMIN L, MOGOLLÓN J M, BEUSEN A H W, et al. Forms and subannual variability of nitrogen and phosphorus loading to global river networks over the 20th century[J]. Global and Planetary Change,2018,163:67-85. doi: 10.1016/j.gloplacha.2018.02.007 [22] AKBARZADEH Z, MAAVARA T, SLOWINSKI S, et al. Effects of damming on river nitrogen fluxes: a global analysis[J]. Global Biogeochemical Cycles,2019,33(11):1339-1357. doi: 10.1029/2019GB006222 [23] ANDERSEN I M, WILLIAMSON T J, GONZÁLEZ M J, et al. Nitrate, ammonium, and phosphorus drive seasonal nutrient limitation of chlorophytes, cyanobacteria, and diatoms in a hyper-eutrophic reservoir[J]. Limnology and Oceanography,2020,65(5):962-978. doi: 10.1002/lno.11363 [24] BOTREL M, BRISTOW L A, ALTABET M A, et al. Assimilation and nitrification in pelagic waters: insights using dual nitrate stable isotopes (δ15N, δ18O) in a shallow lake[J]. Biogeochemistry,2017,135(3):221-237. doi: 10.1007/s10533-017-0369-y [25] HOWARTH R W, BILLEN G, SWANEY D, et al. Regional nitrogen budgets and riverine N & P fluxes for the drainages to the North Atlantic Ocean: natural and human influences[J]. Biogeochemistry,1996,35(1):75-139. doi: 10.1007/BF02179825 [26] HARRISON J A, MARANGER R J, ALEXANDER R B, et al. The regional and global significance of nitrogen removal in lakes and reservoirs[J]. Biogeochemistry,2009,93(1/2):143-157. [27] MARCÉ R, ARMENGOL J. Modeling nutrient in-stream processes at the watershed scale using Nutrient Spiralling metrics[J]. Hydrology and Earth System Sciences,2009,13(7):953-967. ⊗ doi: 10.5194/hess-13-953-2009 -

 下载:
下载:

 点击查看大图

计量
- 文章访问数: 281
- HTML全文浏览量: 174
- PDF下载量: 23
- 被引次数: 0