

Influencing factors and scenario analysis of China's CO2 emission of energy consumption
-
摘要:
针对我国2030年碳达峰要求,立足当前经济和能源需求快速发展的现状,选取2000—2020年时间序列数据,采用Tapio脱钩模型,定量分析中国能源消费CO2排放量与经济增长的脱钩状况;建立扩展的STIRPAT模型,探讨中国能源消费CO2排放的影响因素;运用情景分析法对基准情景(S0)、产业结构优化情景(S1)、能源结构优化情景(S2)、多要素优化情景(S3)4种情景下的CO2排放量进行了预测。结果表明:中国能源消费CO2排放量与经济增长之间的脱钩状态总体以弱脱钩为主。人口规模、能源消费结构、第二产业占比、城镇化率、人均GDP、第三产业占比、碳排放强度每变动1%时,分别引起能源消费CO2排放量的2.857%、0.879%、0.836%、0.623%、(0.221+0.011ln A1)%、0.241%、0.132%的变动。基准情景下中国在2030年之前不能实现碳达峰,产业结构优化情景和能源结构优化情景下在2030年实现碳达峰,峰值分别为110.90亿和109.18亿t,多要素优化情景下可以在2030年之前实现碳达峰,峰值为105.03亿t。
Abstract:In view of China's action plan for peak carbon dioxide emission before 2030 and the current rapid development of economic and energy demand, based on the time series data from 2000 to 2020, the Tapio decoupling model was used to quantitatively analyze the decoupling status between CO2 emission of energy consumption and economic growth in China. The expanded STIRPAT model was established, the influencing factors on CO2 emission of energy consumption were analyzed, and the scenario analysis was used to predict CO2 emission of China's energy consumption in the future under four different scenarios: baseline scenario (S0), industrial structure optimization scenario (S1), energy structure optimization scenario (S2) and multi-factor optimization scenario (S3). The results showed that: The decoupling between CO2 emission of energy consumption and economic growth was generally dominated by weak decoupling. It was found that for 1% change in population, energy consumption structure, proportion of the secondary industry, urbanization level, per-capita GDP, proportion of the tertiary industry, and carbon emissions intensity, there was 2.857%, 0.879%, 0.836%, 0.623%, (0.221+0.011ln A1)%, 0.241%, and 0.132% change in CO2 emission, respectively. Under the baseline scenario, the carbon dioxide peak could not be achieved before 2030. Under the industrial structure optimization scenario and the energy structure optimization scenario, China would achieve the peak carbon dioxide emission in 2030, with peaks of 11.090 billion tons and 10.918 billion tons, respectively. Under the multi-factor optimization scenario, the carbon dioxide peak could be achieved before 2030, and the peak would be 10.503 billion tons.
-
Key words:
- energy consumption /
- CO2 emission /
- decoupling effect /
- influencing factors /
- trend prediction
-
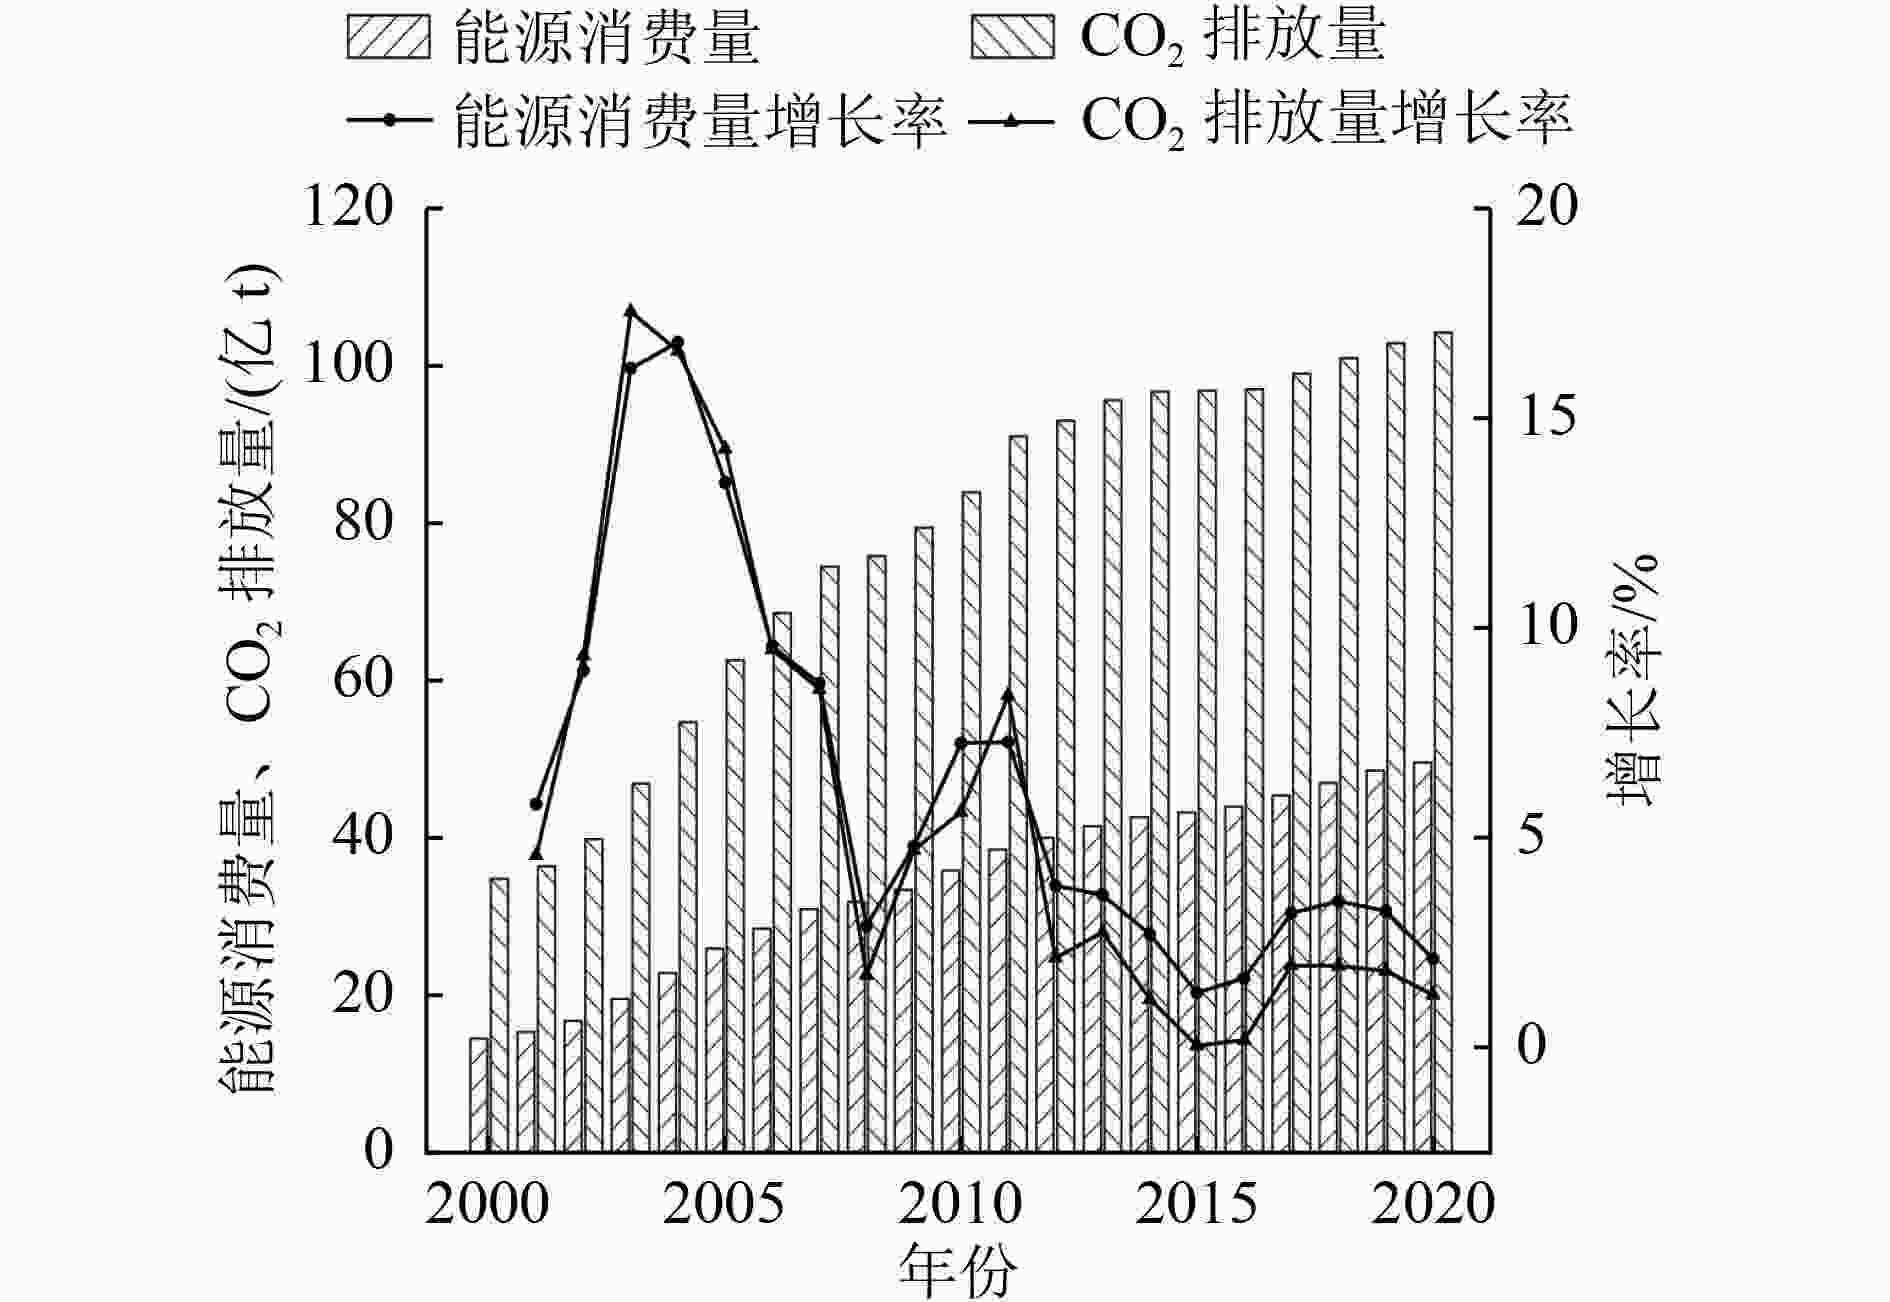
图 1 2000—2020年中国能源消费量和能源消费所产生的CO2排放量变化
Figure 1. Changes in China's energy consumption and CO2 emission of energy consumption from 2000 to 2020
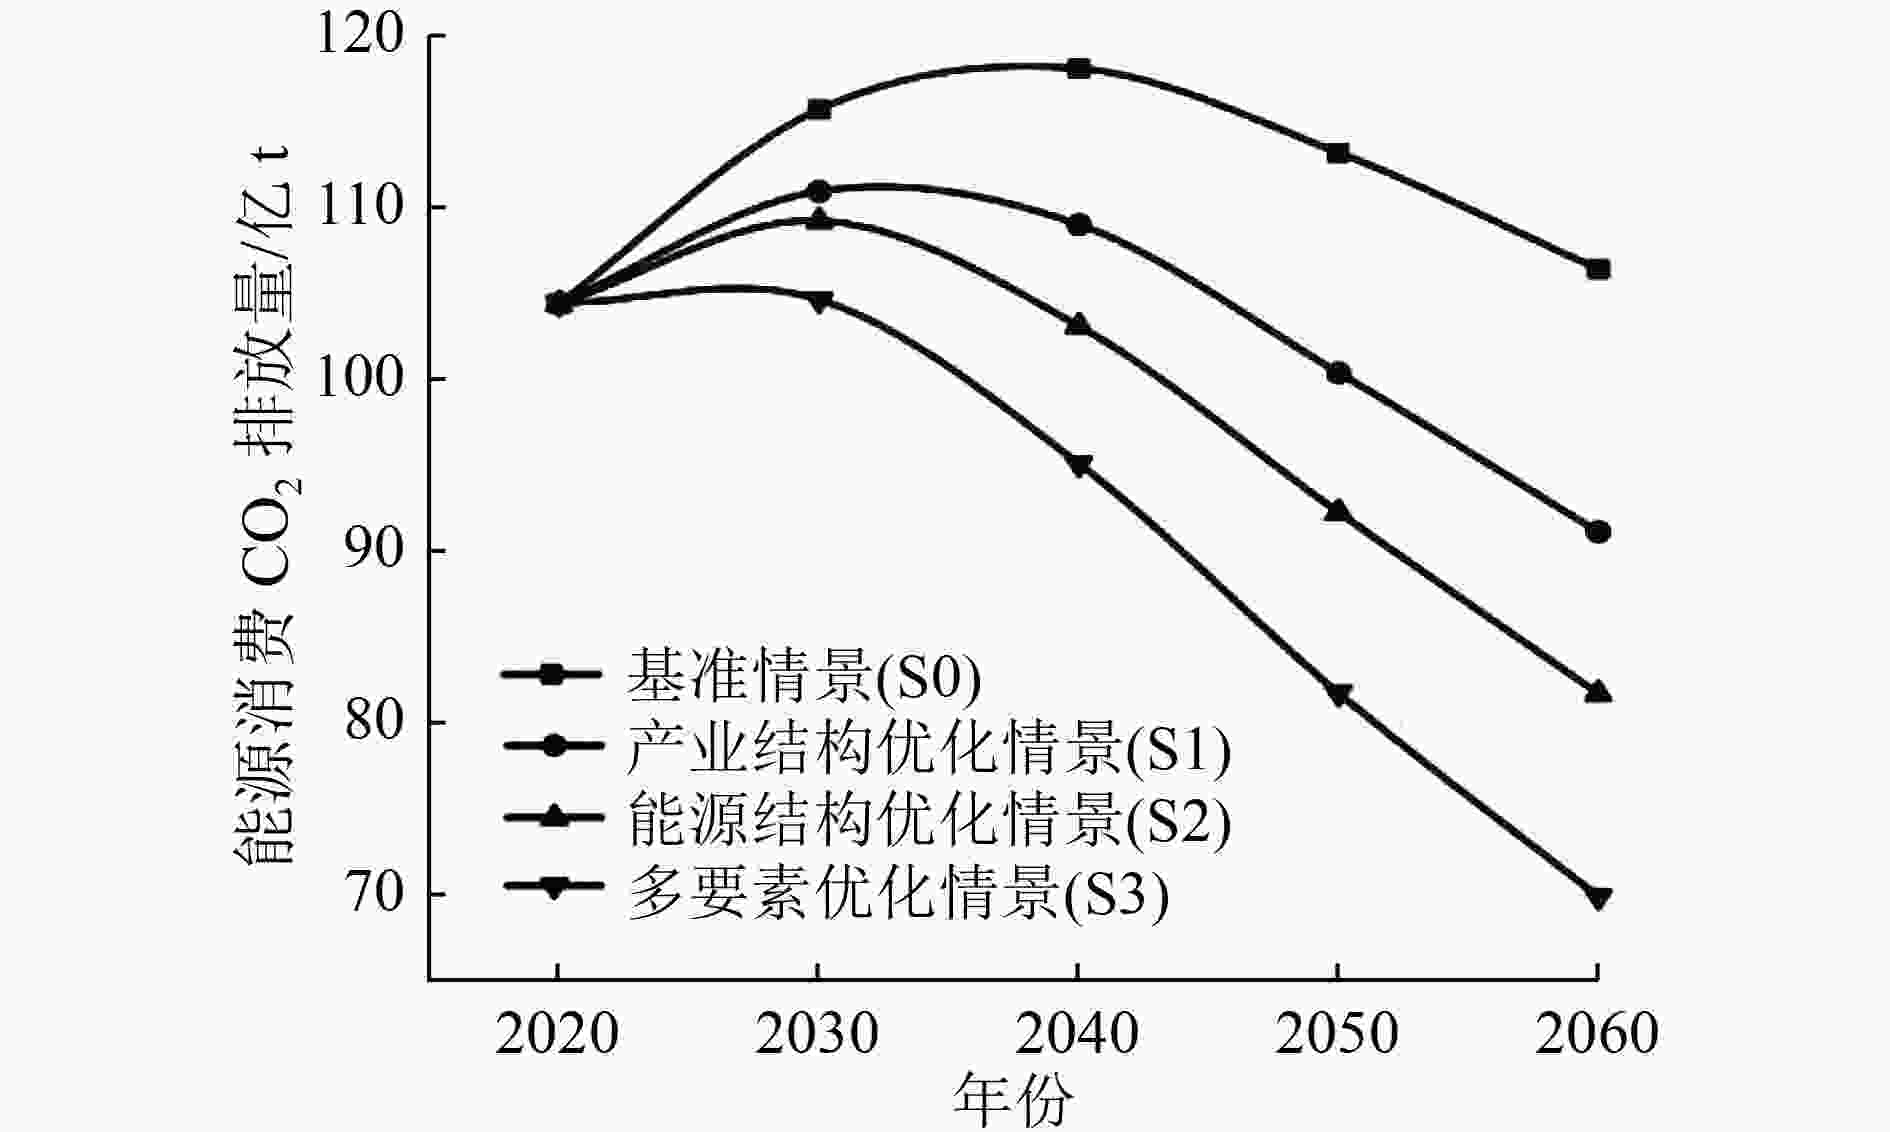
图 2 不同情景下2021—2060年中国能源消费CO2排放量
Figure 2. CO2 emissions from China's energy consumption under different scenarios in 2021-2060
表 1 模型中各变量情况说明
Table 1. Description of each variable in the model
项目 定义 单位 CO2排放量(I) 能源消费所产生的CO2
排放总量亿t 人口要素(P) 人口规模(P1) 年末总人口 万人 城镇化率(P2) 城镇人口占总人口的比例 % 富裕度要素(A) 人均GDP(A1) GDP与年末
总人口的比值元/人 第二产业占比(A2) 第二产业增加值占GDP的比例 % 第三产业占比(A3) 第三产业增加值占GDP 的比例 % 技术要素(T) 碳排放强度(T1) 单位GDP产生的CO2排放量 t/万元 能源消费结构(T2) 煤炭消费量占能源消费
总量的比例%  下载: 导出CSV
表 2 2000—2020年中国能源消费CO2排放量与经济增长的脱钩关系
Table 2. Decoupling relationship between CO2 emission of China's energy consumption and economic growth from 2000 to 2020
年份 (It−It−1) /It−1 (GDPt−GDPt−1) /
GDPt−1e 脱钩关系 2000—2001 0.046 0.083 0.554 弱脱钩 2001—2002 0.094 0.091 1.027 增长连结 2002—2003 0.176 0.100 1.750 扩张型负脱钩 2003—2004 0.166 0.101 1.645 扩张型负脱钩 2004—2005 0.143 0.114 1.256 扩张型负脱钩 2005—2006 0.095 0.127 0.749 弱脱钩 2006—2007 0.086 0.142 0.603 弱脱钩 2007—2008 0.018 0.097 0.184 弱脱钩 2008—2009 0.047 0.094 0.505 弱脱钩 2009—2010 0.057 0.106 0.532 弱脱钩 2010—2011 0.084 0.096 0.884 增长连结 2011—2012 0.022 0.079 0.277 弱脱钩 2012—2013 0.028 0.078 0.359 弱脱钩 2013—2014 0.012 0.074 0.160 弱脱钩 2014—2015 0.001 0.070 0.013 强脱钩 2015—2016 0.002 0.068 0.032 弱脱钩 2016—2017 0.020 0.069 0.288 弱脱钩 2017—2018 0.020 0.068 0.294 弱脱钩 2018—2019 0.020 0.059 0.336 弱脱钩 2019—2020 0.012 0.023 0.502 弱脱钩 2000—2020 1.982 4.282 0.463 弱脱钩
下载: 导出CSV
表 3 岭回归估计结果
Table 3. Estimated results by Ridge regression
变量 系数 标准误差 标准系数 t统计值 常数 −43.001 2.152 0.000 −19.979 ln P1 2.857 0.144 0.276 19.873 ln P2 0.623 0.027 0.307 22.815 ln A1 0.221 0.009 0.314 24.690 (ln A1)2 0.011 0.000 0.301 24.124 ln A2 0.836 0.135 0.173 6.213 ln A3 0.241 0.072 0.071 3.328 ln T1 0.132 0.047 0.084 2.776 ln T2 0.879 0.137 0.190 6.421 R2 0.990 F 155.399 Sig F 0.000
下载: 导出CSV
表 4 模型中各要素的情景参数设定
Table 4. Scenario parameter setting of factors affecting CO2 emission in the model
% 要素 变化率 2021—
2030年2031—
2040年2041—
2050年2051—
2060年人口规模 中 0.30 0.00 −0.10 −0.15 城镇化率 中 1.20 0.80 0.50 0.20 人均GDP 中 7.00 5.00 3.00 2.00 第二产业占比 中 −2.50 −2.00 −1.50 −1.00 高 −3.00 −2.50 −2.00 −1.50 第三产业占比 中 2.00 1.00 0.50 0.20 高 2.00 1.20 0.60 0.50 碳排放强度 中 −2.50 −2.00 −1.50 −1.00 高 −3.50 −2.50 −2.00 −1.50 能源消费结构 中 −2.00 −1.00 −0.60 −0.40 高 −2.50 −1.80 −1.30 −1.00
下载: 导出CSV
-
[1] SHI B B, WU L, KANG R. Clean development, energy substitution, and carbon emissions: evidence from clean development mechanism (CDM) project implementation in China[J]. Sustainability,2021,13(2):860. doi: 10.3390/su13020860 [2] IPCC. AR5 synthesis report: climate change 2014[EB/OL]. [2021-10-08]. https://www.ipcc.ch/report/ar5/syr/. [3] BP公司. BP世界能源统计年鉴[R]. 北京: BP公司, 2020. [4] 全球实时碳数据[EB/OL]. [2021-10-08]. http://carbonmonitor.org.cn/. [5] PATA U K. Renewable and non-renewable energy consumption, economic complexity, CO2 emissions, and ecological footprint in the USA: testing the EKC hypothesis with a structural break[J]. Environmental Science and Pollution Research,2021,28(1):846-861. doi: 10.1007/s11356-020-10446-3 [6] YAO S J, ZHANG S, ZHANG X M. Renewable energy, carbon emission and economic growth: a revised environmental Kuznets Curve perspective[J]. Journal of Cleaner Production,2019,235:1338-1352. [7] SUN Y, LI M X, ZHANG M J, et al. A study on China's economic growth, green energy technology, and carbon emissions based on the Kuznets curve (EKC)[J]. Environmental Science and Pollution Research International,2021,28(6):7200-7211. doi: 10.1007/s11356-020-11019-0 [8] 宋晓晖, 张裕芬, 汪艺梅, 等.基于IPAT扩展模型分析人口因素对碳排放的影响[J]. 环境科学研究,2012,25(1):109-115.SONG X H, ZHANG Y F, WANG Y M, et al. Analysis of impacts of demographic factors on carbon emissions based on the IPAT model[J]. Research of Environmental Sciences,2012,25(1):109-115. [9] WANG C J, WANG F, ZHANG X L, et al. Examining the driving factors of energy related carbon emissions using the extended STIRPAT model based on IPAT identity in Xinjiang[J]. Renewable and Sustainable Energy Reviews,2017,67:51-61. doi: 10.1016/j.rser.2016.09.006 [10] SHAN X, SHAO H W. The scenario analysis of carbon emissions based on improved IPAT model in China[J]. Advanced Materials Research,2012,616/617/618:1484-1489. [11] 黄蕊, 王铮, 丁冠群, 等.基于STIRPAT模型的江苏省能源消费碳排放影响因素分析及趋势预测[J]. 地理研究,2016,35(4):781-789.HUANG R, WANG Z, DING G Q, et al. Trend prediction and analysis of influencing factors of carbon emissions from energy consumption in Jiangsu Province based on STIRPAT model[J]. Geographical Research,2016,35(4):781-789. [12] NOSHEEN M, ABBASI M A, IQBAL J. Analyzing extended STIRPAT model of urbanization and CO2 emissions in Asian countries[J]. Environmental Science and Pollution Research International,2020,27(36):45911-45924. doi: 10.1007/s11356-020-10276-3 [13] XIONG C H, CHEN S, XU L T. Driving factors analysis of agricultural carbon emissions based on extended STIRPAT model of Jiangsu Province, China[J]. Growth and Change,2020,51(3):1401-1416. doi: 10.1111/grow.12384 [14] ZHANG Y L, ZHANG Q Y, PAN B B. Impact of affluence and fossil energy on China carbon emissions using STIRPAT model[J]. Environmental Science and Pollution Research,2019,26(18):18814-18824. doi: 10.1007/s11356-019-04950-4 [15] LIU S X, PENG B, LIU Q, et al. Economic-related CO2 emissions analysis of Ordos Basin based on a refined STIRPAT model[J]. Greenhouse Gases: Science and Technology,2019,9(5):1064-1080. doi: 10.1002/ghg.1920 [16] ZHANG S C, ZHAO T. Identifying major influencing factors of CO2 emissions in China: regional disparities analysis based on STIRPAT model from 1996 to 2015[J]. Atmospheric Environment,2019,207:136-147. [17] YANG P G, LIANG X A, DROHAN P J. Using Kaya and LMDI models to analyze carbon emissions from the energy consumption in China[J]. Environmental Science and Pollution Research International,2020,27(21):26495-26501. doi: 10.1007/s11356-020-09075-7 [18] WANG W W, ZHANG M, ZHOU M. Using LMDI method to analyze transport sector CO2 emissions in China[J]. Energy,2011,36(10):5909-5915. [19] LIU L C, FAN Y, WU G, et al. Using LMDI method to analyze the change of China's industrial CO2 emissions from final fuel use: an empirical analysis[J]. Energy Policy,2007,35(11):5892-5900. [20] YIN L B, LIU G C, ZHOU J L, et al. A calculation method for CO2 emission in utility boilers based on BP neural network and carbon balance[J]. Energy Procedia,2017,105:3173-3178. doi: 10.1016/j.egypro.2017.03.690 [21] WEN L, LIU Y J. A research about Beijing's carbon emissions based on the IPSO-BP model[J]. Environmental Progress & Sustainable Energy,2017,36(2):428-434. [22] DAI S Y, NIU D X, HAN Y R. Forecasting of energy-related CO2 emissions in China based on GM(1, 1) and least squares support vector machine optimized by modified shuffled frog leaping algorithm for sustainability[J]. Sustainability,2018,10(4):958. doi: 10.3390/su10040958 [23] HUANG D, HAN M, JIANG Y T. Research on freight transportation carbon emission reduction based on system dynamics[J]. Applied Sciences,2021,11(5):2041. doi: 10.3390/app11052041 [24] LIU D N, XIAO B W. Can China achieve its carbon emission peaking: a scenario analysis based on STIRPAT and system dynamics model[J]. Ecological Indicators,2018,93:647-657. doi: 10.1016/j.ecolind.2018.05.049 [25] 孔佑花, 王丽, 郭志玲, 等.基于系统动力学的甘肃省碳排放峰值预测[J]. 环境工程技术学报,2018,8(3):309-318.KONG Y H, WANG L, GUO Z L, et al. Carbon emissions peak prediction in Gansu Province based on system dynamics[J]. Journal of Environmental Engineering Technology,2018,8(3):309-318. [26] DUAN H Y, ZHANG S P, DUAN S Y, et al. Carbon emissions peak prediction and the reduction pathway in buildings during operation in Jilin Province based on LEAP[J]. Sustainability,2019,11(17):4540. [27] MA Z, WANG Y X, DUAN H Y, et al. Study on the passenger transportation energy demand and carbon emission of Jilin Province based on LEAP model[J]. Advanced Materials Research, 2012, 518/519/520/521/522/523: 2243-2246. [28] 王永刚, 王旭, 孙长虹, 等.IPAT及其扩展模型的应用研究进展[J]. 应用生态学报,2015,26(3):949-957.WANG Y G, WANG X, SUN C H, et al. Research progress on the application of IPAT model and its variants[J]. Chinese Journal of Applied Ecology,2015,26(3):949-957. [29] 中国可持续发展能源暨碳排放情景分析[R]. 北京: 国家发展和改革委员会能源研究所, 2003. [30] 张型芳, 罗宏, 吕连宏.碳排放与经济增长的协调性分析[J]. 环境工程技术学报,2017,7(4):517-524. doi: 10.3969/j.issn.1674-991X.2017.04.071ZHANG X F, LUO H, LÜ L H. Coordination analysis on carbon emission and economic growth[J]. Journal of Environmental Engineering Technology,2017,7(4):517-524. doi: 10.3969/j.issn.1674-991X.2017.04.071 [31] TAPIO P. Towards a theory of decoupling: degrees of decoupling in the EU and the case of road traffic in Finland between 1970 and 2001[J]. Transport Policy,2005,12(2):137-151. doi: 10.1016/j.tranpol.2005.01.001 [32] EHRLICH P R, HOLDREN J P. Impact of population growth[J]. Science,1971,171:1212-1217. doi: 10.1126/science.171.3977.1212 [33] DIETZ T, ROSA E A. Effects of population and affluence on CO2 emissions[J]. Proceedings of the National Academy of Sciences of the United States of America,1997,94(1):175-179. doi: 10.1073/pnas.94.1.175 [34] YORK R, ROSA E A, DIETZ T. STIRPAT, IPAT and ImPACT: analytic tools for unpacking the driving forces of environmental impacts[J]. Ecological Economics,2003,46(3):351-365. [35] 国家统计局. 国家数据[EB/OL]. [2021-08-21]. https://data.stats.gov.cn/. [36] 杨子晖.经济增长、能源消费与二氧化碳排放的动态关系研究[J]. 世界经济,2011,34(6):100-125. [37] 彭希哲, 朱勤.我国人口态势与消费模式对碳排放的影响分析[J]. 人口研究,2010,34(1):48-58.PENG X Z, ZHU Q. Impacts of population dynamics and consumption pattern on carbon emission in China[J]. Population Research,2010,34(1):48-58. [38] 黄蕊, 王铮.基于STIRPAT模型的重庆市能源消费碳排放影响因素研究[J]. 环境科学学报,2013,33(2):602-608.HUANG R, WANG Z. Influencing factors of carbon emissions from energy consumptions in Chongqing based on STIRPAT model[J]. Acta Scientiae Circumstantiae,2013,33(2):602-608. [39] 李宁, 白璐, 乔琦, 等.天山北坡经济带经济发展与污染减排潜力以及工业绿色发展策略[J]. 环境科学研究,2020,33(2):503-510.LI N, BAI L, QIAO Q, et al. Economic development, emission reduction potential, and strategy analysis of industrial green developmentin northern Tianshan Mountain economic zone[J]. Research of Environmental Sciences,2020,33(2):503-510. [40] 张兵兵, 徐康宁, 陈庭强.技术进步对二氧化碳排放强度的影响研究[J]. 资源科学,2014,36(3):567-576.ZHANG B B, XU K N, CHEN T Q. The influence of technical progress on carbon dioxide emission intensity[J]. Resources Science,2014,36(3):567-576. [41] 赵雲泰, 黄贤金, 钟太洋, 等.1999—2007年中国能源消费碳排放强度空间演变特征[J]. 环境科学,2011,32(11):3145-3152.ZHAO Y T, HUANG X J, ZHONG T Y, et al. Spatial pattern evolution of carbon emission intensity from energy consumption in China[J]. Environmental Science,2011,32(11):3145-3152. [42] LI Z, LI Y B, SHAO S S. Analysis of influencing factors and trend forecast of carbon emission from energy consumption in China based on expanded STIRPAT model[J]. Energies,2019,12(16):3054. doi: 10.3390/en12163054 [43] 马晓钰, 李强谊, 郭莹莹.我国人口因素对二氧化碳排放的影响: 基于STIRPAT模型的分析[J]. 人口与经济,2013(1):44-51.MA X Y, LI Q Y, GUO Y Y. The impact of population on carbon dioxide emissions in China: an analysis based on STIRPAT model[J]. Population & Economics,2013(1):44-51. [44] 朱勤, 彭希哲, 陆志明, 等.人口与消费对碳排放影响的分析模型与实证[J]. 中国人口·资源与环境,2010,20(2):98-102. doi: 10.3969/j.issn.1002-2104.2010.02.017ZHU Q, PENG X Z, LU Z M, et al. Analysis model and empirical study of impacts from population and consumption on carbon emissions[J]. China Population Resources and Environment,2010,20(2):98-102. □ doi: 10.3969/j.issn.1002-2104.2010.02.017 -

 下载:
下载:


 点击查看大图

计量
- 文章访问数: 424
- HTML全文浏览量: 177
- PDF下载量: 63
- 被引次数: 0