

Analysis of thermal environment effect and its influencing factors in the main urban area of Kunming
-
摘要:
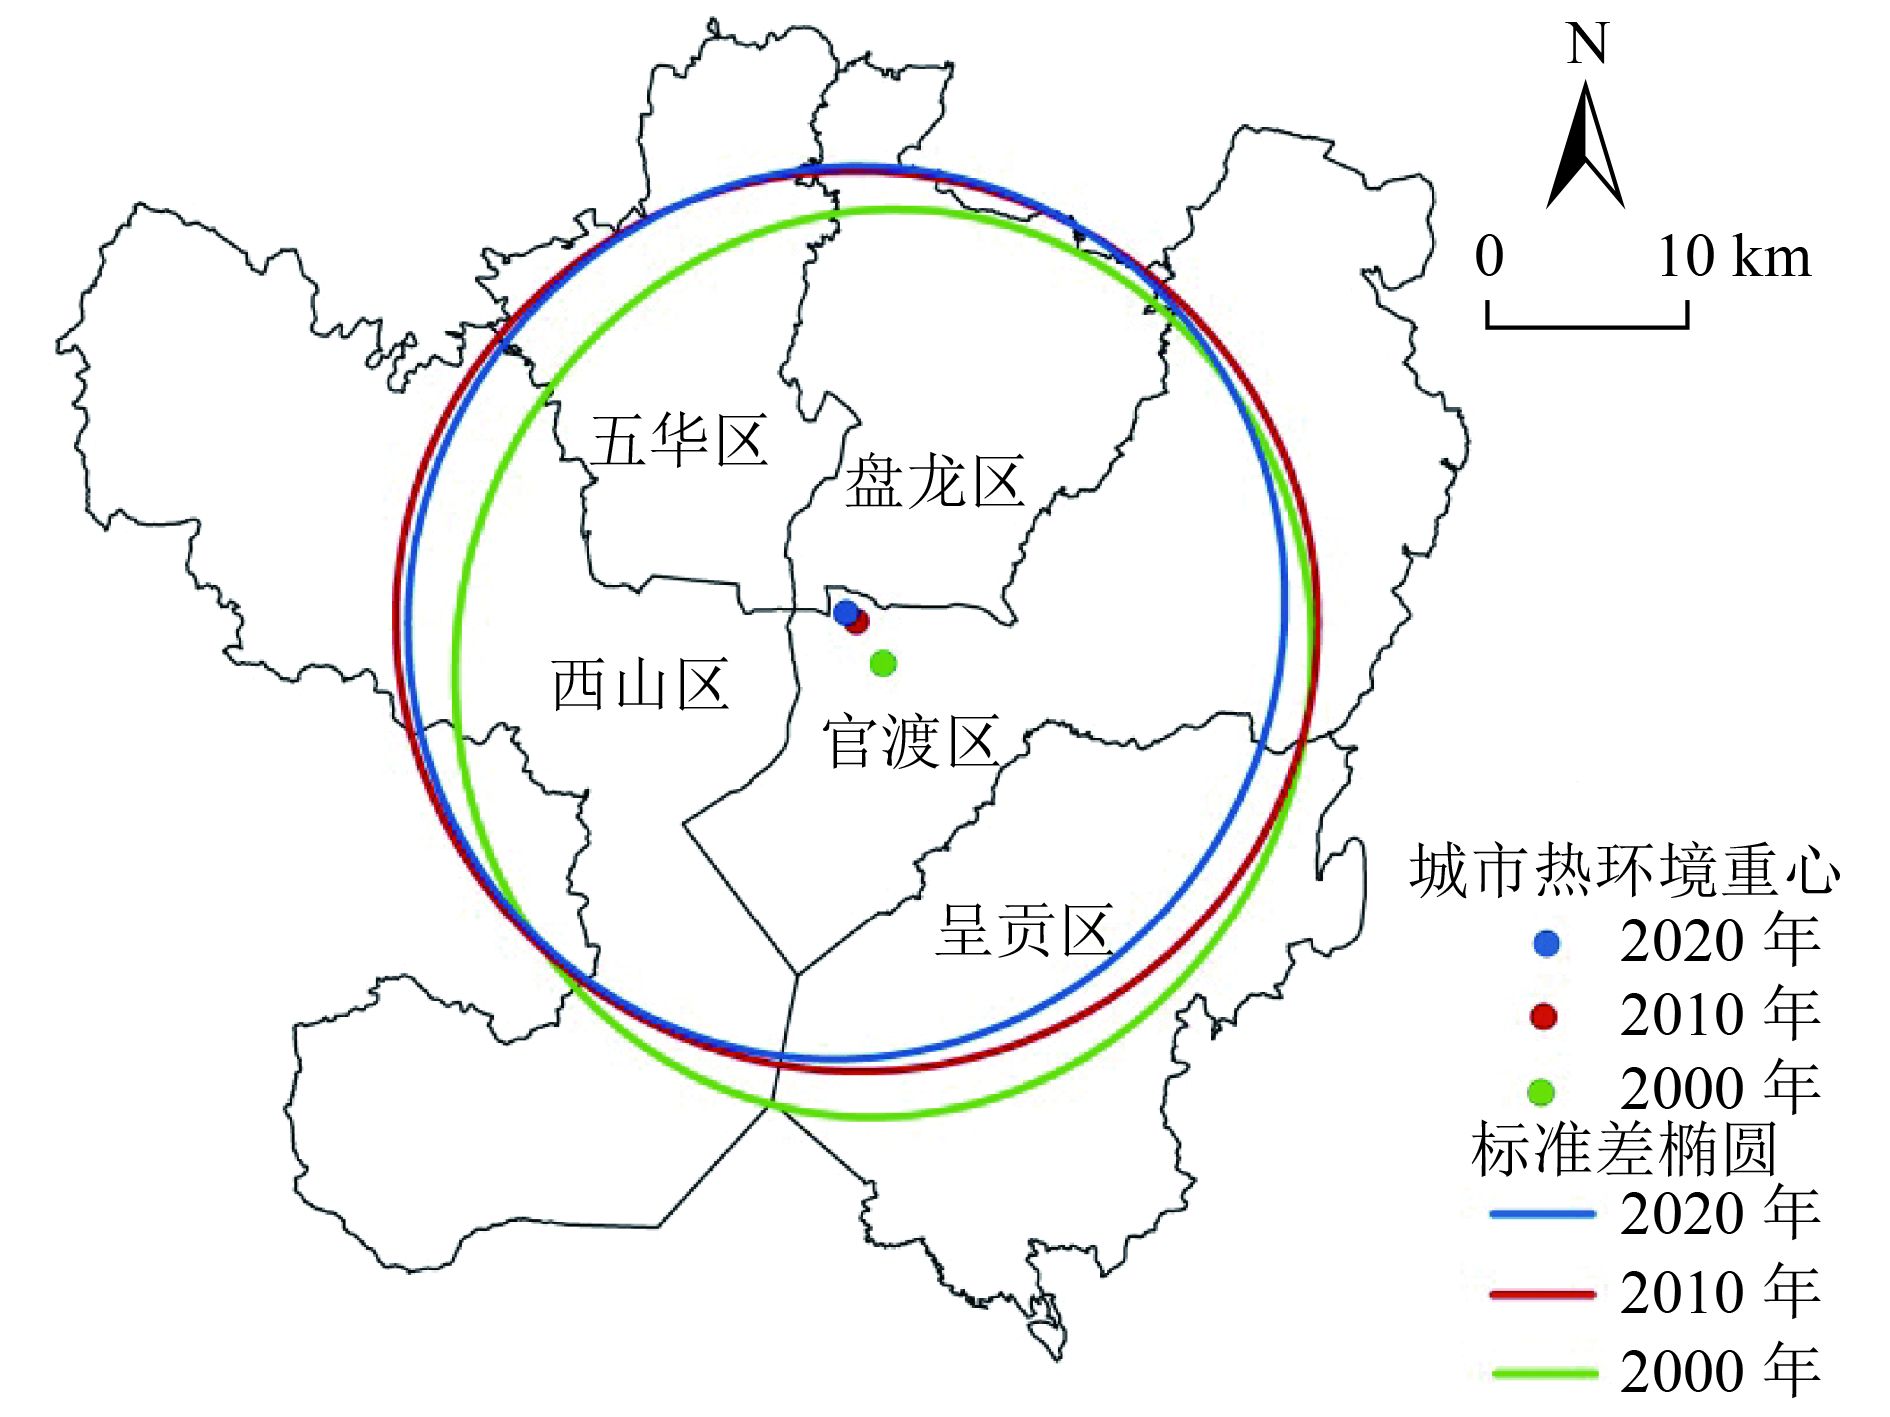
以昆明市主城区为研究对象,根据2000年、2010年和2020年3期Landsat TM/OLI遥感影像,反演3个时期的地表温度,采用标准差椭圆分析热环境效应的时空演变,并使用地理探测器探讨热环境效应的影响因素。结果表明:近20 年来,昆明市主城区热岛区集中分布在城镇建设密集区域,热环境方向主轴由东北—西南走向转为西北—东南走向;前期热环境重心向西北方向偏转了57.5°,偏移2.47 km,后期向西北方向偏转24.25°,偏移0.86 km;有极低温区向低温区、较低温区转变,较高温区与高温区向极高温区转变的态势,其中,官渡区的热环境效应增强趋势最显著;建筑用地和植被覆盖度对地表温度产生的影响力最大,建筑用地与高程交互作用时会增加对地表温度的影响力,水体与建筑用地或不透水面的交互作用减弱了水体对热环境效应的缓解作用。
Abstract:Taking the main urban area of Kunming as the research object, based on LandsatTM/OLI remote sensing images of three periods in 2000, 2010 and 2020, the surface temperatures in three periods were inversed. The temporal and spatial evolution of the thermal environment effect was analyzed with the standard deviation ellipse, and the influencing factors of thermal environment effect were discussed by the geographic detector. The results showed that in the recent 20 years, the heat island areas in the main urban area of Kunming had been concentrated in those with intensive urban construction, and the main axis of the thermal environment direction had changed from northeast-southwest to northwest-southeast. In the early stage, the center of the thermal environment deflected 57.5° to the northwest and shifted by 2.47 km, and in the later stage, deflected 24.25° to the northwest and shifted by 0.86 km. There was a trend of transition from extremely low-temperature zone to low-temperature zone and relatively low-temperature zone, and from relatively high-temperature zone and high-temperature zone to extremely high-temperature zone. Among them, the enhancement trend of the thermal environment effect in Guandu District was the most significant. The building lot and fractional vegetation cover (FVC) had the greatest influence on the surface temperature. The influence on the surface temperature would be increased when the interaction between building lot and elevation. And the interaction between water and building lot or impermeable surface would weaken the mitigation effect of water on the thermal environment effect.
-
Key words:
- thermal environment effect /
- surface temperature /
- geodetector /
- impact factor /
- Kunming City
-
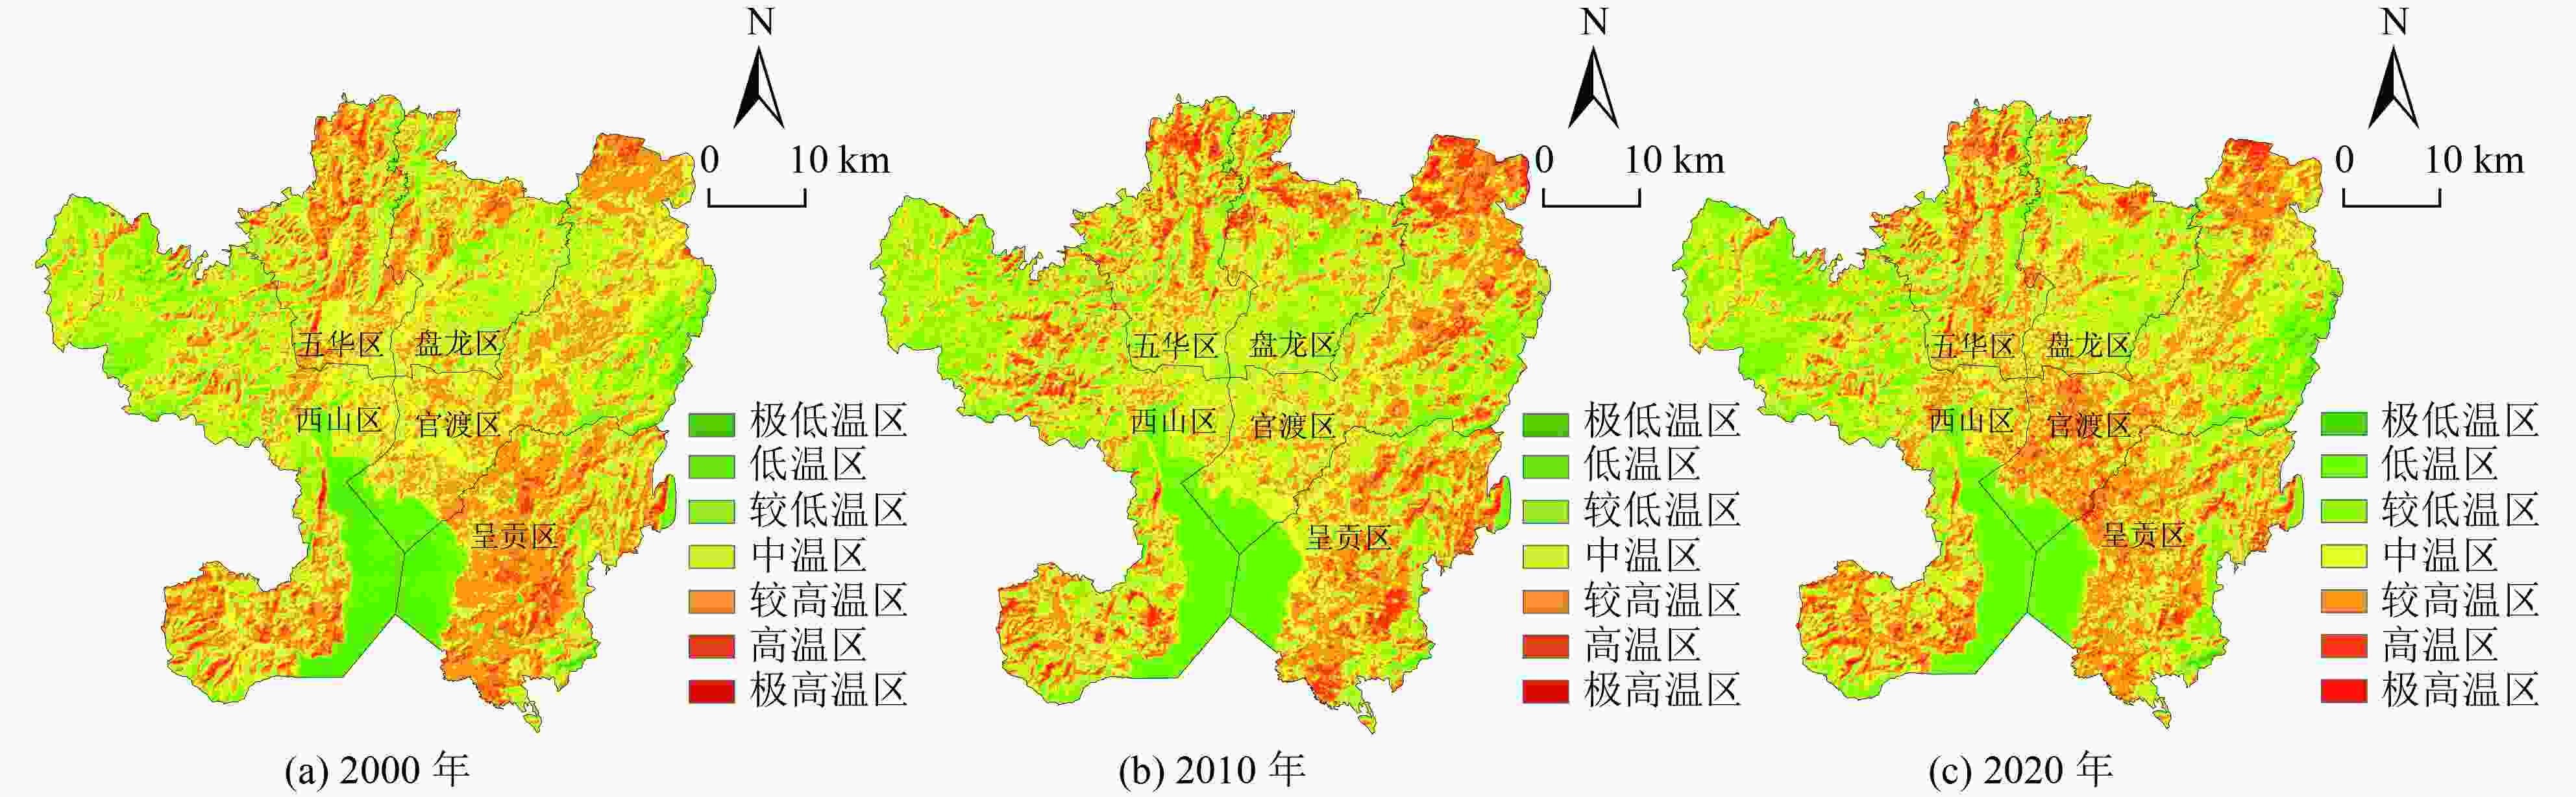
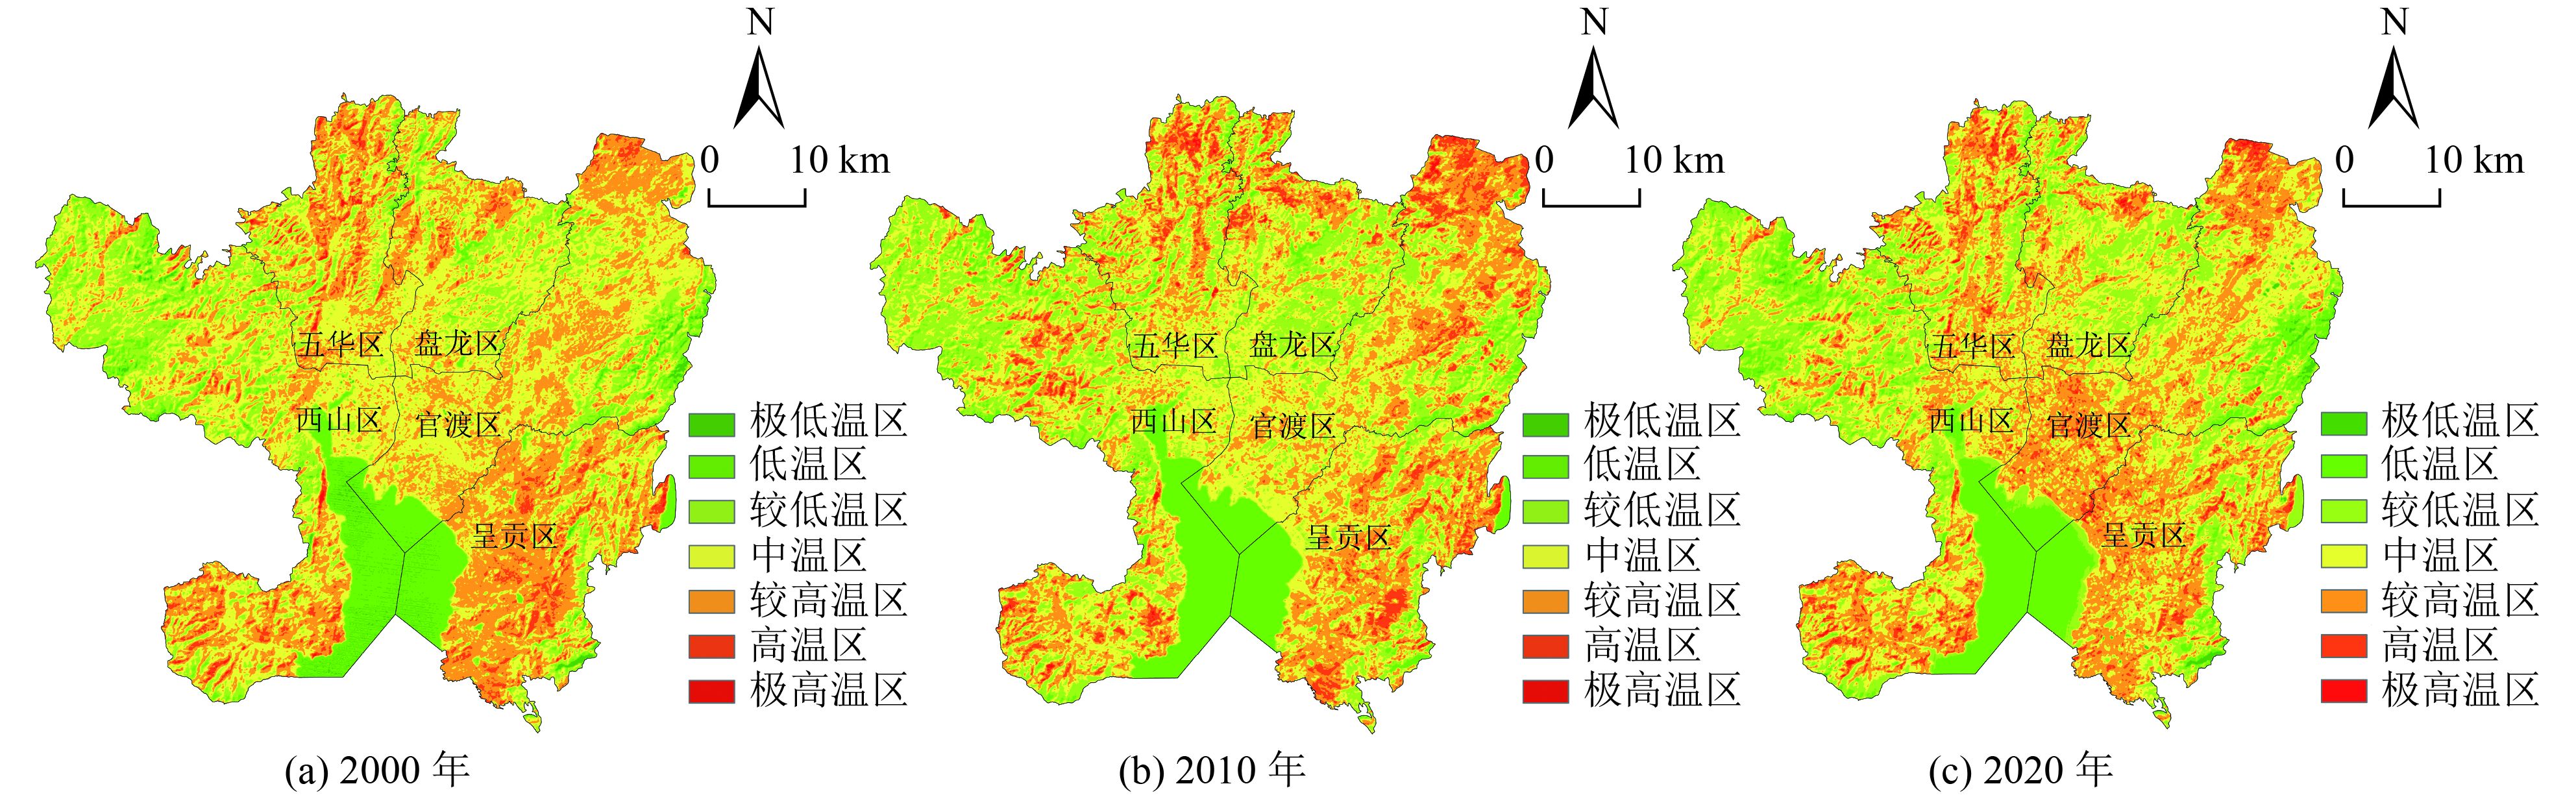
图 2 昆明市主城区地表温度等级
Figure 2. Surface temperature grade of the main urban area of Kunming

图 3 2000—2020年昆明主城区热环境方向变化与重心迁移
Figure 3. Change of thermal environment direction and migration of center in the main urban area of Kunming from 2000 to 2020

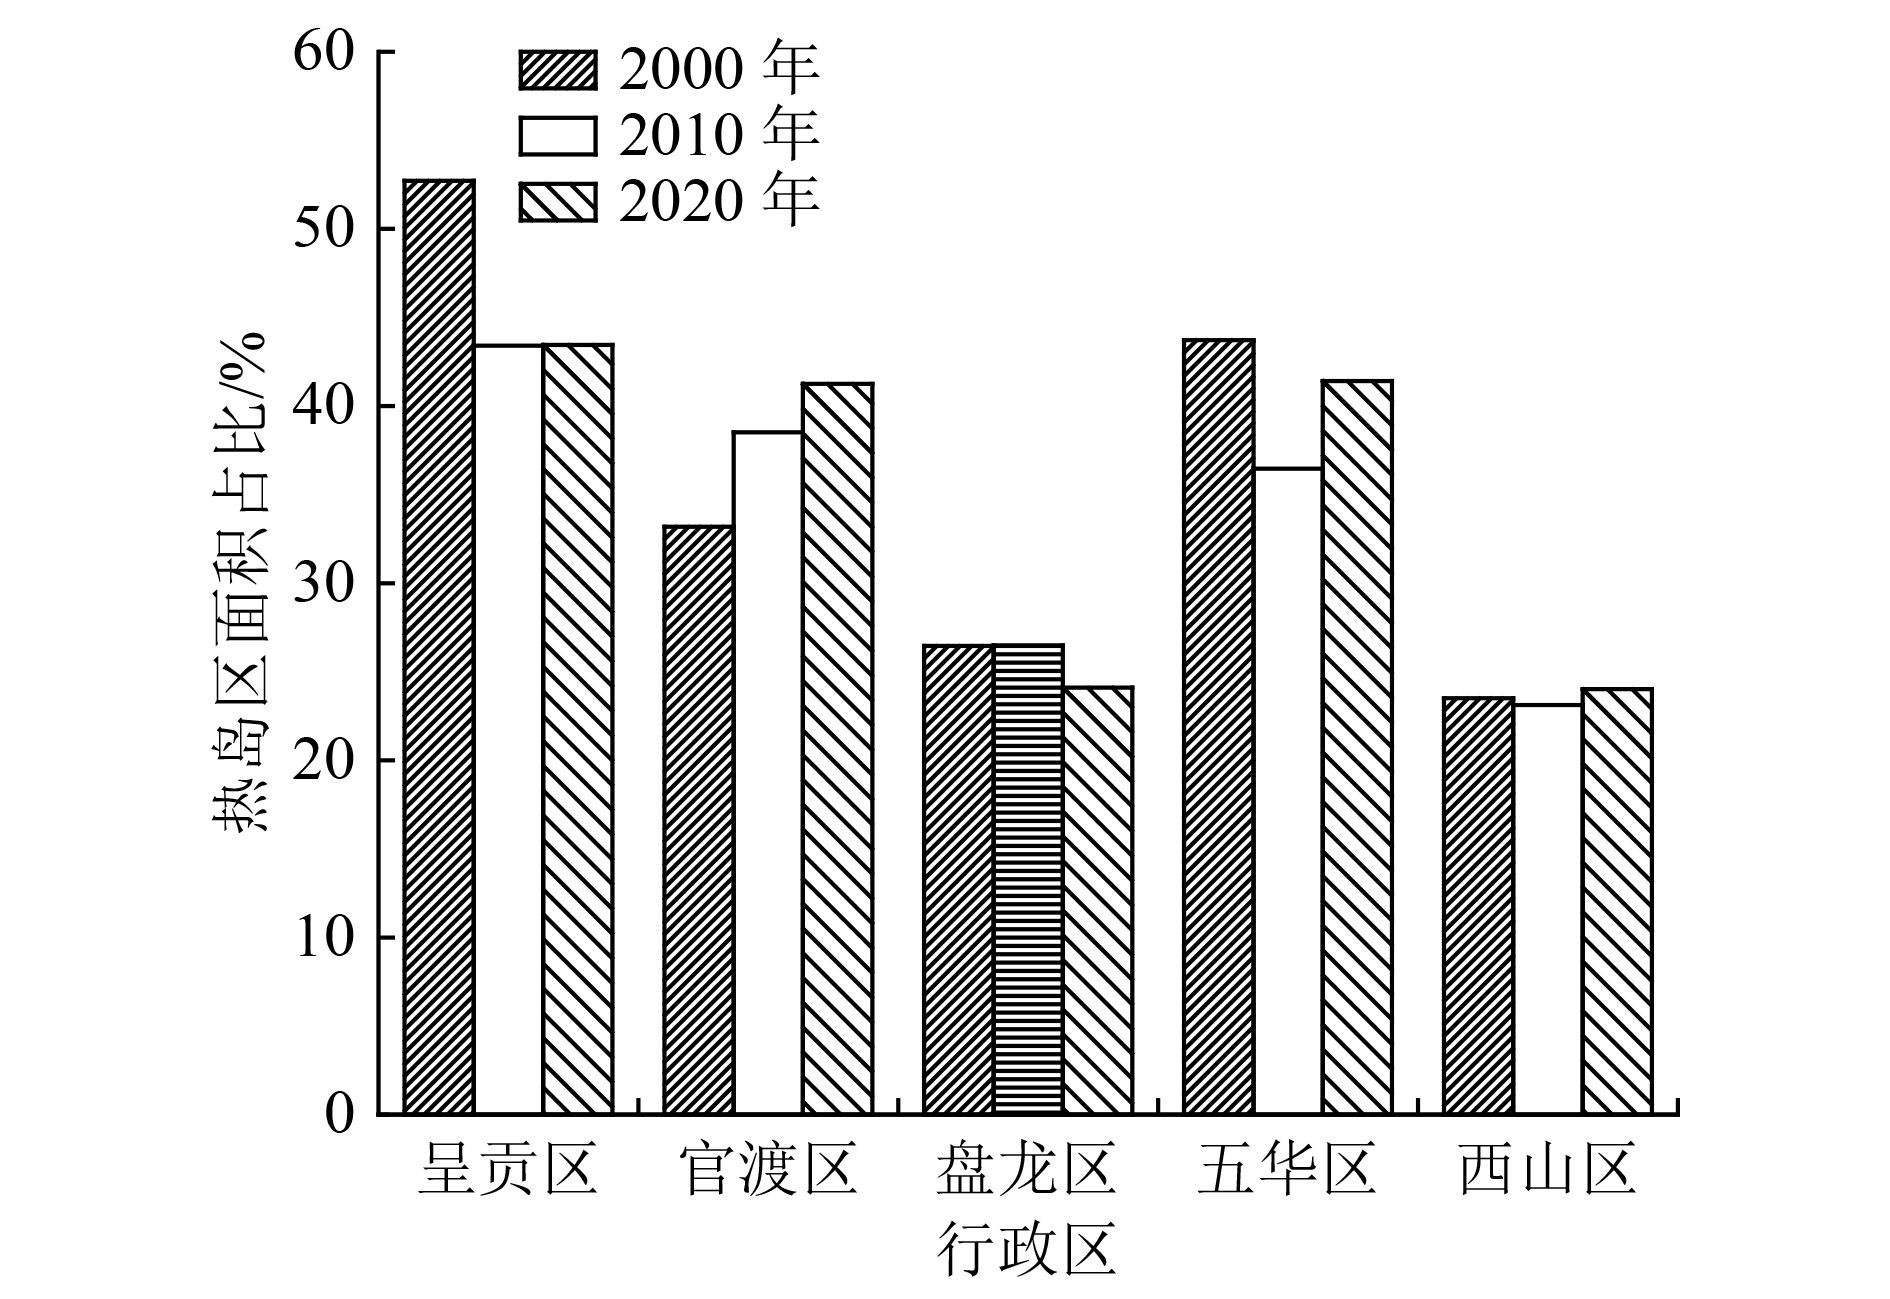
图 4 昆明市主城区各行政区热岛区面积占比
Figure 4. Proportion of heat island area of each administrative region in the main urban area of Kunming
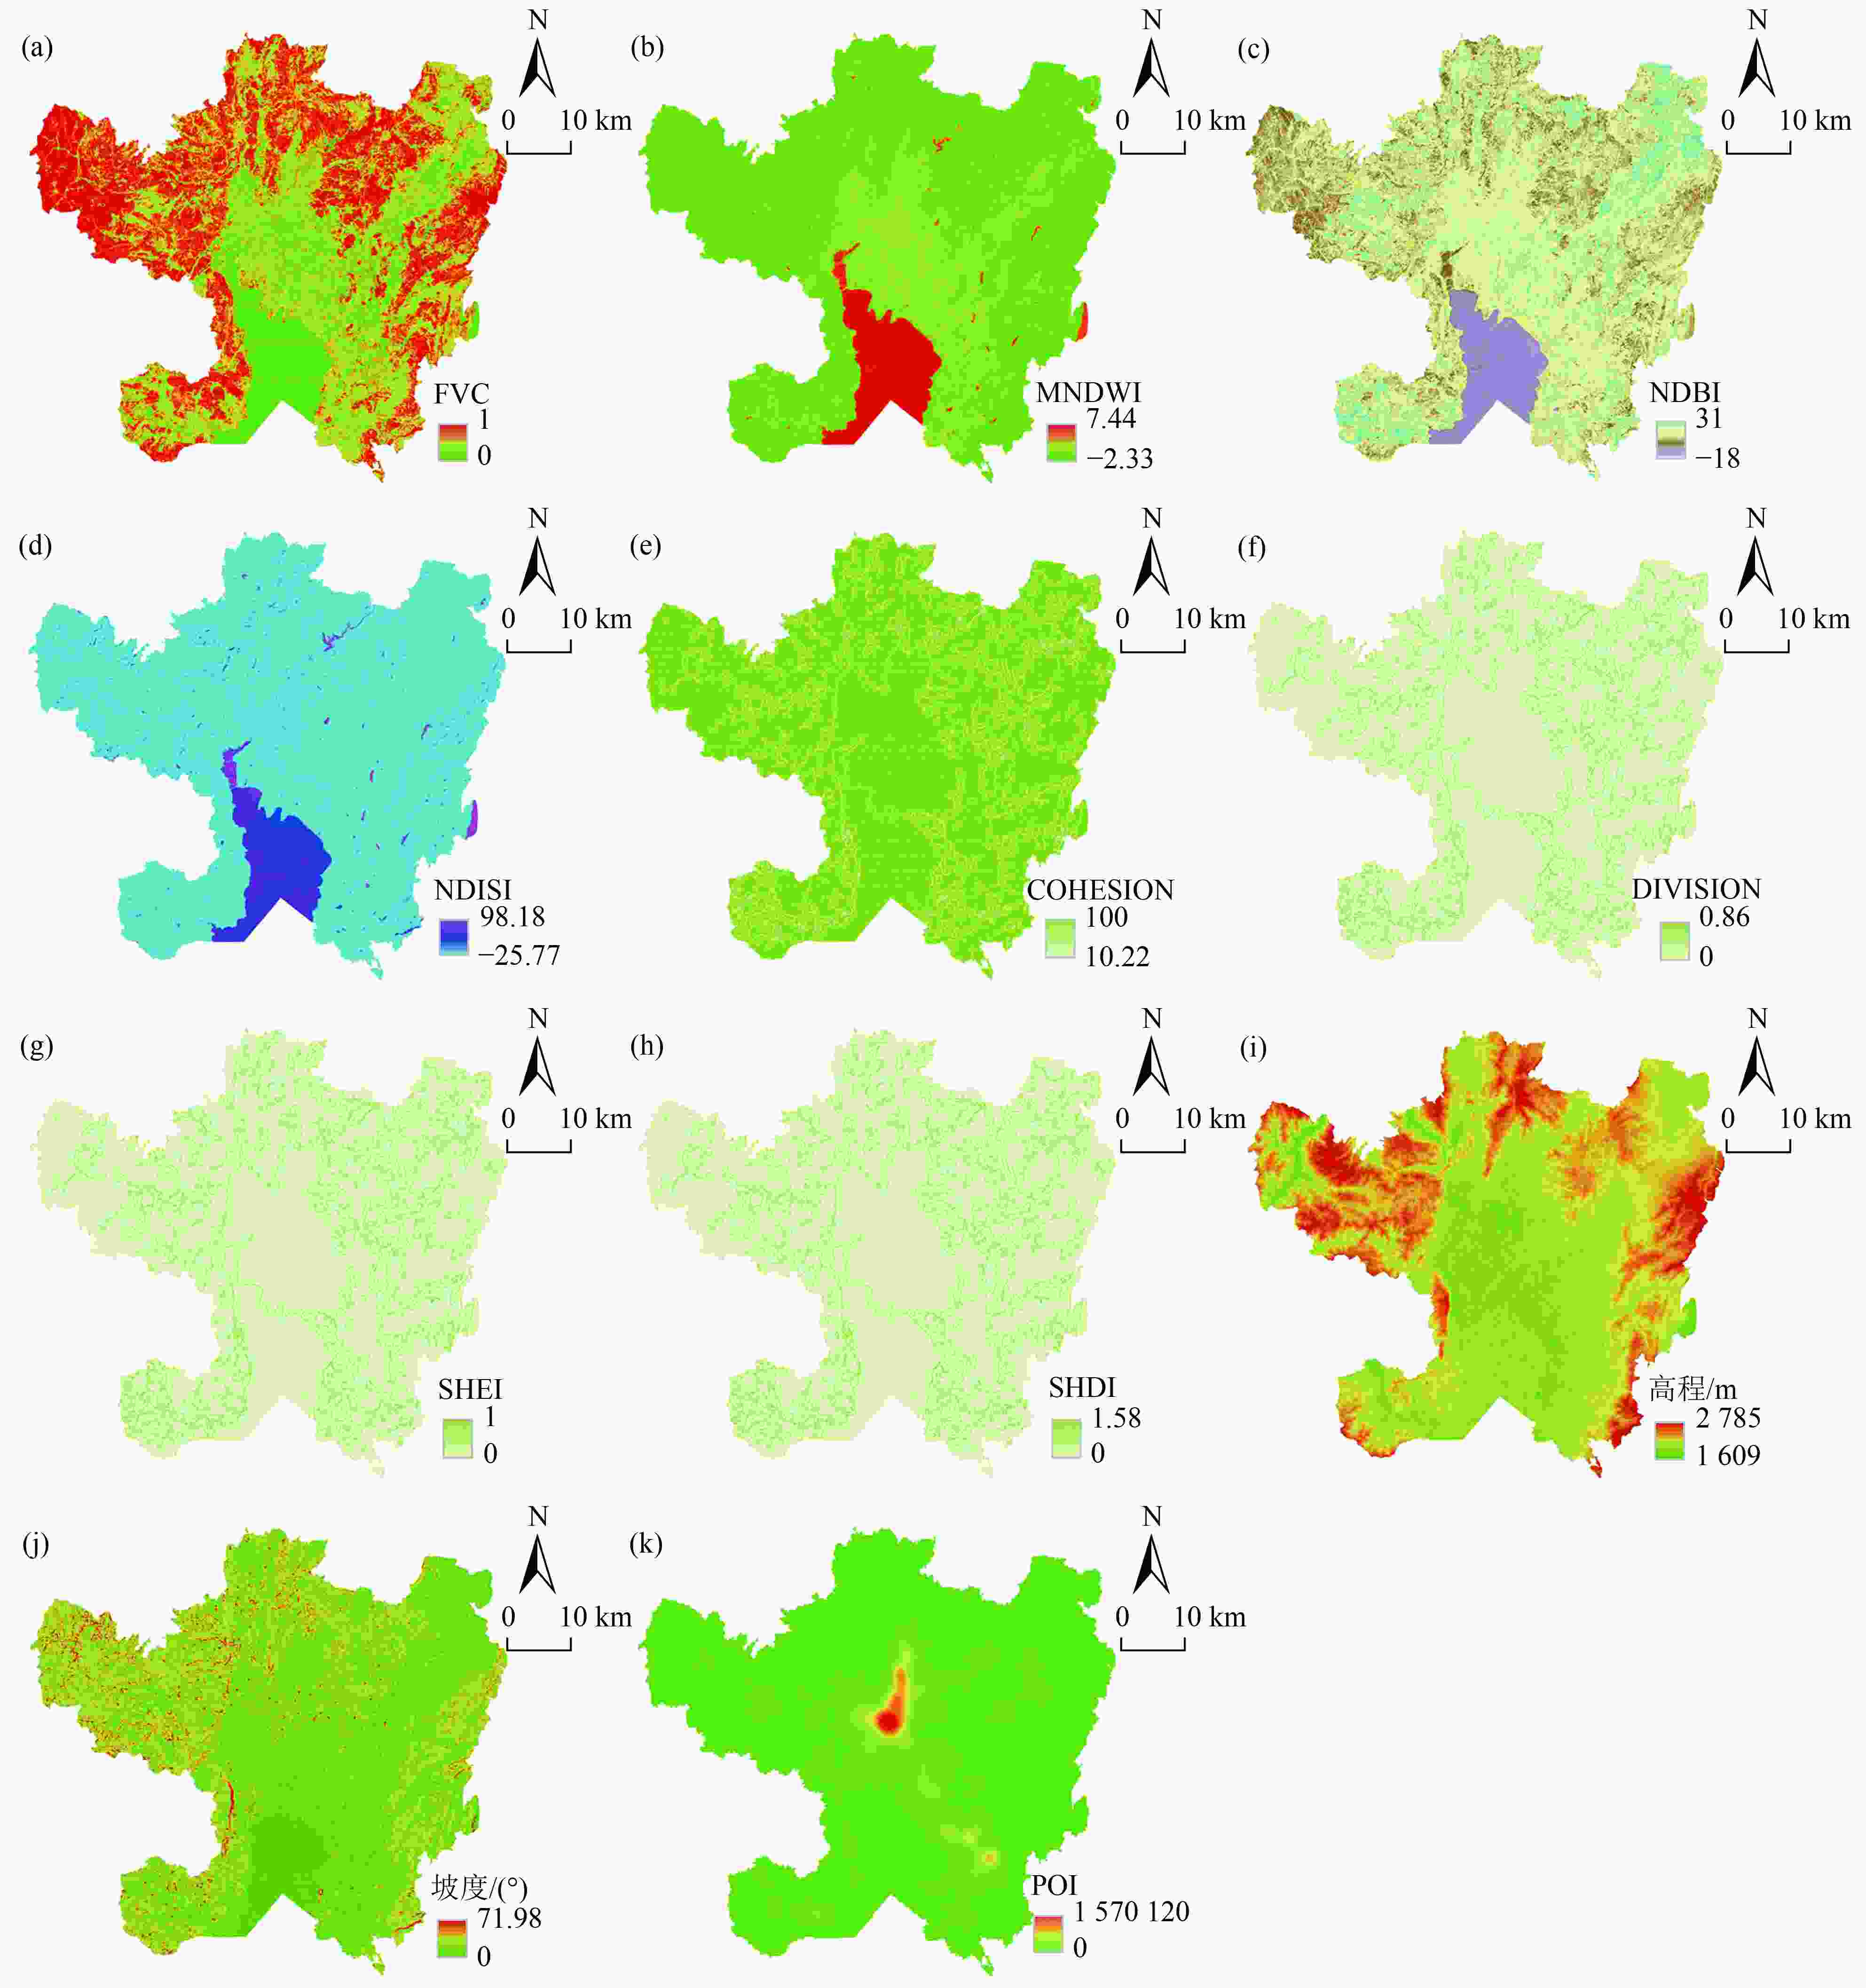
图 5 昆明市主城区热环境影响因素空间分布
Figure 5. Spatial distribution of influencing factors of thermal environment in the main urban area of Kunming
表 1 数据来源
Table 1. Data sources
数据名称 时间 来源 用途 Landsat TM/OLI 2000年2月12日
2010年2月7日
2020年1月18日地理空间数据云( http://www.gscloud )反演地表温度与获取地表信息 DEM数据 2020年 地理空间数据云( http://www.gscloud )获取高程与坡度信息 土地利用类型图 2020年 全球地理信息公共产品( http://globeland30.org/ )计算景观格局指数 POI指数 2020年 中国科学院资源环境科学与数据中心
(https://www.resdc.cn/ )计算社会经济活动指数  下载: 导出CSV
表 2 昆明市主城区地表温度等级划分
Table 2. Grade classification of surface temperature in the main urban area of Kunming
温度等级 T 极低温区 T<u−2.5std 低温区 u−2.5std≤T<u−1.5std 较低温区 u−1.5std≤T<u−0.5std 中温区 u−0.5std≤T<u+0.5std 较高温区 u+0.5std≤T<u+1.5std 高温区 u+1.5std≤T<u+2.5std 极高温区 T≥u+2.5std 注:T为研究区域的地表温度;u为地表温度的平均值;std为标准差。
下载: 导出CSV
表 3 2个影响因子对因变量交互作用的类型
Table 3. Types of the interaction of two influencing factors on dependent variables
判断依据 交互作用 q(x1∩x2)<min[q(x1),q(x2)] 非线性减弱 min(q(x1),q(x2))<q(x1∩x2)<max[q(x1),q(x2)] 单因子非线性减弱 q(x1∩x2)> max[q(x1),q(x2)] 双因子增强 q(x1∩x2)= q(x1)+ q(x2) 独立 q(x1∩x2)> q(x1)+ q(x2) 非线性增强
下载: 导出CSV
表 4 2000—2020年昆明市主城区地表温度等级面积及占比
Table 4. Area and proportion of surface temperature grades in the main urban area of Kunming from 2000 to 2020
温度等级 2000年 2010年 2020年 面积/km2 占比/% 面积/km2 占比/% 面积/km2 占比/% 极低温区 30.06 1.13 0.00 0.00 6.89 0.26 低温区 251.88 9.51 264.73 9.92 273.23 10.24 较低温区 413.00 15.59 567.73 21.27 537.60 20.14 中温区 1 061.86 40.78 964.14 36.12 945.14 35.41 较高温区 810.96 30.61 704.32 26.38 768.32 28.78 高温区 97.23 3.67 161.96 6.07 129.20 4.84 极高温区 4.51 0.17 6.62 0.25 9.11 0.34
下载: 导出CSV
表 5 昆明市主城区各行政区地表温度等级面积统计
Table 5. Statistics table of heat island area of each administrative region in the main urban area of Kunming
km2 行政区 2000年 2010年 2020年 较高温区 高温区 极高温区 较高温区 高温区 极高温区 较高温区 高温区 极高温区 呈贡区 232.65 35.60 0.72 179.36 41.48 0.62 191.74 28.71 1.20 官渡区 204.13 5.85 0.08 198.58 43.77 1.50 226.35 32.77 2.02 盘龙区 80.12 6.59 0.11 70.17 16.09 0.65 68.31 10.24 0.54 五华区 114.31 22.00 1.78 88.32 25.18 1.70 103.71 24.33 2.76 西山区 179.20 26.01 1.68 167.51 34.03 1.96 177.58 31.53 2.34
下载: 导出CSV
表 6 昆明市主城区地表温度与影响因子的相关性
Table 6. Correlation between surface temperature and influencing factors in the main urban area of Kunming
项目 FVC MNDWI NDBI NDISI COHESION DIVISION SHDI SHEI 高程 坡度 POI 相关系数 −0.033 7 −0.360 2 0.596 7 −0.197 7 0.085 9 0.200 3 0.217 8 0.200 3 −0.037 6 0.000 6 0.066 9 显著水平 0.000 0 0.014 9 0.000 0 0.000 0 0.000 0 0.000 0 0.000 0 0.000 0 0.613 2 0.000 0 0.000 0
下载: 导出CSV
表 7 影响因子对昆明市主城区地表温度的影响力
Table 7. Influence of influencing factors on the surface temperature in the main urban area of Kunming
项目 FVC MNDWI NDBI NDISI COHESION DIVISION SHDI SHEI 高程 坡度 POI 解释力 0.349 2 0.264 5 0.372 5 0.210 8 0.110 8 0.110 8 0.110 2 0.110 8 0.142 5 0.063 3 0.010 9 显著水平 0.000 0 0.000 0 0.000 0 0.000 0 0.000 0 0.000 0 0.000 0 0.000 0 0.000 0 0.005 0 1.000 0
下载: 导出CSV
表 8 影响因子的交互作用结果
Table 8. Results of the interaction of influencing factors
交互类型 交互影响力 交互作用 交互类型 交互影响力 交互作用 FVC∩MNDWI 0.42 双因子增强 NDBI∩坡度 0.44 非线性增强 FVC∩NDBI 0.42 双因子增强 NDISI∩COHESION 0.28 双因子增强 FVC∩NDISI 0.37 双因子增强 NDISI∩DIVISION 0.28 双因子增强 FVC∩COHESION 0.45 双因子增强 NDISI∩SHDI 0.28 双因子增强 FVC∩DIVISION 0.45 双因子增强 NDISI∩SHEI 0.28 双因子增强 FVC∩SHDI 0.44 双因子增强 NDISI∩高程 0.37 非线性增强 FVC∩SHEI 0.45 双因子增强 NDISI∩坡度 0.30 非线性增强 FVC∩高程 0.49 双因子增强 COHESION∩DIVISION 0.11 双因子增强 FVC∩坡度 0.42 非线性增强 COHESION∩SHDI 0.11 双因子增强 MNDWI∩NDBI 0.28 单因子非线性减弱 COHESION∩SHEI 0.11 双因子增强 MNDWI∩NDISI 0.23 单因子非线性减弱 COHESION∩高程 0.30 非线性增强 MNDWI∩COHESION 0.34 双因子增强 COHESION∩坡度 0.18 非线性增强 MNDWI∩DIVISION 0.34 双因子增强 DIVISION∩SHDI 0.11 双因子增强 MNDWI∩SHDI 0.34 双因子增强 DIVISION∩SHEI 0.11 双因子增强 MNDWI∩SHEI 0.34 双因子增强 DIVISION∩高程 0.30 非线性增强 MNDWI∩高程 0.47 非线性增强 DIVISION∩坡度 0.18 非线性增强 MNDWI∩坡度 0.38 非线性增强 SHDI∩SHEI 0.11 双因子增强 NDBI∩NDISI 0.38 双因子增强 SHDI∩高程 0.30 非线性增强 NDBI∩COHESION 0.45 双因子增强 SHDI∩坡度 0.17 双因子增强 NDBI∩DIVISION 0.45 双因子增强 SHEI∩高程 0.30 非线性增强 NDBI∩SHDI 0.45 双因子增强 SHEI∩坡度 0.18 非线性增强 NDBI∩SHEI 0.45 双因子增强 SHEI∩坡度 0.17 双因子增强 NDBI∩高程 0.52 非线性增强
下载: 导出CSV
-
[1] 岳文泽, 徐建华, 徐丽华.基于遥感影像的城市土地利用生态环境效应研究: 以城市热环境和植被指数为例[J]. 生态学报,2006,26(5):1450-1460. doi: 10.3321/j.issn:1000-0933.2006.05.021YUE W Z, XU J H, XU L H. An analysis on eco-environmental effect of urban land use based on remote sensing images: a case study of urban thermal environment and NDVI[J]. Acta Ecologica Sinica,2006,26(5):1450-1460. doi: 10.3321/j.issn:1000-0933.2006.05.021 [2] 孙翼. 城市扩展对城市热环境影响研究: 以武汉市为例[D]. 武汉: 湖北工业大学, 2016. [3] 肖荣波, 欧阳志云, 李伟峰, 等.城市热岛的生态环境效应[J]. 生态学报,2005,25(8):2055-2060. doi: 10.3321/j.issn:1000-0933.2005.08.032XIAO R B, OUYANG Z Y, LI W F, et al. A review of the eco-environmental consequences of urban heat Islands[J]. Acta Ecologica Sinica,2005,25(8):2055-2060. doi: 10.3321/j.issn:1000-0933.2005.08.032 [4] YUE W Z, LIU Y, FAN P L, et al. Assessing spatial pattern of urban thermal environment in Shanghai, China[J]. Stochastic Environmental Research and Risk Assessment,2012,26(7):899-911. doi: 10.1007/s00477-012-0638-1 [5] 熊鹰, 章芳.基于多源数据的长沙市人居热环境效应及其影响因素分析[J]. 地理学报,2020,75(11):2443-2458. doi: 10.11821/dlxb202011013XIONG Y, ZHANG F. Thermal environment effects of urban human settlements and influencing factors based on multi-source data: a case study of Changsha City[J]. Acta Geographica Sinica,2020,75(11):2443-2458. doi: 10.11821/dlxb202011013 [6] JOHNSON H, KOVATS R S, MCGREGOR G, et al. The impact of the 2003 heat wave on daily mortality in England and Wales and the use of rapid weekly mortality estimates[J]. European Communicable Disease Bulletin,2005,10(7):168-171. [7] 蒲禹君, 蒲金涌.西北中等城市热岛效应变化特征: 以天水市为例[J]. 环境工程技术学报,2011,1(5):376-382. doi: 10.3969/j.issn.1674-991X.2011.05.063PU Y J, PU J Y. Variation of urban heat island characteristics at medium-sized city in the northwest: a case of Tianshui[J]. Journal of Environmental Engineering Technology,2011,1(5):376-382. doi: 10.3969/j.issn.1674-991X.2011.05.063 [8] 林中立, 徐涵秋, 陈弘.我国东部沿海三大城市群热岛变化及其与城市群发展的关系[J]. 环境科学研究,2018,31(10):1695-1704.LIN Z L, XU H Q, CHEN H. Urban heat island change and its relationship to the urbanization of three major urban agglomerations in China's eastern coastal region[J]. Research of Environmental Sciences,2018,31(10):1695-1704. [9] 陈燕红, 蔡芫镔, 仝川.福州主城区绿色空间不同演化模式对地表温度扰动的影响[J]. 环境科学研究,2020,33(4):995-1004.CHEN Y H, CAI Y B, TONG C. Effects of different urban green space development on surface temperature in Fuzhou City[J]. Research of Environmental Sciences,2020,33(4):995-1004. [10] 张晓东, 赵银鑫, 褚小东, 等.基于遥感的银川市城区热环境及其影响因素的时空演变特征[J]. 水土保持研究,2020,27(6):180-187.ZHANG X D, ZHAO Y X, CHU X D, et al. Spatial and temporal evolution characteristics of thermal environment and its influencing factors in urban area of Yinchuan City based on remote sensing[J]. Research of Soil and Water Conservation,2020,27(6):180-187. [11] 韩贵锋, 颜文涛, 赵珂, 等.近20年来重庆市主城区地表热岛的时空变化[J]. 环境科学研究,2012,25(6):615-621.HAN G F, YAN W T, ZHAO K, et al. Spatial-temporal changes of surface heat island in the central area of Chongqing over the past 20 years[J]. Research of Environmental Sciences,2012,25(6):615-621. [12] 刘丽香, 杨凯, 叶家慧, 等.雄安新区城市热岛效应的空间异质性[J]. 环境工程技术学报,2021,11(3):546-553. doi: 10.12153/j.issn.1674-991X.20200194LIU L X, YANG K, YE J H, et al. Spatial variation of urban heat island effect in Xiongan New Area[J]. Journal of Environmental Engineering Technology,2021,11(3):546-553. doi: 10.12153/j.issn.1674-991X.20200194 [13] WANG M Y, XU H Q. The impact of building height on urban thermal environment in summer: a case study of Chinese megacities[J]. PLoS One,2021,16(4):0247786. [14] ZHAO D, LEI Q H, SHI Y J, et al. Role of species and planting configuration on transpiration and microclimate for urban trees[J]. Forests,2020,11(8):825. doi: 10.3390/f11080825 [15] CHEN G W, WANG D Y, WANG Q, et al. Scaled outdoor experimental studies of urban thermal environment in street canyon models with various aspect ratios and thermal storage[J]. Science of the Total Environment,2020,726:138147. doi: 10.1016/j.scitotenv.2020.138147 [16] 沈中健, 曾坚.闽南三市城镇发展与地表温度的空间关系[J]. 地理学报,2021,76(3):566-583. doi: 10.11821/dlxb202103006SHEN Z J, ZENG J. Spatial relationship of urban development to land surface temperature in three cities of southern Fujian[J]. Acta Geographica Sinica,2021,76(3):566-583. doi: 10.11821/dlxb202103006 [17] 赵禾苗, 阿里木江·卡斯木.乌鲁木齐市主城区热环境与下垫面关系研究[J]. 测绘科学,2021,46(8):179-187.ZHAO H M, ALIMUJIANG K. Study on the relationship between thermal environment and underlying surface in the main urban area of Urümqi[J]. Science of Surveying and Mapping,2021,46(8):179-187. [18] MA X L, PENG S Y. Assessing the quantitative relationships between the impervious surface area and surface heat island effect during urban expansion[J]. PeerJ,2021,9:e11854. doi: 10.7717/peerj.11854 [19] 杨云源, 史正涛, 何萍.基于多源数据的昆明市主城区建筑区热环境分析[J]. 热带地理,2013,33(1):21-27.YANG Y Y, SHI Z T, HE P. Analysis of thermal environment of the main urban area of Kunming based on multi-source data[J]. Tropical Geography,2013,33(1):21-27. [20] 李红, 高皜, 解韩玮.昆明市主城区热环境及其影响因素的时空演化特征[J]. 生态环境学报,2018,27(10):1916-1924.LI H, GAO H, XIE H W. Spatial and temporal evolution of thermal environment and its influencing factors in urban area of Kunming City[J]. Ecology and Environmental Sciences,2018,27(10):1916-1924. [21] 章皖秋, 袁华, 岳彩荣, 等.昆明中心城区地表温度反演及与土地覆盖关系分析[J]. 西南林业大学学报,2016,36(5):130-137.ZHANG W Q, YUAN H, YUE C R, et al. The retrieval of land surface temperature of Kunming urban area and its relationships with landscape compositions[J]. Journal of Southwest Forestry University,2016,36(5):130-137. [22] 刘鑫, 甘淑.基于Landsat数据的昆明地区热岛效应分析[J]. 科学技术与工程,2011,11(13):3009-3013. doi: 10.3969/j.issn.1671-1815.2011.13.028LIU X, GAN S. Analysis on the urban heat island effect of Kunming area based on landsat data[J]. Science Technology and Engineering,2011,11(13):3009-3013. doi: 10.3969/j.issn.1671-1815.2011.13.028 [23] 杨树文, 董玉森, 罗小波. 遥感数字图像处理与分析: ENVI5.x实验教程[M]. 北京: 电子工业出版社, 2015. [24] 韩朗逸. 基于POI大数据的天津市城市功能分区识别研究[C]//2017中国城市规划年会论文集. 东莞, 2017: 124-132. [25] 赵璐, 赵作权.基于特征椭圆的中国经济空间分异研究[J]. 地理科学,2014,34(8):979-986.ZHAO L, ZHAO Z Q. Projecting the spatial variation of economic based on the specific ellipses in China[J]. Scientia Geographica Sinica,2014,34(8):979-986. [26] 王劲峰, 徐成东.地理探测器: 原理与展望[J]. 地理学报,2017,72(1):116-134. doi: 10.11821/dlxb201701010WANG J F, XU C D. Geodetector: principle and prospective[J]. Acta Geographica Sinica,2017,72(1):116-134. ⊕ doi: 10.11821/dlxb201701010 -

 下载:
下载:


 点击查看大图
计量
- 文章访问数: 226
- HTML全文浏览量: 114
- PDF下载量: 20
- 被引次数: 0