

Construction and appliction of evaluation index system of social and economic carrying capacity in Xiong'an New Area
-
摘要:
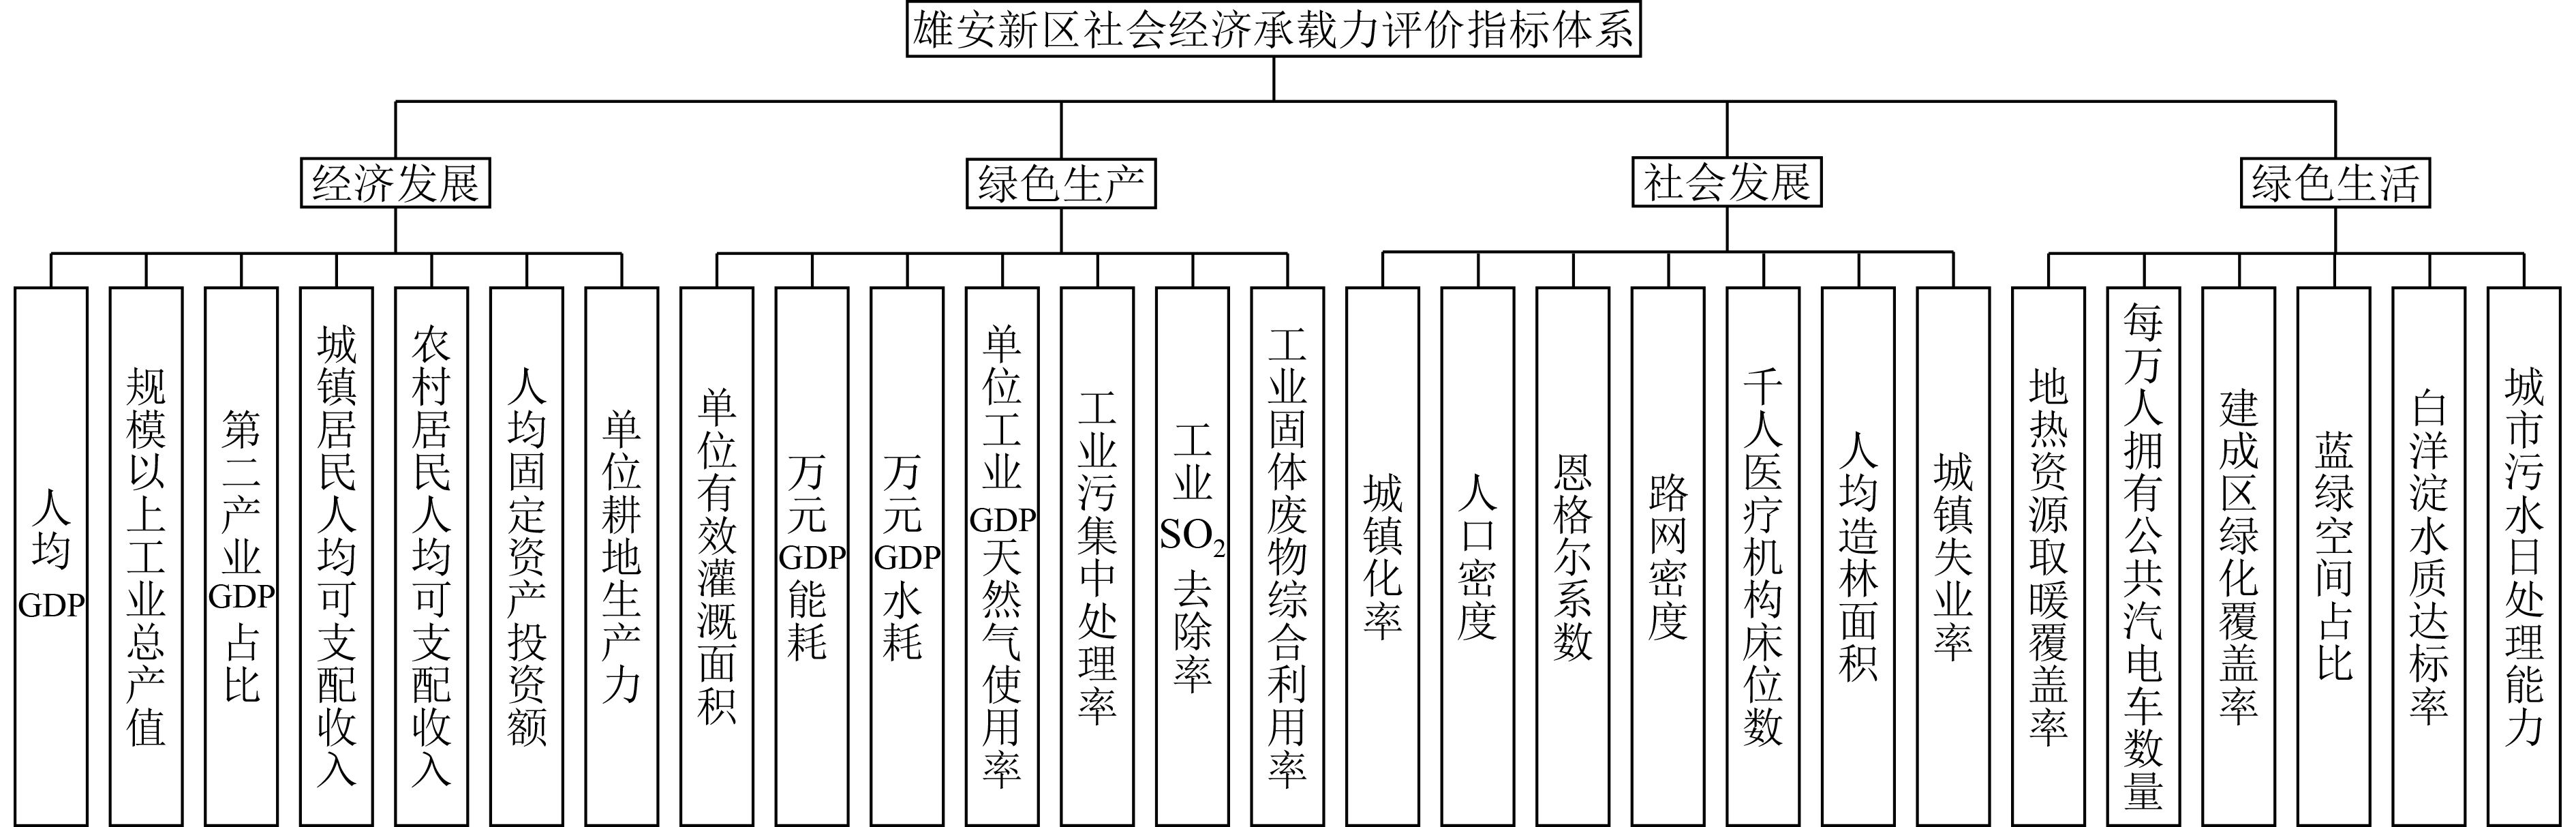
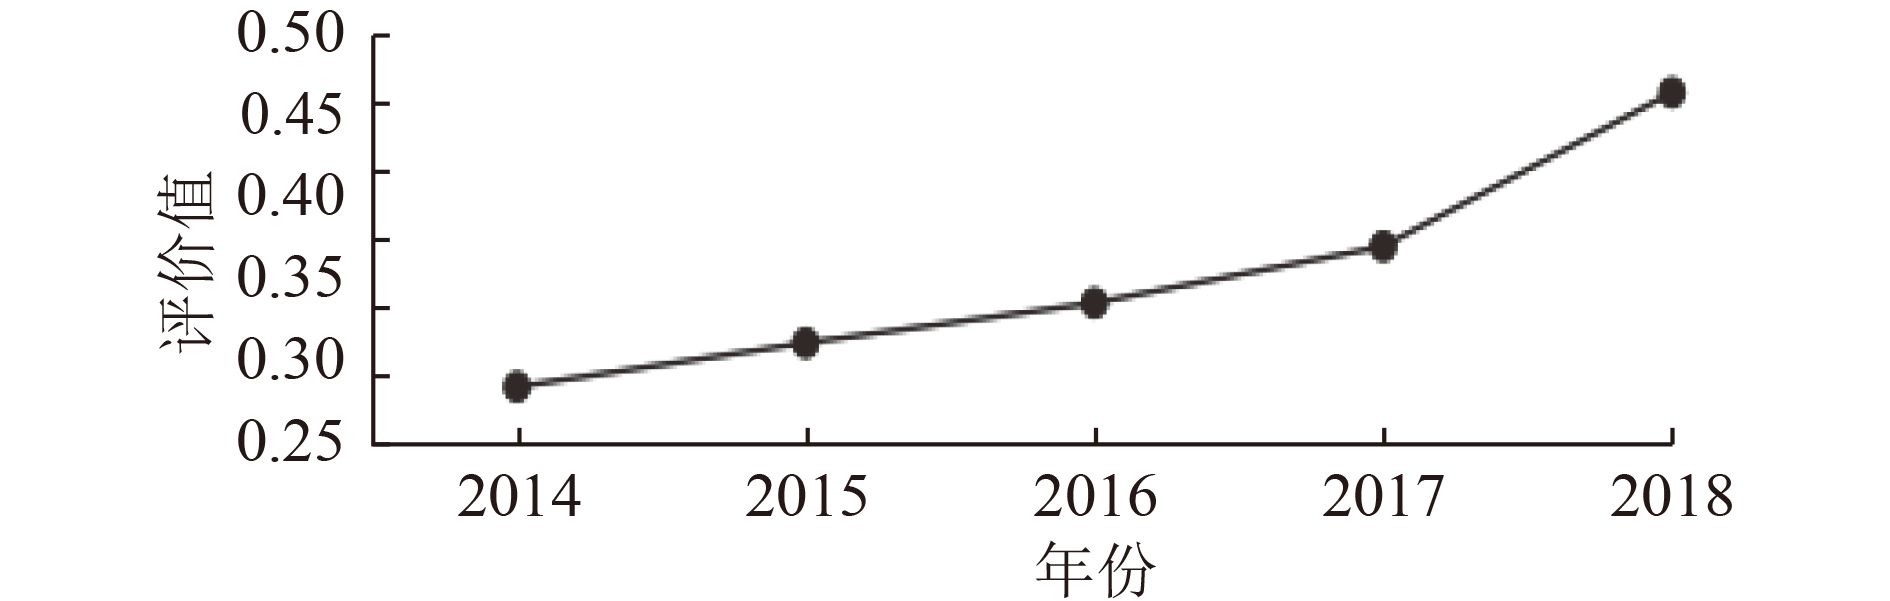
通过分析雄安新区经济与社会发展状况,遵循“推广绿色低碳的生产生活方式”的新区规划与建设要求,选择经济发展、绿色生产、社会发展与绿色生活4个维度,运用相关性分析与主成分分析的定量方法,提炼出人均GDP、万元GDP水耗、城镇化率、地热资源取暖覆盖率等27个社会经济承载状况的主要特征指标,构建符合区域特征、能够反映社会经济系统之间协调发展程度的雄安新区社会经济承载力评价指标体系,并运用该指标体系对2014—2018年雄安新区的社会经济承载力进行评价。结果表明:雄安新区的社会经济承载力呈现稳步增长趋势,年均增长率为12.81%,尤其是2016年后新区提升了经济建设与社会发展速度,2017年加大了绿色生产与绿色生活的投资力度,使得2018年新区社会经济承载力明显增强,较2016年、2017年分别高37.66%、25.01%。提出了持续优化调整产业结构,形成绿色生产方式,加大环境治理与生态修复力度,推广绿色生活方式的社会经济承载力提升对策,以期为雄安新区社会经济的可持续发展提供参考。
Abstract:Through analysis of the economic and social development of Xiong'an New Area, following its planning and construction requirements of "promoting green, low carbon production and lifestyle", from four dimensions of economic development, green production, social development and green life, 27 indicators inflecting the main characteristic indicators of the social and economic carrying capacity in the New Area, such as GDP per capita, water consumption per 10 000 yuan GDP, urbanization rate, coverage rate of geothermal resource heating, were extracted by the quantitative methods of correlation analysis and principal component analysis. An evaluation index system of the social and economic carrying capacity of Xiong'an New Area, which conformed to regional characteristics and could reflect the coordinated development degree between social and economic systems, was constructed and used to evaluate the social and economic carrying capacity of the New Area from 2014 to 2018. The results showed that the social and economic carrying capacity of the New Area had shown a steady upward trend, with an average annual growth rate of 12.81%. Especially after 2016, the speed of economic construction and social development had been improved, and investments in green production and green life increased in 2017. Thus the social and economic carrying capacity of the New Area in 2018 was significantly enhanced, 37.66% and 25.01% higher than that in 2016 and 2017 respectively. Finally, the promotion countermeasures were proposed to improve the social and economic carrying capacity of the New Area by sustainably optimizing and adjusting of industrial structure and forming a green production mode, strengthening environmental governance and ecological restoration and promoting a green lifestyle mode, so as to provide a reference for sustainable development of economy and society in the New Area.
-

图 2 雄安新区社会经济承载力评价指标体系
Figure 2. Evaluation index system of social and economic carrying capacity in Xiong'an New Area

图 3 2014—2018年雄安新区社会经济承载力评价值
Figure 3. Evaluation value of social and economic carrying capacity in Xiong'an New Area from 2014 to 2018
表 1 雄安新区社会经济承载力评价初步指标体系
Table 1. Preliminary evaluation index system of social and economic carrying capacity in Xiong'an New Area
一级指标 二级指标 三级指标 雄安新区
社会经济承载力经济发展 GDP总量、人均GDP、GDP年增长率、规模以上工业总产值、第一产业GDP占比、第二产业GDP占比、城镇居民人均可支配收入、农村居民人均可支配收入、社会消费品零售总额、人均固定资产投资额、单位耕地生产力、人均粮食占有量、居民消费价格指数 绿色生产 单位面积农药化肥使用量、单位有效灌溉面积、第三产业GDP占比、万元GDP能耗、万元GDP水耗、万元GDP电耗、单位工业GDP天然气使用率、万元工业增加值耗水量、工业污水集中处理率、工业SO2去除率、工业固体废物综合利用率 社会发展 人口总量、城镇化率、人口自然增长率、人口密度、农民平均受教育程度、恩格尔系数、人均城市道路面积、路网密度、千人医疗机构床位数、人均造林面积、城镇登记失业率 绿色生活 居民生活中清洁能源占比、地热资源取暖覆盖率、液化石油气家庭用量、每万人拥有公共汽/电车数量、新能源汽车增长率、电动自行车保有率、建成区绿化覆盖率、蓝绿空间占比、充电站覆盖率、白洋淀水质达标率、生活垃圾无害化处理率、城市污水日处理能力  下载: 导出CSV
表 2 经济发展各指标的特征根与方差贡献表
Table 2. Characteristic root and variance contribution of economic development indexes
成分 初始特征值 提取载荷平方和 旋转载荷平方和 总计 方差百分比/
%累积 总计 方差百分比
/%累积 总计 方差百分比
/%累积 1 11.008 58.800 58.800 11.008 58.800 58.800 7.440 46.499 46.499 2 3.464 18.653 77.453 3.464 18.653 77.453 4.792 22.451 68.950 3 1.173 7.334 84.787 1.173 7.334 84.787 3.414 15.837 84.787 4 0.954 5.214 90.001 5 0.873 4.336 94.337 6 0.273 2.336 99.946 7 3.753×10⁻¹⁵ 2.345×10⁻¹⁴ 100 8 6.451×10⁻¹⁶ 4.032×10⁻¹⁵ 100 9 3.174×10⁻¹⁶ 1.984×10⁻¹⁵ 100 10 9.196×10⁻¹⁵ 5.748×10⁻¹⁶ 100 11 −2.165×10⁻¹⁷ −1.353×10⁻¹⁶ 100
下载: 导出CSV
表 3 旋转后的成分矩阵
Table 3. Rotated component matrix
三级指标 成分 1 2 3 人均GDP 0.038 0.923 0.374 GDP年增长率 −0.944 −0.238 0.206 规模以上工业总产值 0.915 0.055 −0.127 第一产业GDP占比 −0.044 −0.994 −0.076 第二产业GDP占比 0.979 −0.108 −0.167 城镇居民人均可支配收入 0.613 0.895 −0.078 农村居民人均可支配收入 0.528 0.839 0.133 社会消费品零售总额 −0.599 0.665 0.260 人均固定资产投资额 0.318 0.901 0.236 单位耕地生产力 0.364 0.044 0.928 居民消费价格指数 −0.953 −0.280 −0.094
下载: 导出CSV
表 4 雄安新区经济发展评价指标的分级标准
Table 4. Classification standard of economic development evaluation index of Xiong'an New Area
二级指标 三级指标 理想承载状态(v1) 可承载状态(v2) 不可承载状态(v3) 经济发展 人均GDP/(元/人) >65 000 65 000~45 000 <45 000 规模以上工业总产值/亿元 >1 000 1 000~500 <500 第二产业GDP占比/% >45 45~40 <40 城镇居民人均可支配收入/元 >40 000 40 000~30 000 <30 000 农村居民人均可支配收入/元 >16 000 16 000~12 000 <12 000 人均固定资产投资额/(元/人) >47 000 47 000~38 000 <38 000 单位耕地生产力/(t/km2) >650 650~550 <550
下载: 导出CSV
表 5 2014—2018年雄安新区经济发展分级评价及综合评价结果
Table 5. Grading evaluation and comprehensive evaluation results of economic development in Xiong'an New Area from 2014 to 2018
年份 评价结果(v1) 评价结果(v2) 评价结果(v3) 综合评价结果 2014 0.145 5 0.312 6 0.541 9 0.321 6 2015 0.137 4 0.361 0 0.501 6 0.336 1 2016 0.151 4 0.401 8 0.446 8 0.367 1 2017 0.165 8 0.381 4 0.452 8 0.370 9 2018 0.201 8 0.361 1 0.437 1 0.394 1
下载: 导出CSV
表 6 2014—2018年雄安新区绿色生产分级评价及综合评价结果
Table 6. Grading evaluation and comprehensive evaluation results of green production in Xiong'an New Area from 2014 to 2018
年份 评价结果(v1) 评价结果(v2) 评价结果(v3) 综合评价结果 2014 0.098 0 0.203 3 0.698 7 0.229 7 2015 0.104 0 0.207 5 0.688 5 0.237 0 2016 0.107 0 0.209 9 0.683 1 0.240 8 2017 0.128 3 0.232 9 0.648 8 0.270 8 2018 0.131 5 0.369 1 0.499 4 0.334 5
下载: 导出CSV
表 8 2014—2018年雄安新区绿色生活分级评价及综合评价结果
Table 8. Grading evaluation and comprehensive evaluation results of green life in Xiong'an New Area from 2014 to 2018
年份 评价结果(v1) 评价结果(v2) 评价结果(v3) 综合评价结果 2014 0 0.4268 0.5732 0.242 1 2015 0.0581 0.4471 0.4948 0.303 5 2016 0.1341 0.3772 0.4887 0.340 4 2017 0.2093 0.3659 0.4248 0.403 0 2018 0.2783 0.4633 0.2584 0.509 0
下载: 导出CSV
表 7 2014—2018年雄安新区社会发展分级评价及综合评价结果
Table 7. Grading evaluation and comprehensive evaluation results of social development in Xiong'an New Area from 2014 to 2018
年份 评价结果(v1) 评价结果(v2) 评价结果(v3) 综合评价结果 2014 0.171 0 0.276 0 0.553 0 0.328 1 2015 0.201 4 0.263 1 0.535 5 0.349 7 2016 0.240 2 0.239 1 0.520 7 0.373 8 2017 0.275 9 0.244 8 0.479 3 0.409 4 2018 0.440 3 0.267 3 0.292 4 0.566 6
下载: 导出CSV
-
[1] 安海忠, 李华姣.资源环境承载力研究框架体系综述[J]. 资源与产业,2016,18(6):21-26.AN H Z, LI H J. Research framework of resources and environment carrying capacity[J]. Resources & Industries,2016,18(6):21-26. [2] DAILY G C, EHRLICH P R. Population, sustainability, and earth′s carrying capacity: a framework for estimating population sizes and lifestyles that could be sustained without under mining future generations[J]. Ecological Applications, 1992, 6(4): 991-1001. [3] HARDIN G. Cultural carrying capacity: a biological approach to human problems[J]. BioScience, 1986, 36(9): 599-606. [4] KHANNA P, BABU R P, GEORGE M S. Carrying-capacity as a basis for sustainable development a case study of national capital region in India[J]. Progress in Planning,1999,52(2):101-166. doi: 10.1016/S0305-9006(99)00004-5 [5] 葛磊. 自然保护区社会经济承载力研究: 以白水江自然保护区为例[D]. 兰州: 兰州大学, 2009. [6] 韦惠兰, 刘晨烨.经济承载力初探[J]. 生态经济(学术版),2012(2):31-34.WEI H L, LIU C Y. First exploration of economic carrying capacity[J]. Ecological Economy,2012(2):31-34. [7] 徐子媖.区域资源环境的经济承载力研究[J]. 经济研究导刊,2017(22):43-45. doi: 10.3969/j.issn.1673-291X.2017.22.022 [8] 杨凯凯. 西部小城镇社会承载力研究: 以甘肃省文县碧口镇和四川省青川县清溪镇为例[D]. 兰州: 兰州大学, 2013. [9] TEHRANI N A, MAKHDOUM M F. Implementing a spatial model of Urban Carrying Capacity Load Number (UCCLN) to monitor the environmental loads of urban ecosystems. Case study: Tehran metropolis[J]. Ecological Indicators,2013,32:197-211. doi: 10.1016/j.ecolind.2013.03.022 [10] 李爽, 刘梅香.西部地区资源环境承载力与经济增长协调度分析: 以陕西省为例[J]. 西安财经学院学报,2015,28(5):46-53.LI S, LIU M X. Measure analysis of coordinated development between carrying capacity of resources and environment economic growth for the western region: taking Shaanxi as an example[J]. Journal of Xi'an University of Finance and Economics,2015,28(5):46-53. [11] DORINI F A, CECCONELLO M S, DORINI L B. On the logistic equation subject to uncertainties in the environmental carrying capacity and initial population density[J]. Communications in Nonlinear Science and Numerical Simulation,2016,33:160-173. doi: 10.1016/j.cnsns.2015.09.009 [12] KLUGER L C, FILGUEIRA R, BYRON C J. Using media analysis to scope priorities in social carrying capacity assessments: a global perspective[J]. Marine Policy,2019,99:252-261. doi: 10.1016/j.marpol.2018.10.042 [13] 韩帅帅, 狄乾斌.产业结构变动对城市经济承载力增长的贡献: 以辽宁省14个城市为例[J]. 地域研究与开发,2017,36(4):37-42. doi: 10.3969/j.issn.1003-2363.2017.04.007HAN S S, DI Q B. Contribution of industrial structure change to urban economic carrying capacity growth: a case study of fourteen cities of Liaoning Province[J]. Areal Research and Development,2017,36(4):37-42. doi: 10.3969/j.issn.1003-2363.2017.04.007 [14] 肖良武.城市经济承载力评价与政策选择研究: 以贵州省为例[J]. 贵阳学院学报(社会科学版),2019,14(2):53-60.XIAO L W. Research on urban economic carrying capacity evaluation and policy choice: taking Guizhou Province as an example[J]. Journal of Guiyang University (Social Sciences),2019,14(2):53-60. [15] 刘蕾. 区域资源环境承载力评价与国土规划开发战略选择研究: 以皖江城市带为例[M]. 北京: 人民出版社, 2013. -

 下载:
下载:

 点击查看大图
计量
- 文章访问数: 191
- HTML全文浏览量: 206
- PDF下载量: 26
- 被引次数: 0