

Dynamic evaluation and driving mechanism of natural capital occupation in Shanxi mining areas of the Yellow River Basin
-
摘要:
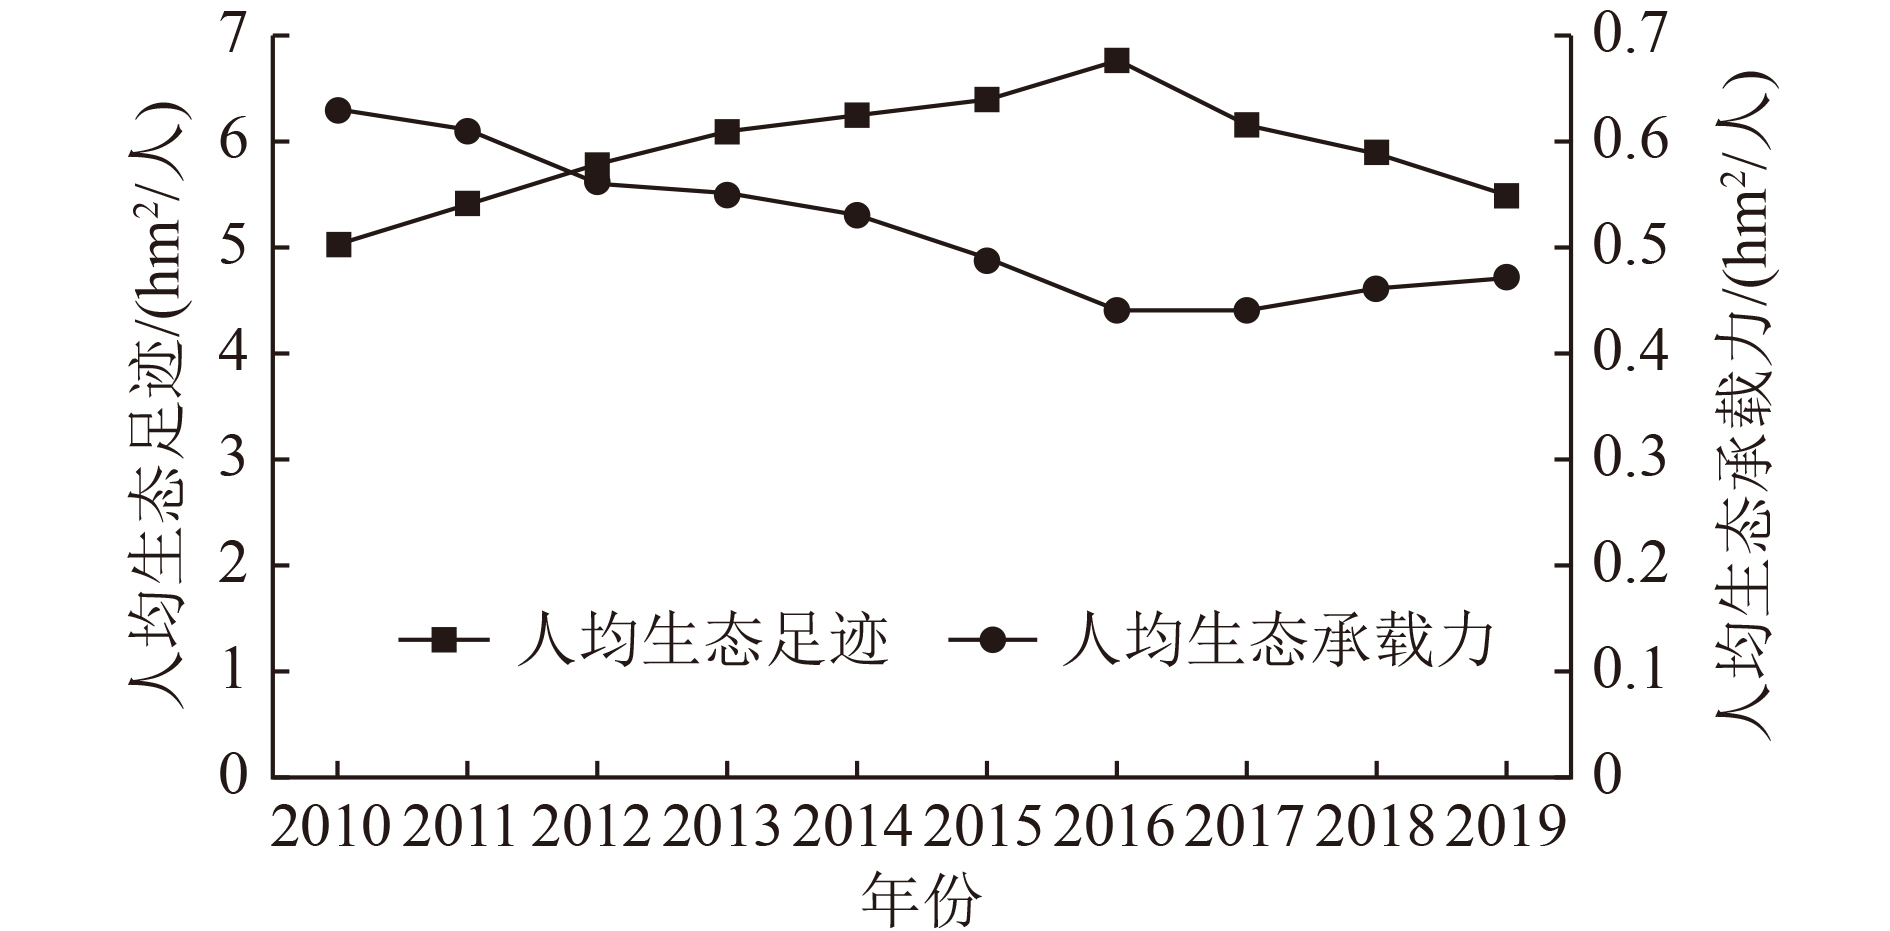
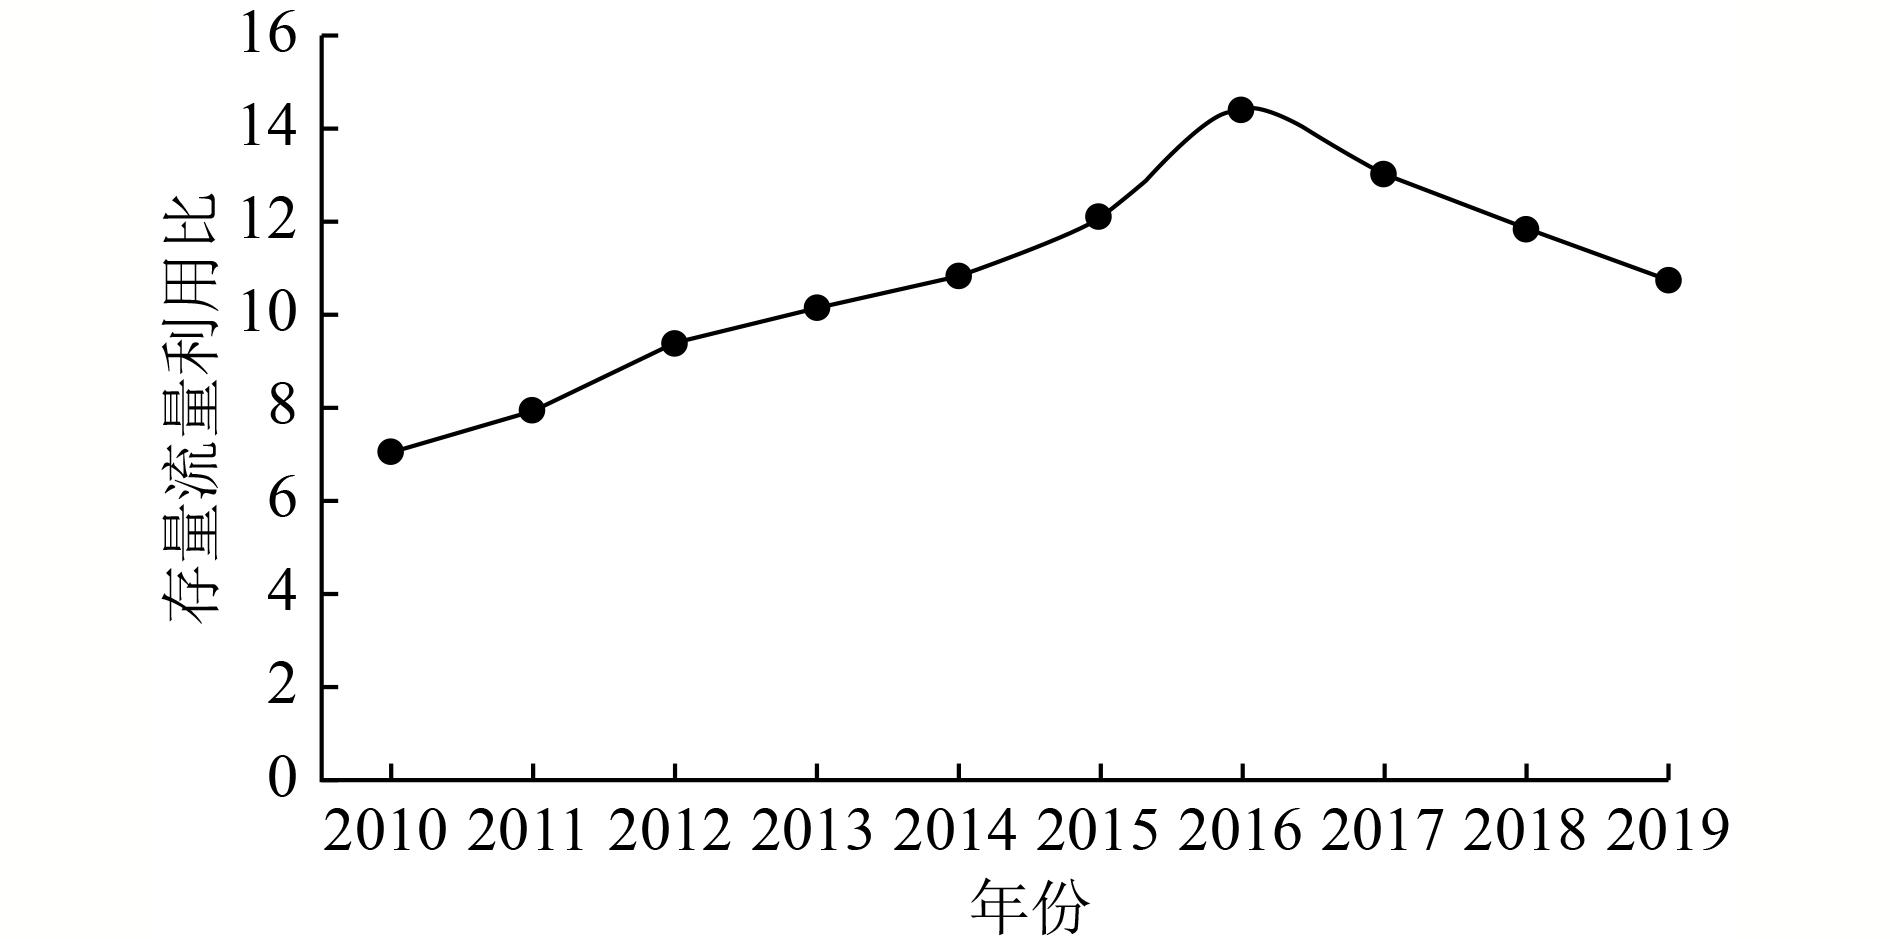
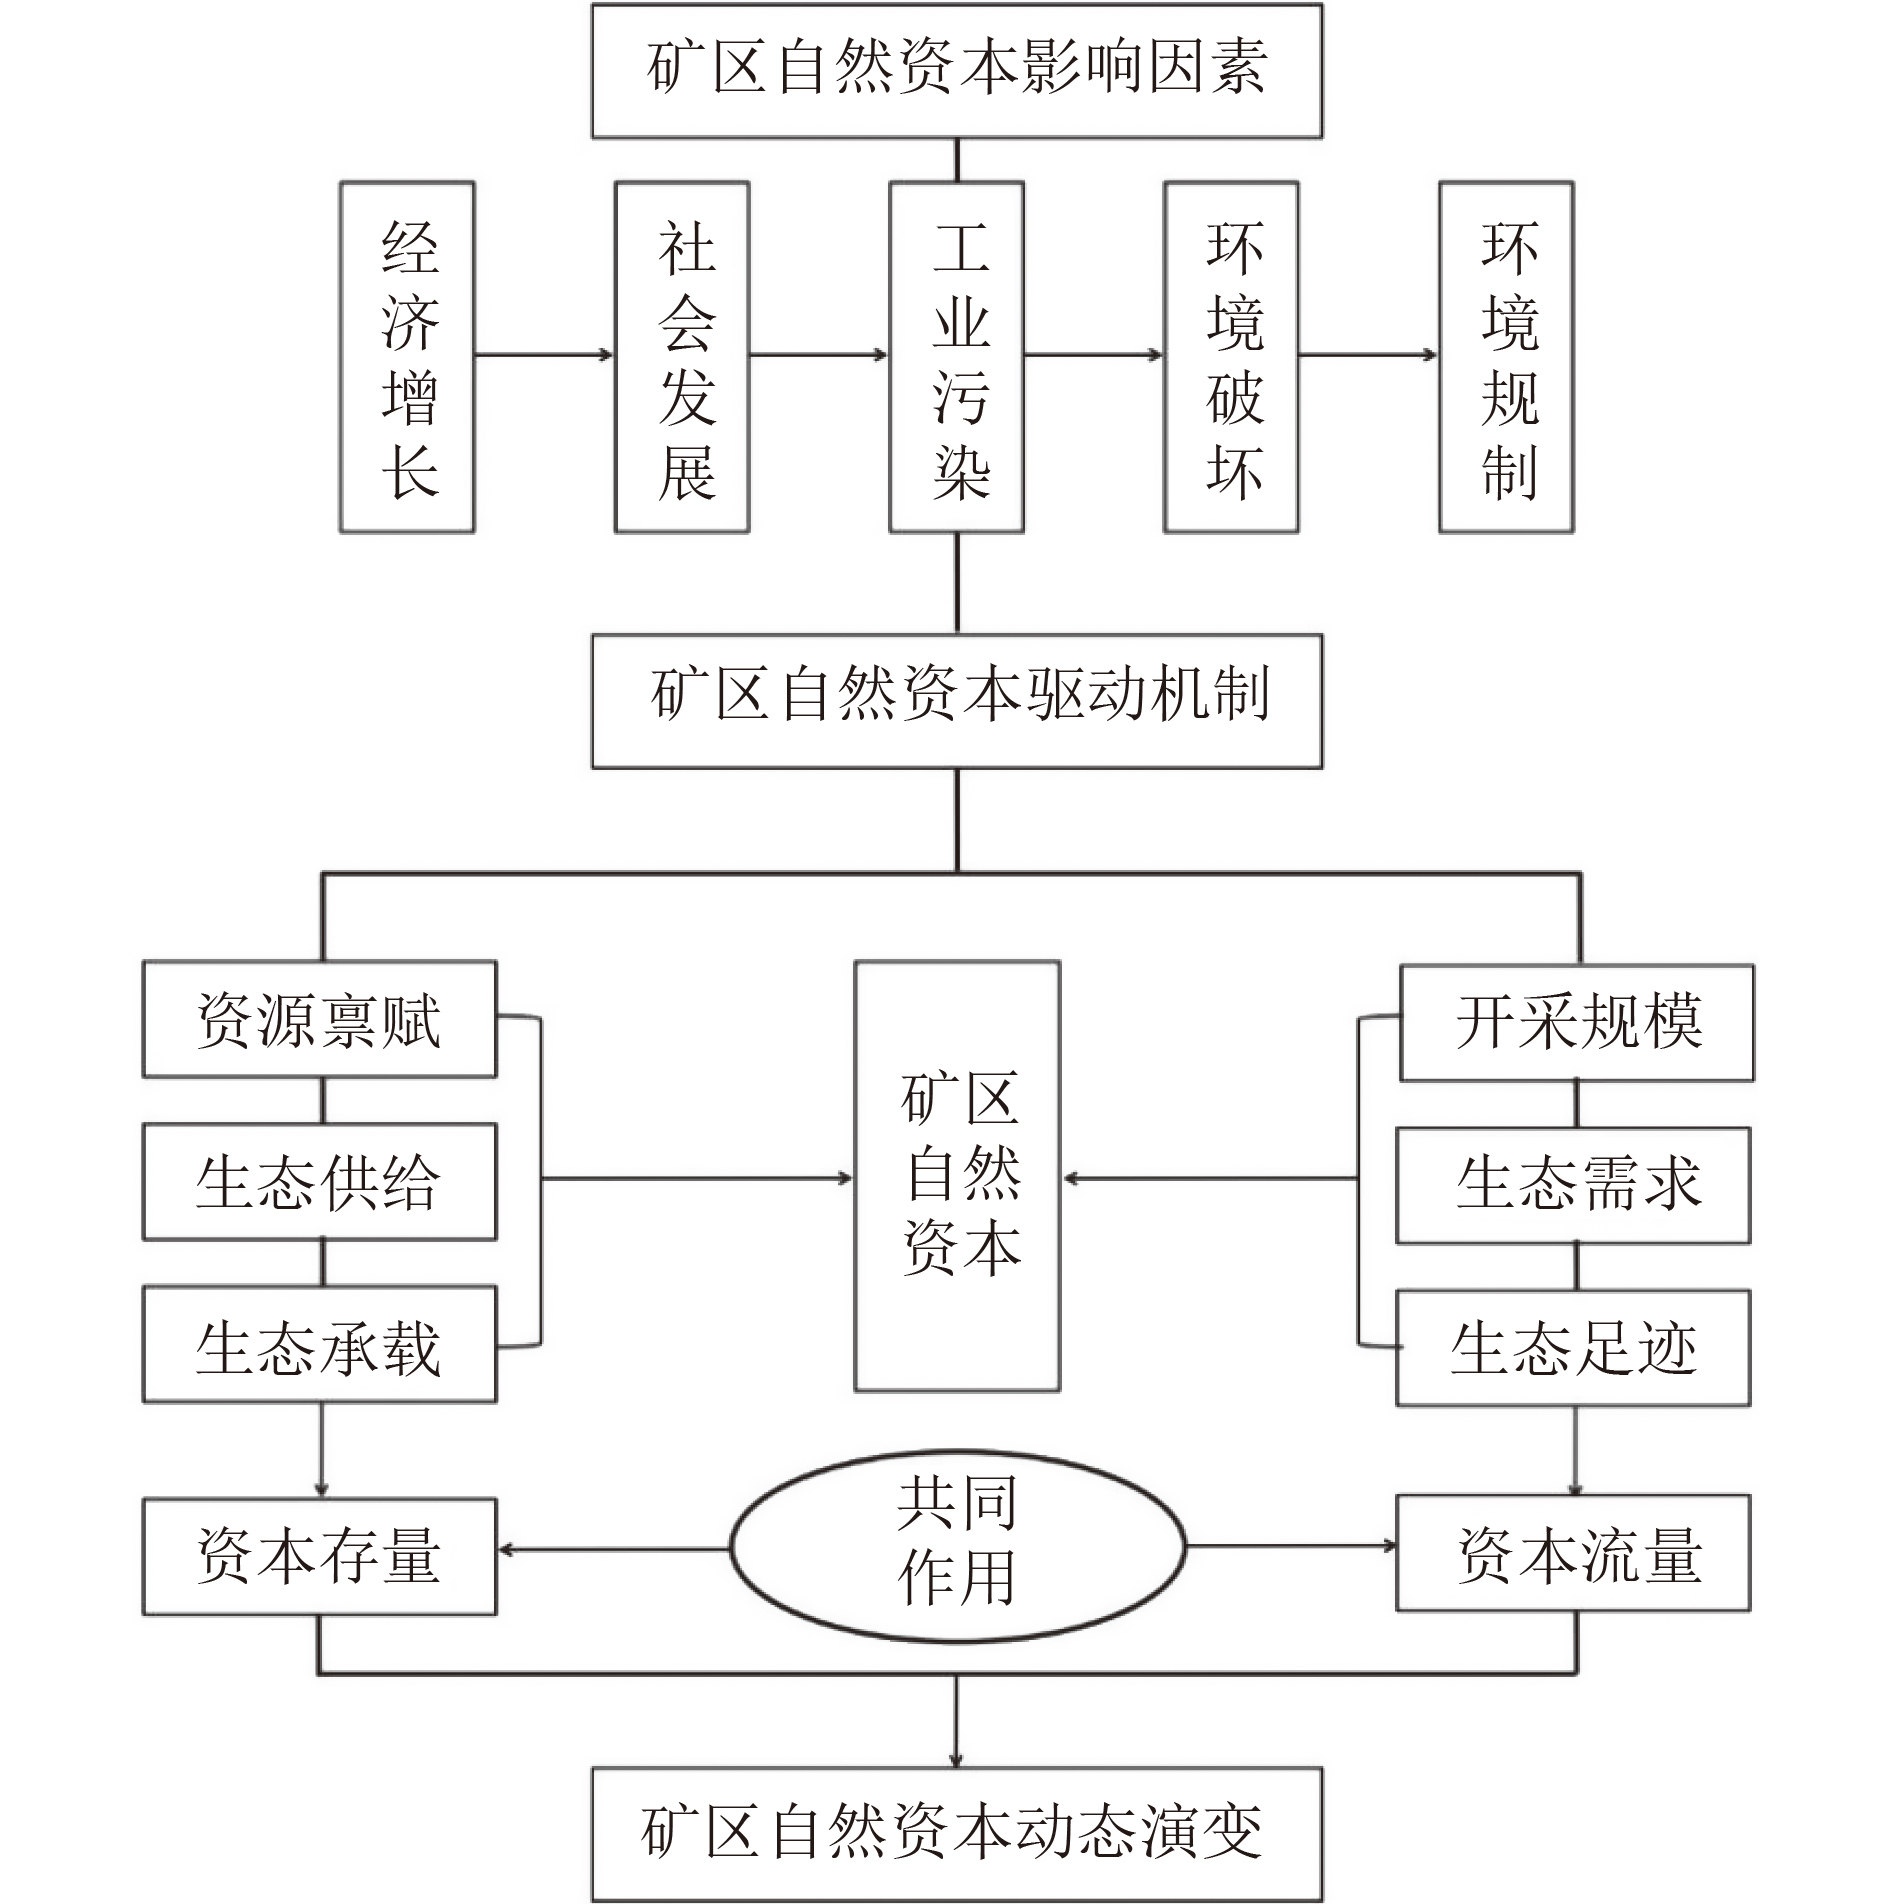
自然资本是经济社会绿色可持续发展的必要保障,对其进行评估是维持区域生态系统平衡的重要内容。以矿区自然资本为视角,运用三维生态足迹模型,测算黄河流域山西矿区生态足迹深度与广度并分析其变化特征,进一步阐释矿区生态占用动态演变的作用机理。结果表明:黄河流域山西矿区人均生态赤字由2010年的4.40 hm2/人增至2016年的6.31 hm2/人,随后降至2019年的5.02 hm2/人,生态足迹与生态承载力的差距总体趋于缩小。2010—2019年,人均生态足迹广度大致呈递减趋势,由0.63 hm2/人降到0.47 hm2/人,而人均生态足迹深度呈现出先增后减的倒U型变化趋势。黄河流域山西矿区自然资本时空动态演变过程的驱动机制是由生态环境供给、资源禀赋、社会发展、经济增长、能源损耗以及煤炭污染等诸多因素共同作用的结果。其中,煤炭污染、能源损耗、资源禀赋和经济增长中的第二产业增加值与矿区自然资本占用动态演变呈正相关,生态环境供给、社会发展中的环境规制指数与其呈负相关。总之,黄河流域山西矿区生态足迹与生态承载力的差距趋于缩小,但生态占用赤字仍然存在。
Abstract:Natural capital is a necessary guarantee for the green and sustainable development of the economy and society, and its assessment is an important part of maintaining the balance of the regional ecosystem. From the perspective of natural capital for the mining areas, a three-dimensional ecological footprint model was used to calculate the depth and breadth of the ecological footprint of Shanxi mining areas in the Yellow River Basin, its dynamic evolution characteristics were analyzed, and the mechanism of the dynamic evolution of the ecological occupation of the mining areas was further explained. The results showed that: the per capita ecological deficit of Shanxi mining areas in the Yellow River Basin increased from 4.40 hm2 in 2010 to 6.31 hm2 in 2016, and then decreased to 5.02 hm2 in 2019. The gap between ecological footprint and ecological carrying capacity tended to narrow overall. The breadth of the per capita ecological footprint generally showed a declining trend, from 0.63 hm2 in 2020 to 0.47 hm2 in 2019, and the depth of the per capita ecological footprint showed an inverted U-shaped change trend that first increased and then decreased. The driving mechanism of the spatiotemporal dynamic evolution process of natural capital in Shanxi mining areas in the Yellow River Basin was driven by many factors such as ecological environment supply, resource endowment, social development, economic growth, energy loss and coal pollution. The dynamic evolution of natural capital occupation was positively correlated with coal pollution, energy loss, resource endowment and the secondary industry added value of economic growth, and negatively correlated with ecological environment supply and the environmental regulations of social development. The gap between the ecological footprint and carrying capacity of Shanxi mining areas in the Yellow River Basin tended to improve, but the ecological occupation deficit still existed.
-

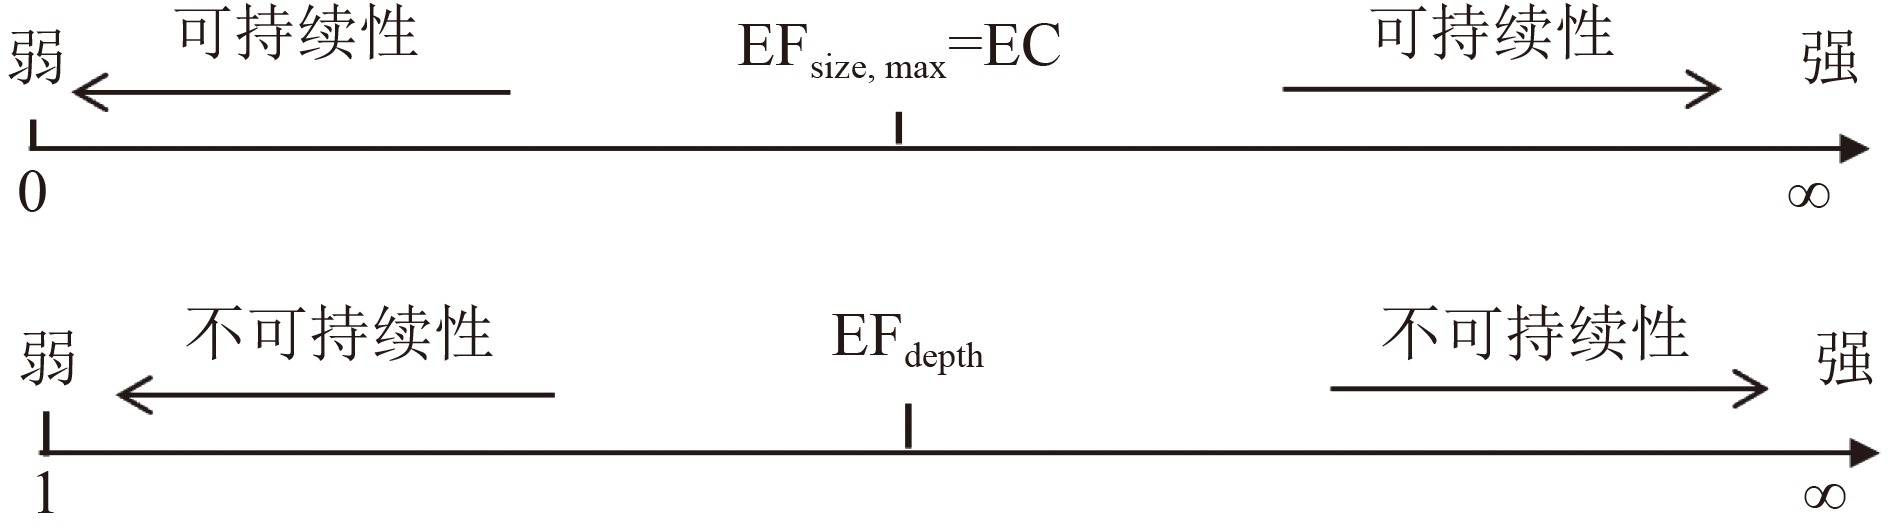
图 2 自然资本广度与深度的物理意义[22]
Figure 2. Physical meanings of depth and size of natural capital

图 3 2010—2019年黄河流域山西矿区人均生态足迹与人均生态承载力变化趋势
Figure 3. Change trend between per capita ecological footprint and per capita ecological carrying capacity of Shanxi mining areas in the Yellow River Basin from 2010 to 2019

图 4 2010—2019年黄河流域山西矿区存量流量利用比
Figure 4. Utilization ratio of stock flows of Shanxi mining areas in the Yellow River Basin from 2010 to 2019

图 5 黄河流域山西矿区生态占用演化的作用机理
Figure 5. Action mechanism of ecological occupation evolution of Shanxi mining areas in the Yellow River Basin
表 1 2019年黄河流域山西矿区不同土地利用类型面积
Table 1. Area of different land types in Shanxi mining areas of the Yellow River Basin in 2019
万hm2 土地
利用类型西山
矿区大同
矿区沁水
矿区宁武
矿区霍西
矿区河东
矿区均衡
因子产量
因子耕地 0.23 7.12 68.57 4.76 20.19 43.28 2.80 1.66 草地 6.88 3.00 29.35 7.44 13.20 32.10 0.50 0.91 林地 11.03 5.90 180.24 17.62 24.77 61.34 1.10 0.19 水域 0.22 0.21 1.49 0.16 0.37 0.62 0.20 1.00 建筑
用地0.18 0.62 11.07 0.37 1.68 6.21 2.80 0.60 化石能
源用地0.24 0.96 14.28 0.52 2.35 8.91 1.11 1.00 总计 18.78 17.81 305.00 30.87 62.56 152.46  下载: 导出CSV
表 2 黄河流域山西矿区自然资本占用动态演变的驱动因素
Table 2. Driving factors of the dynamic evolution for ecological capital occupation in Shanxi mining areas of the Yellow River Basin
下载: 导出CSV
表 3 2010—2019年黄河流域山西矿区人均生态足迹深度与广度
Table 3. Per capita ecological footprint depth and size of Shanxi mining areas in the Yellow River Basin from 2010 to 2019
hm2/人 年份 人均生态赤字 人均生态足迹广度 人均生态足迹深度 2010 4.40 0.63 7.98 2011 4.80 0.61 8.87 2012 5.22 0.56 10.32 2013 5.54 0.55 11.07 2014 5.71 0.53 11.77 2015 5.90 0.49 13.04 2016 6.31 0.44 15.34 2017 5.70 0.44 13.95 2018 5.42 0.46 12.78 2019 5.02 0.47 11.68
下载: 导出CSV
表 4 2010—2019年黄河流域山西矿区足迹深度与足迹广度剪刀差
Table 4. Scissors difference between footprint depth and footprint size of Shanxi mining areas in the Yellow River Basin from 2010 to 2019
年份 2010 2011 2012 2013 2014 2015 2016 2017 2018 2019 剪刀差 1.13 1.25 1.38 1.43 1.47 1.51 1.56 −1.53 −1.50 −1.48
下载: 导出CSV
表 5 PLS模型回归结果
Table 5. Regression results of PLS model
因变量 常数项 驱动因子 Y 4.753 X1 X2 X3 X4 X5 X6 X7 −0.165 0.147 0.083 0.062 0.027 0.009 −0.110 X8 X9 X10 X11 X12 X13 X14 0.007 0.108 0.013 0.137 0.128 0.174 0.182
下载: 导出CSV
-
[1] 厉以宁.摆脱路径依赖, 在新思路指导下前进[J]. 全国新书目,2018(8):8-9. [2] WACKERNAGEL M, LEWAN L. Evaluating the use of natural captial with the ecological frootprint[J]. AMBIO,1999,28(7):604-612. [3] 张志强, 徐中民, 程国栋.生态足迹的概念及计算模型[J]. 生态经济,2000,16(10):8-10.ZHANG Z Q, XU Z M, CHENG G D. The concept of ecological' footprints' and computer models[J]. Ecological Economy,2000,16(10):8-10. [4] NICCOLUCCI V, BASTIANONI S, TIEZZI E B P, et al. How deep is the footprint: a 3D representation[J]. Ecological Modelling,2009,220(20):2819-2823. doi: 10.1016/j.ecolmodel.2009.07.018 [5] 方恺, Heijungs Reinout.自然资本核算的生态足迹三维模型研究进展[J]. 地理科学进展,2012,31(12):1700-1707. doi: 10.11820/dlkxjz.2012.12.016FANG K, REINOUT H. A review on three-dimensional ecological footprint model for natural capital accounting[J]. Progress in Geography,2012,31(12):1700-1707. doi: 10.11820/dlkxjz.2012.12.016 [6] NICCOLUCCI V, GALLI A, REED A, et al. Towards a 3D national ecological footprint geography[J]. Ecological Modelling,2011,222(16):2939-2944. doi: 10.1016/j.ecolmodel.2011.04.020 [7] 方恺.1999—2008年G20国家自然资本利用的空间格局变化[J]. 资源科学,2014,36(4):793-800.FANG K. Changes in the spatial distribution of natural capital use among G20 countries from 1999 to 2008[J]. Resources Science,2014,36(4):793-800. [8] 秦超, 李君轶, 陈宏飞, 等.基于三维生态足迹的陕西省自然资本动态研究[J]. 干旱区研究,2016,33(4):837-842.QIN C, LI J Y, CHEN H F, et al. Dynamics of natural capital in Shaanxi Province based on the three-dimensional ecological footprint[J]. Arid Zone Research,2016,33(4):837-842. [9] 张俊杰, 范振林, 王翻羽, 等.自然资本核算的中国路径[J]. 中国国土资源经济,2020,33(10):31-38.ZHANG J J, FAN Z L, WANG F Y, et al. The Chinese path of natural capital accounting[J]. Natural Resource Economics of China,2020,33(10):31-38. [10] 谢高地, 曹淑艳.生态足迹方法作为生态系统评估工具的潜力[J]. 资源科学,2006,28(4):8. doi: 10.3321/j.issn:1007-7588.2006.04.005 [11] 程钰, 尹建中, 王建事.黄河三角洲地区自然资本动态演变与影响因素研究[J]. 中国人口·资源与环境,2019,29(4):127-136.CHENG Y, YIN J Z, WANG J S. Research on natural capital evolution and influencing factors in the Yellow River Delta Region[J]. China Population, Resources and Environment,2019,29(4):127-136. [12] 杜悦悦, 彭建, 高阳, 等.基于三维生态足迹的京津冀城市群自然资本可持续利用分析[J]. 地理科学进展,2016,35(10):1186-1196. doi: 10.18306/dlkxjz.2016.10.002DU Y Y, PENG J, GAO Y, et al. Sustainability evaluation of natural capital utilization based on a three-dimensional ecological footprint model: a case study of the Beijing-Tianjin-Hebei Metropolitan region[J]. Progress in Geography,2016,35(10):1186-1196. doi: 10.18306/dlkxjz.2016.10.002 [13] 靳相木, 柳乾坤.基于三维生态足迹模型扩展的土地承载力指数研究: 以温州市为例[J]. 生态学报,2017,37(9):2982-2993.JIN X M, LIU Q K. A nalysis of a land carrying capacity index based on an expanded three-dimensional ecological footprint model: a case study of Wenzhou[J]. Acta Ecologica Sinica,2017,37(9):2982-2993. [14] 吴健生, 李铠杨, 赵宇豪.基于改进三维足迹模型的关中地区土地自然资本利用状况分析[J]. 地理科学进展,2020,39(8):1345-1355. doi: 10.18306/dlkxjz.2020.08.009WU J S, LI K Y, ZHAO Y H. The use of land natural capital in the Guanzhong region based on a revised three-dimensional ecological footprint model[J]. Progress in Geography,2020,39(8):1345-1355. doi: 10.18306/dlkxjz.2020.08.009 [15] 刘勇生. 煤炭开发负外部性及其补偿机制研究[D]. 北京: 北京理工大学, 2014. [16] 薛建春.基于EMD的平朔矿区生态承载力变化及动力学预测分析[J]. 内蒙古农业大学学报(自然科学版),2014,35(5):63-68.XUE J C. Analysis of ecological carrying capacity change and dynamic prediction in Pingshuo Mining based on empirical mode decomposition[J]. Journal of Inner Mongolia Agricultural University (Natural Science Edition),2014,35(5):63-68. [17] 张海莹.负外部成本内部化约束下的煤炭开采税费水平研究[J]. 中国人口·资源与环境,2012,22(2):147-151. doi: 10.3969/J.issn.1002-2104.2012.02.024ZHANG H Y. Research on the lever of tax (fees) during coal mining: based on full internalization of the external costs[J]. China Population, Resources and Environment,2012,22(2):147-151. doi: 10.3969/J.issn.1002-2104.2012.02.024 [18] 霍超.山西煤炭资源分布特征及勘查开发布局研究[J]. 中国煤炭地质,2020,32(9):159-162. doi: 10.3969/j.issn.1674-1803.2020.09.27HUO C. Study on coal resources distribution features and exploration, exploitation layout in Shanxi Province[J]. Coal Geology of China,2020,32(9):159-162. doi: 10.3969/j.issn.1674-1803.2020.09.27 [19] 李小建.山西煤炭工业对周边环境污染及资源破坏的研究[J]. 山西化工,2018,38(3):211-212.LI X J. Study on environmental pollution and resource destruction of Shanxi coal industry[J]. Shanxi Chemical Industry,2018,38(3):211-212. [20] 刘某承, 李文华, 谢高地.基于净初级生产力的中国生态足迹产量因子测算[J]. 生态学杂志,2010,29(3):592-597.LIU M C, LI W H, XIE G D. Estimation of China ecological footprint production coefficient based on net primary productivity[J]. Chinese Journal of Ecology,2010,29(3):592-597. [21] 徐菲. 大同煤矿区农户生态足迹及其对环境的影响[D]. 临汾: 山西师范大学, 2017. [22] 方恺, 高凯, 李焕承.基于三维生态足迹模型优化的自然资本利用国际比较[J]. 地理研究,2013,32(9):1657-1667. doi: 10.11821/dlyj201309008FANG K, GAO K, LI H C. International comparison of natural capital use: a three-dimensional model optimization of ecological footprint[J]. Geographical Research,2013,32(9):1657-1667. doi: 10.11821/dlyj201309008 [23] 吴心怡, 张燕.江苏省自然资源利用时空变化特征及驱动力分析[J]. 环境工程技术学报,2020,10(2):293-302. doi: 10.12153/j.issn.1674-991X.20190080WU X Y, ZHANG Y. Spatiotemporal variation characteristics and driving forces of natural resources utilization in Jiangsu Province[J]. Journal of Environmental Engineering Technology,2020,10(2):293-302. doi: 10.12153/j.issn.1674-991X.20190080 [24] 李翔, 舒俭民.改良生态足迹法在珠海的应用[J]. 环境科学研究,2007,20(3):148-151. doi: 10.3321/j.issn:1001-6929.2007.03.026LI X, SHU J M. Study on the application in Zhuhai with the improved eco-footprint method[J]. Research of Environmental Sciences,2007,20(3):148-151. doi: 10.3321/j.issn:1001-6929.2007.03.026 [25] 刘超, 许月卿, 孙丕苓, 等.基于改进三维生态足迹模型的张家口市生态可持续性评价[J]. 水土保持通报,2016,36(6):169-176.LIU C, XU Y Q, SUN P L, et al. Evaluation of ecological sustainability based on revised three-dimensional model of ecological footprint in Zhangjiakou City[J]. Bulletin of Soil and Water Conservation,2016,36(6):169-176. [26] 董建红, 张志斌, 张怀林, 等.生态脆弱区自然资本可持续利用及驱动机制: 以宁夏为例[J]. 中国人口·资源与环境,2021,31(2):162-173.DONG J H, ZHANG Z B, ZHANG H L, et al. Sustainable utilization and driving mechanism of natural capital in ecologically fragile areas: a case study of Ningxia[J]. China Population, Resources and Environment,2021,31(2):162-173. [27] 傅京燕, 胡瑾, 曹翔.不同来源FDI、环境规制与绿色全要素生产率[J]. 国际贸易问题,2018(7):134-148.FU J Y, HU J, CAO X. Different sources of FDI, environmental regulation and green total factor productivity[J]. Journal of International Trade,2018(7):134-148. [28] 杨怡康, 蒋毓琪, 朱少英.环境规制对山西煤炭经济绿色转型的影响研究[J]. 资源节约与环保,2021(7):126-127. doi: 10.3969/j.issn.1673-2251.2021.07.071 [29] 郑德凤, 刘晓星, 王燕燕, 等.基于三维生态足迹的中国自然资本利用时空演变及驱动力分析[J]. 地理科学进展,2018,37(10):1328-1339. doi: 10.18306/dlkxjz.2018.10.003ZHENG D F, LIU X X, WANG Y Y, et al. Spatiotemporal evolution and driving forces of natural capital utilization in China based on three-dimensional ecological footprint[J]. Progress in Geography,2018,37(10):1328-1339. doi: 10.18306/dlkxjz.2018.10.003 [30] WACKERNAGEL M, ONISTO L, BELLO P, et al. National natural capital accounting with the ecological footprint concept[J]. Ecological Economics,1999,29(3):375-390. doi: 10.1016/S0921-8009(98)90063-5 [31] 杨屹, 胡蝶.生态脆弱区榆林三维生态足迹动态变化及其驱动因素[J]. 自然资源学报,2018,33(7):1204-1217. doi: 10.31497/zrzyxb.20170658YANG Y, HU D. Dynamic changes and driving factors of three dimensional ecological footprint in Yulin[J]. Journal of Natural Resources,2018,33(7):1204-1217. doi: 10.31497/zrzyxb.20170658 [32] 王涛, 司万童, 欧阳琰, 等.陕西某钼矿区土壤重金属污染特征及评价[J]. 环境工程技术学报,2019,9(4):440-446. doi: 10.12153/j.issn.1674-991X.2019.01.080WANG T, SI W T, OUYANG Y, et al. Characteristic and evaluation of soil heavy metals pollution in the molybdenum mine area in Shaanxi[J]. Journal of Environmental Engineering Technology,2019,9(4):440-446. doi: 10.12153/j.issn.1674-991X.2019.01.080 [33] 何绪文, 王宇翔, 房增强, 等.铅锌矿区土壤重金属污染特征及污染风险评价[J]. 环境工程技术学报,2016,6(5):476-483. doi: 10.3969/j.issn.1674-991X.2016.05.070HE X W, WANG Y X, FANG Z Q, et al. Pollution characteristics and pollution risk evaluation of heavy metals in soil of lead-zinc mining area[J]. Journal of Environmental Engineering Technology,2016,6(5):476-483. ⊗ doi: 10.3969/j.issn.1674-991X.2016.05.070 -

 下载:
下载:

 点击查看大图
计量
- 文章访问数: 319
- HTML全文浏览量: 123
- PDF下载量: 12
- 被引次数: 0