

Analysis of ozone pollution characteristics and potential sources of ozone pollution in downwind urban areas affected by coking
-
摘要:
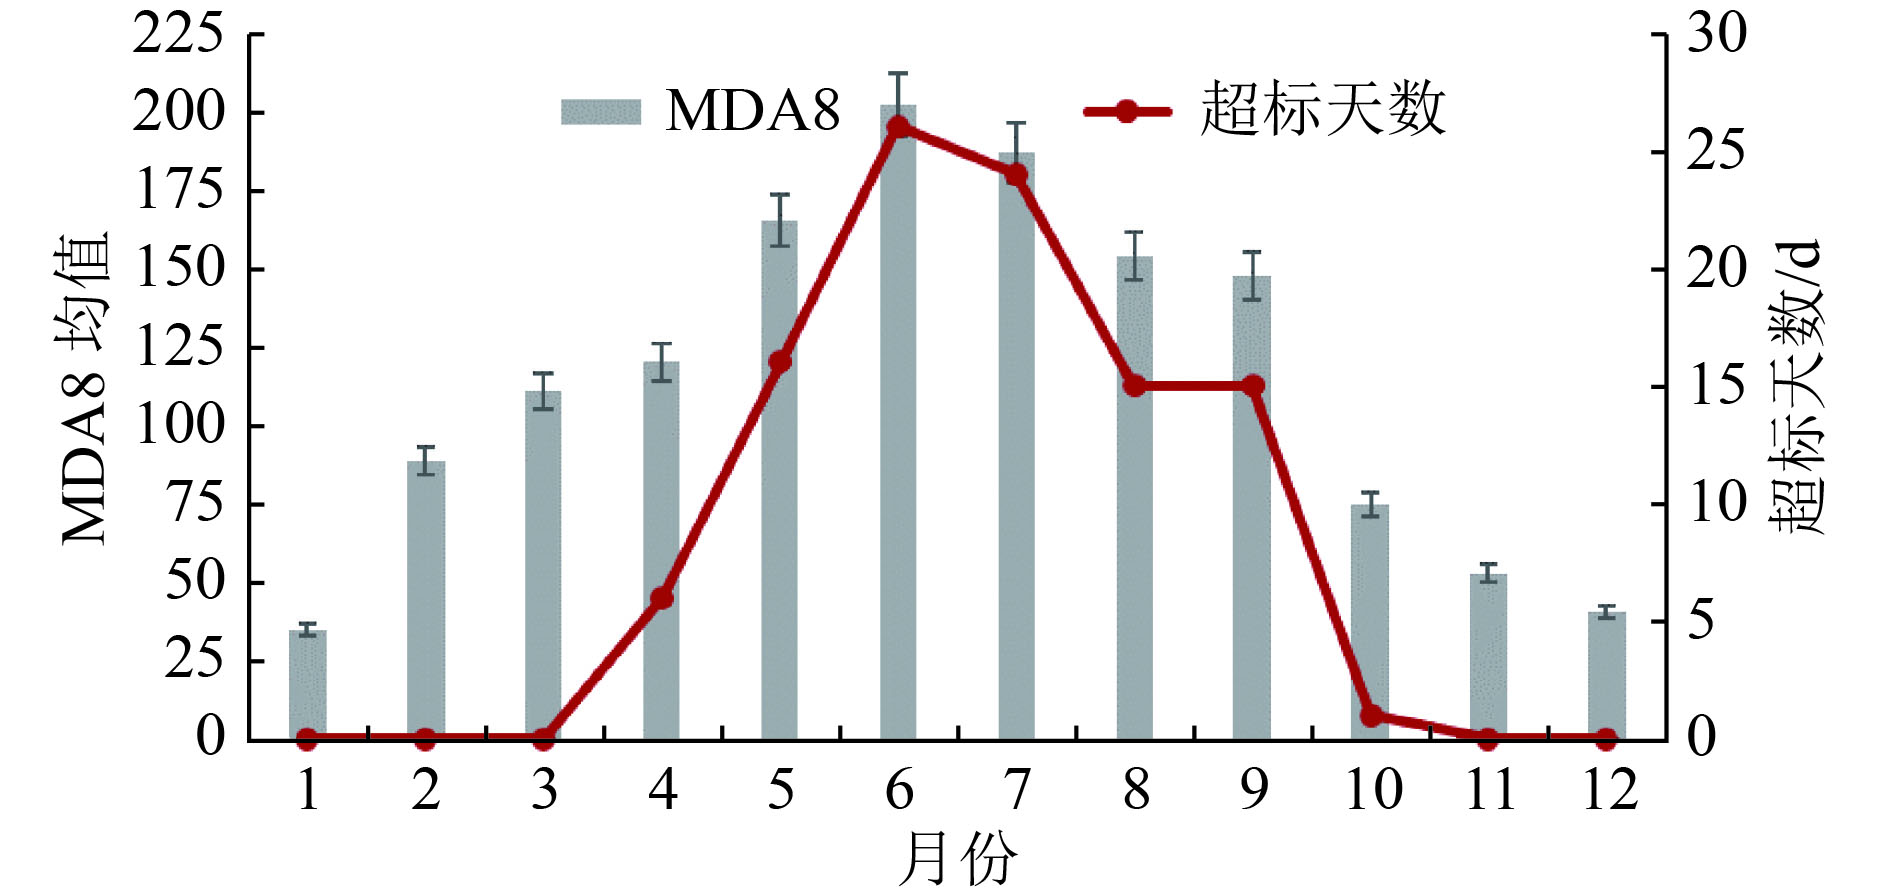
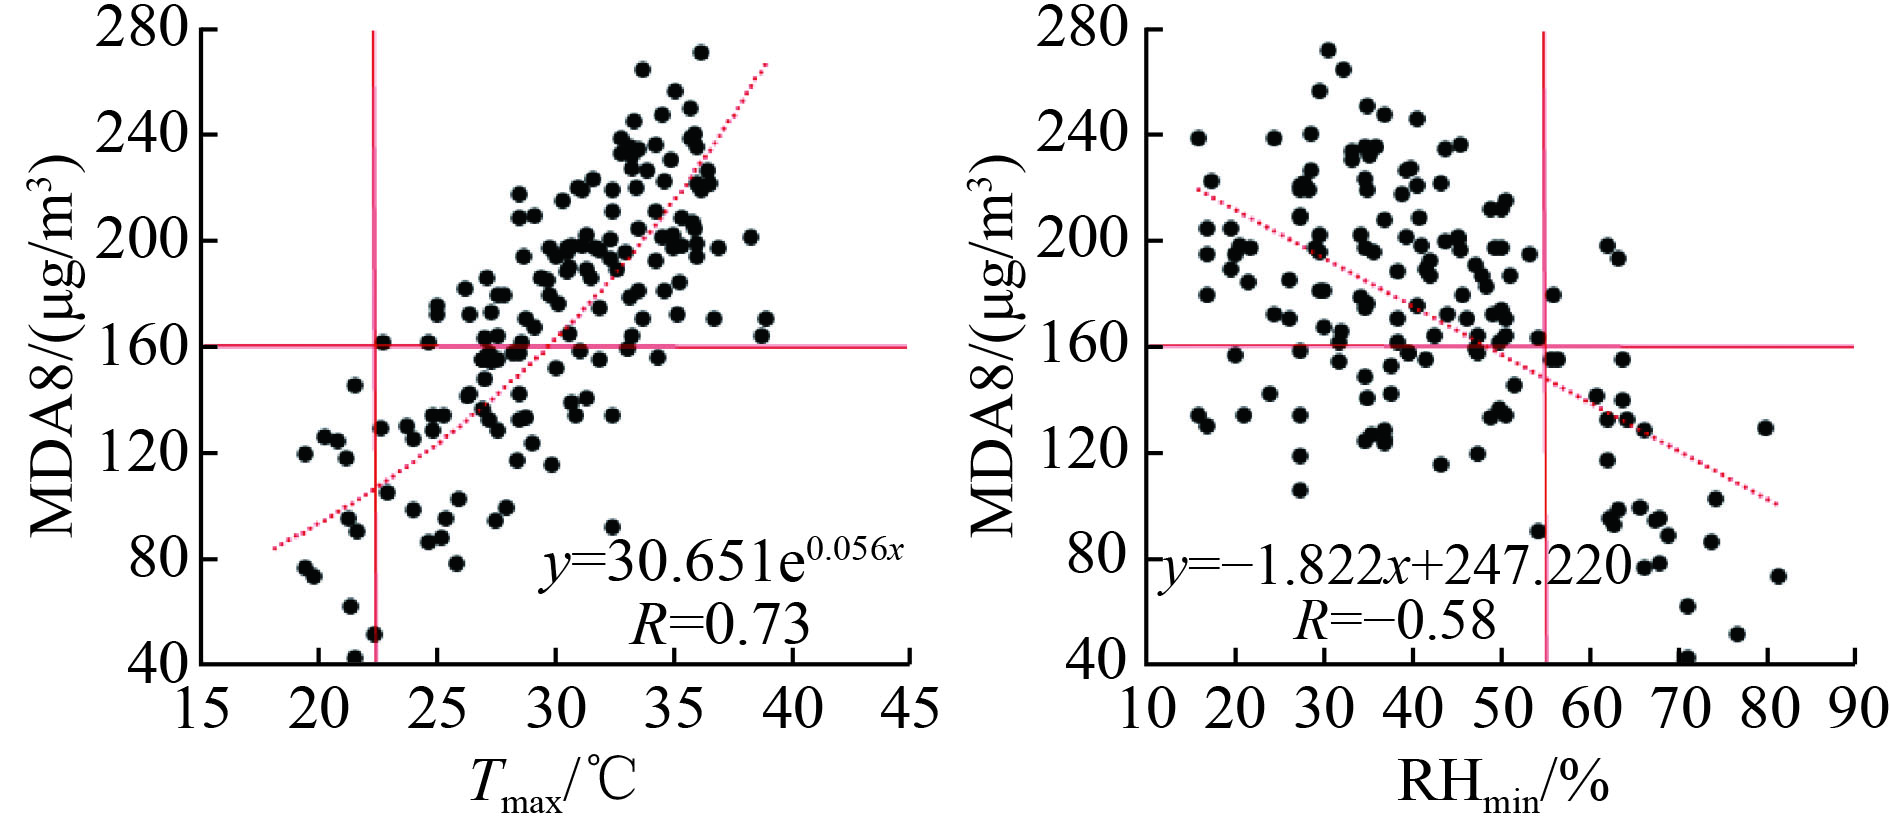
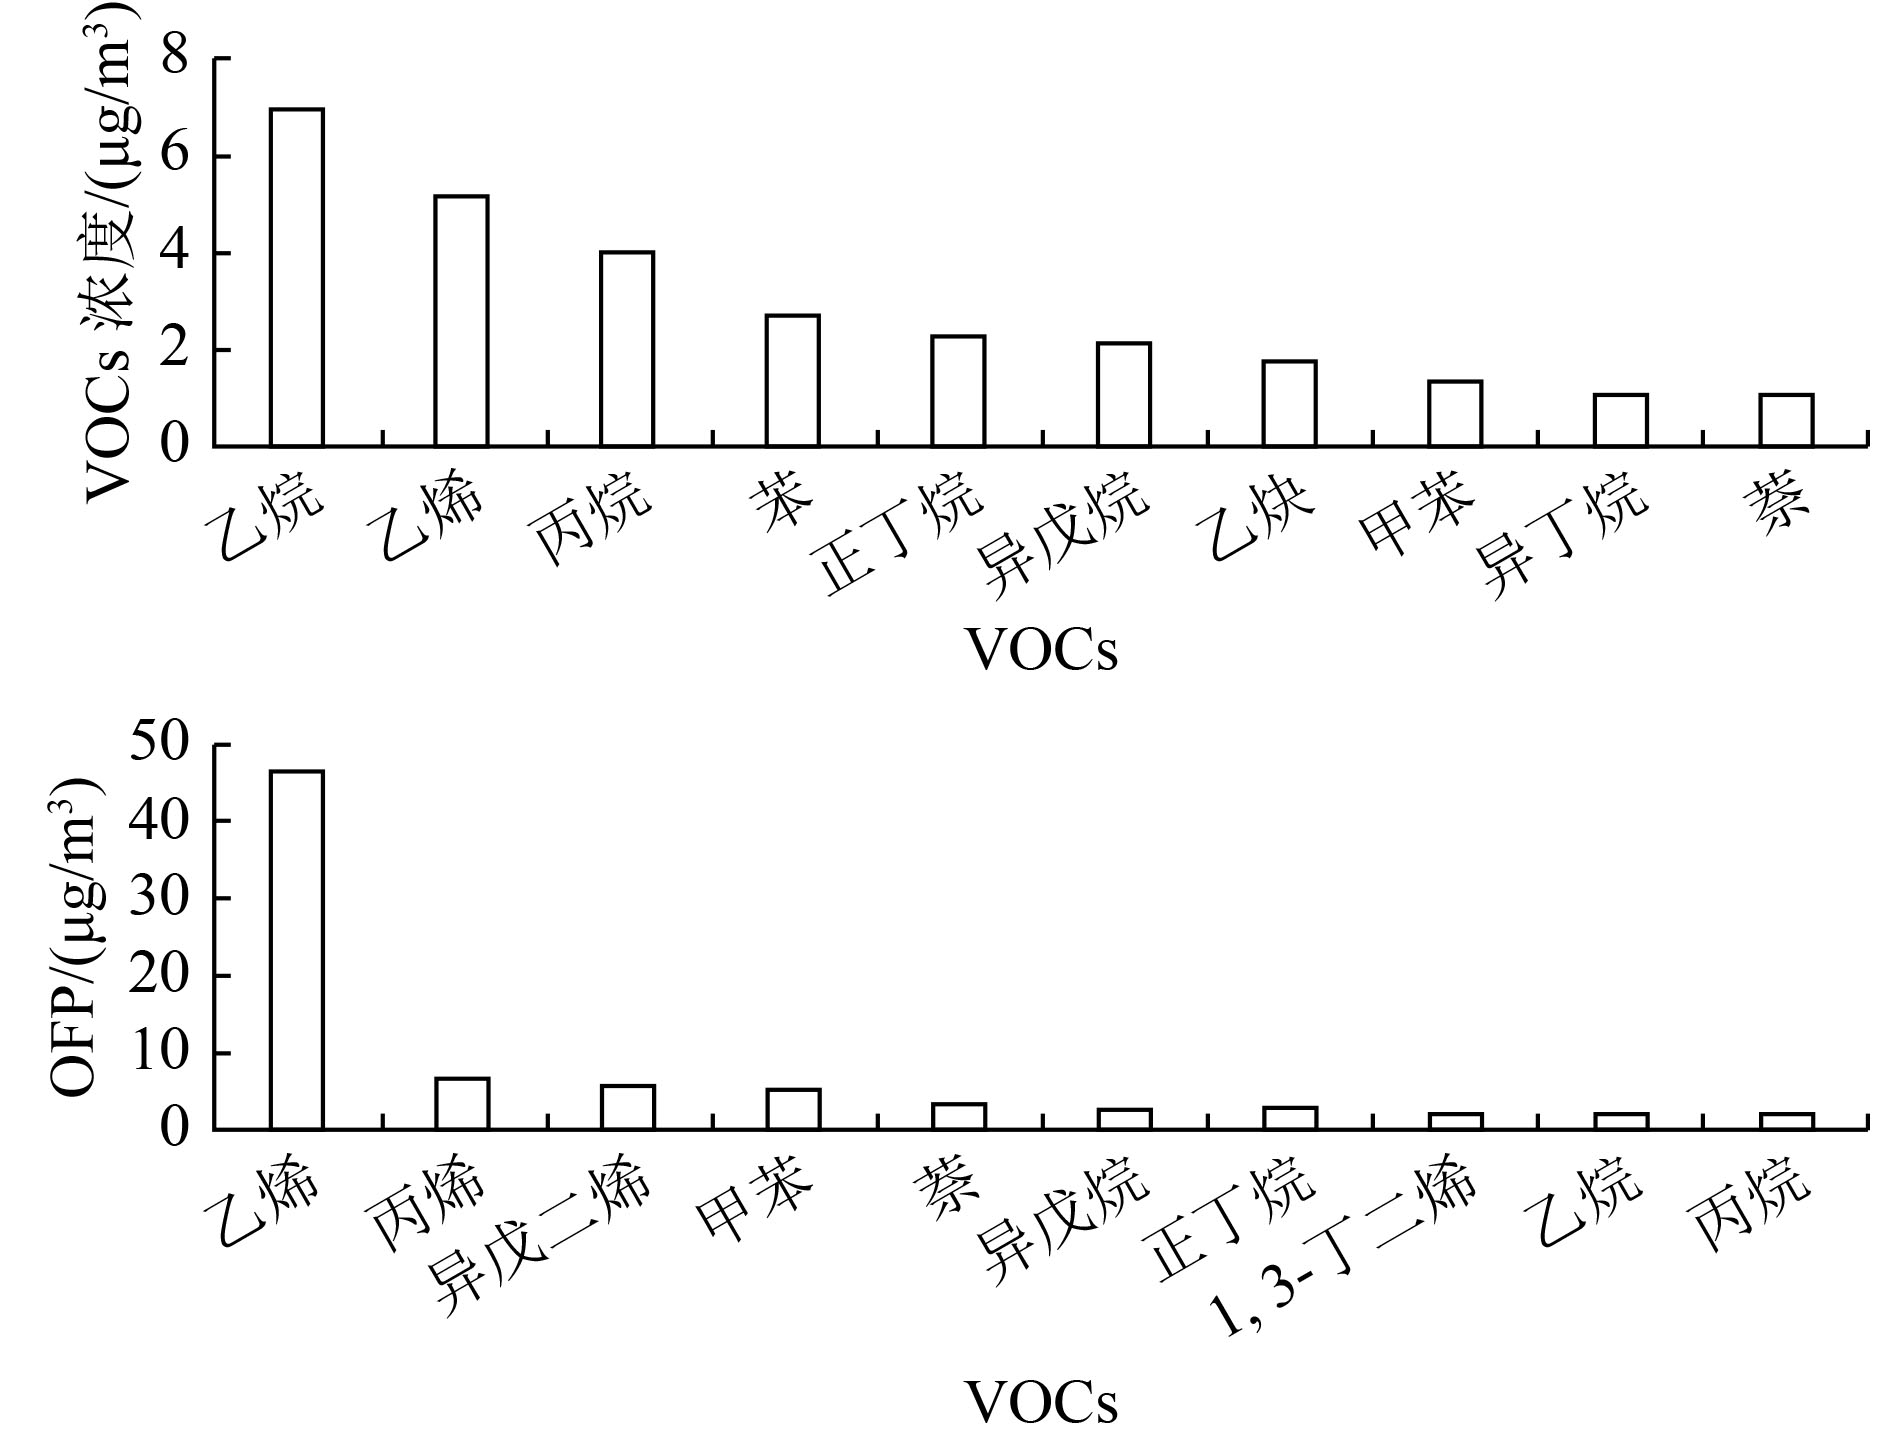
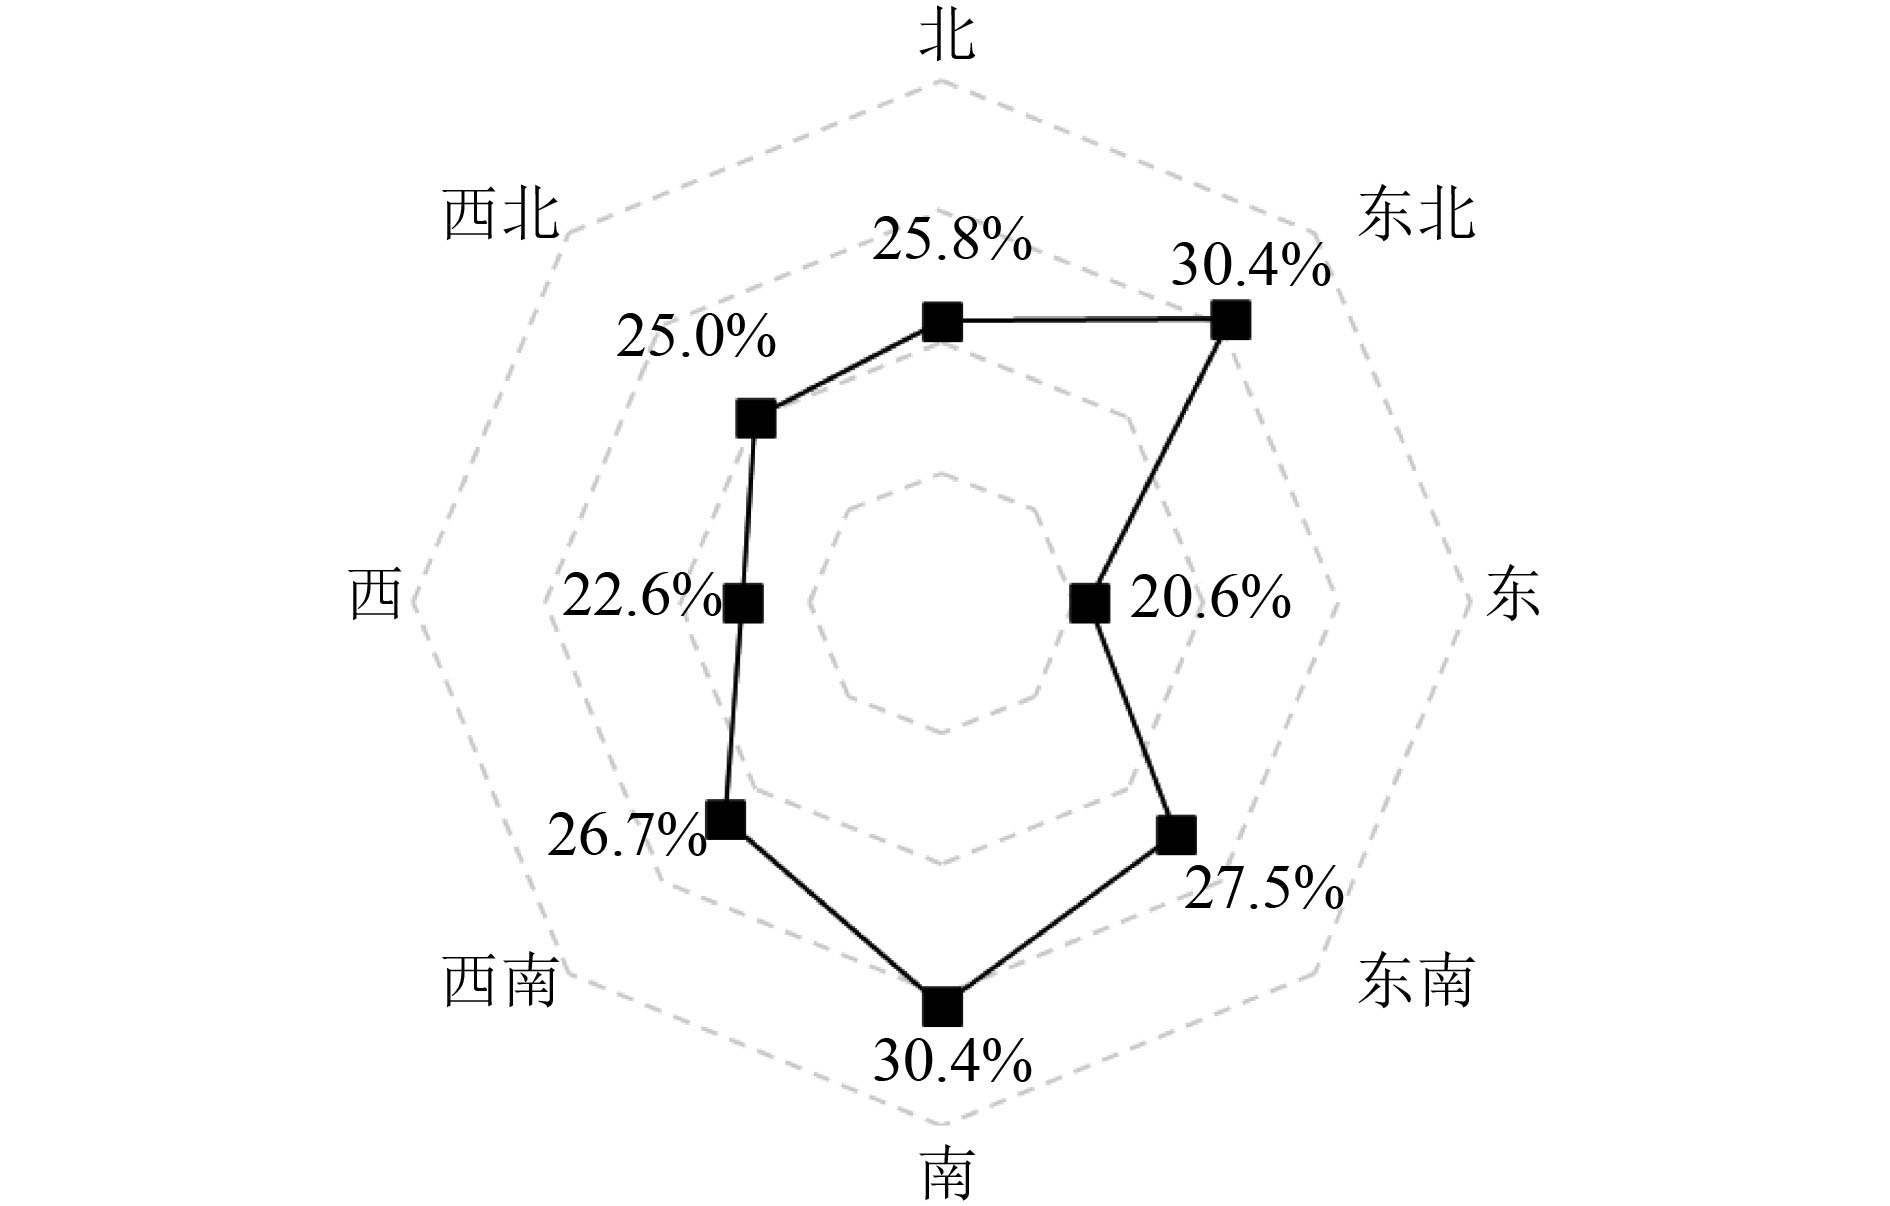
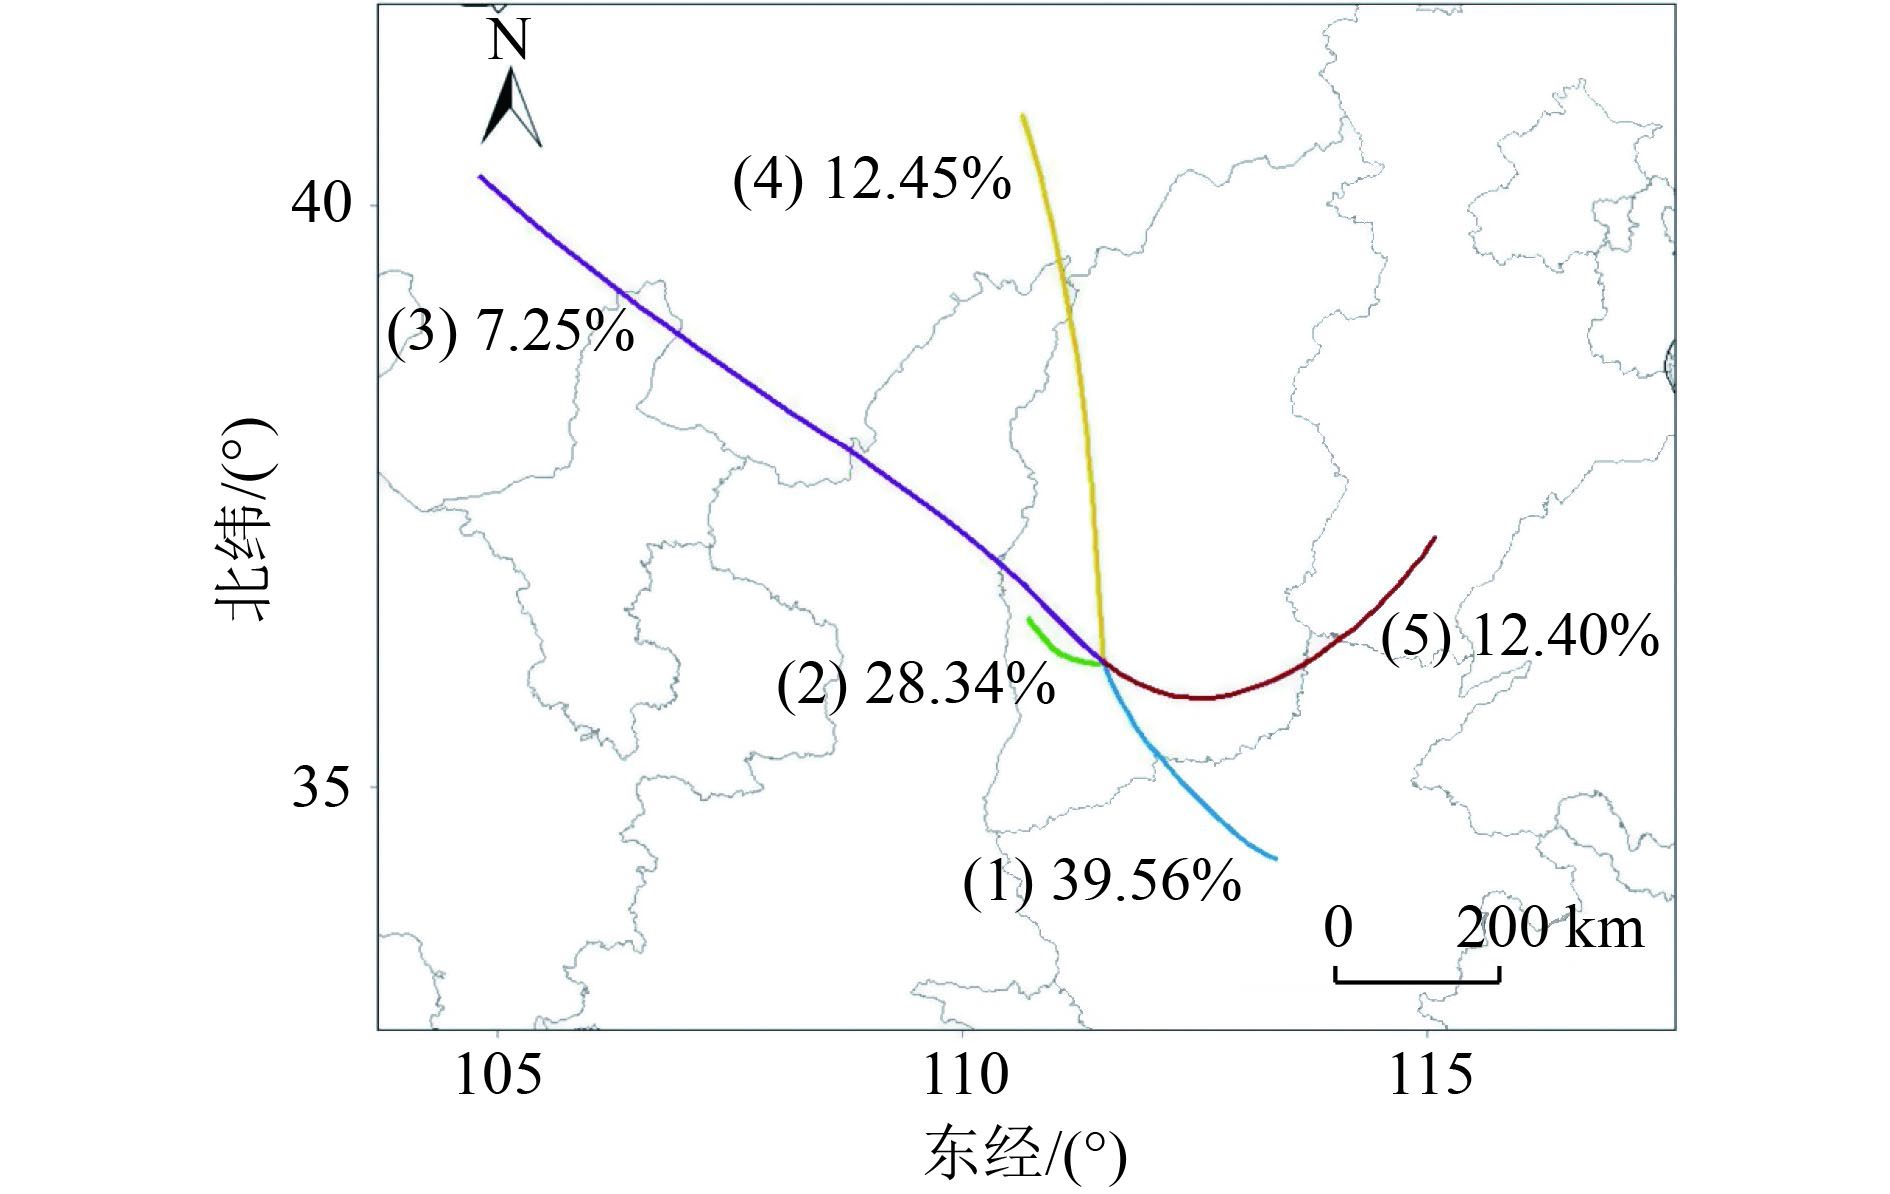
为了解受焦化影响的下风向城区臭氧(O3)的污染特征及来源,基于2019年临汾市6个国控点的O3浓度、气象参数(气温等)以及北大街站点VOCs监测数据开展研究。结果表明:2019年临汾市O3日最大8 h滑动平均值(MDA8)的90百分位数(MDA8-90th)为204 μg/m3,在山西省11个地市中排名第一;全年共有103 d O3浓度超标,且超标天主要集中在5—9月;MDA8从2月开始升高,6月达到最大值,之后逐月下降;O3小时浓度总体呈14:00—16:00出现峰值的单峰日变化。MDA8与日最高气温(Tmax)呈正相关、与日最低相对湿度(RHmin)呈负相关,当Tmax>22 ℃或RHmin<55%时,可能发生O3浓度超标现象。VOCs的O3生成潜势(OFP)分析结果表明,乙烯的OFP最高,占总OFP的44.5%,乙烯是导致O3污染的关键VOCs活性物种;液化石油气(LPG)的使用、机动车尾气和炼焦活动等的排放对临汾市O3污染有重要贡献。6个国控点中,城南和唐尧大酒店对临汾市区所有级别的O3污染贡献均较大,2个站点均有77%的O3超标出现在刮南风和西南风时,其中城南有16.6%的O3超标出现在风速大于3 m/s时,作为焦化典型示踪物的萘在南风向其浓度高于均值的占比为30.4%,表明不合理的工业布局使临汾市区大气受到了焦化区的影响,O3浓度更易在刮南风时超标。临汾市区O3污染除受到本地生成影响外,还受到襄汾县、洪洞县、翼城县和浮山县的焦化企业和钢铁企业排放的含高浓度NOx、VOCs污染气团传输的影响。因此,临汾市在对本地LPG使用和机动车尾气排放进行管控的同时,还要加强与上风向焦化地区的联防联控。
Abstract:In order to understand the pollution characteristics and sources of O3 in downwind urban areas affected by coking, a study was carried out based on the monitoring data of O3 and meteorological parameters (temperature, etc.) at six national monitoring sites in Linfen City, and VOCs at Beidajie site in 2019. The results showed that the 90th percentile (MDA8-90th) of the maximum daily 8-hour moving average (MDA8) of O3 was 204 μg/m3 in Linfen City in 2019, ranking first among 11 cities in Shanxi Province. There were 103 days when O3 concentrations exceeded the standard and were mainly concentrated in May-September; MDA8 began to rise in February, reached the maximum in June, and then decreased month by month; O3 concentration showed a single-peak diurnal variation, with a peak between 14:00 and 16:00. MDA8 was positively correlated with daily maximum temperature (Tmax) and negatively correlated with daily minimum relative humidity (RHmin). When Tmax was greater than 22 ℃ or RHmin was less than 55%, O3 concentration may exceed the standard. The analysis of O3 formation potential (OFP) of VOCs showed that ethylene had the highest OFP, accounting for 44.5% of the total OFP, which was the key active species leading to O3 pollution. The emissions from the use of Liquefied petroleum gas (LPG), vehicle exhaust, and coking activities contributed to O3 pollution in Linfen City. Among the six national monitoring sites, Chengnan and Tangyao Hotel contributed the most of O3 pollution at all levels in Linfen urban area. At both sites, 77% of O3 exceeding the standard concentration occurred when the south and southwest wind was blowing, while16.6% of O3 exceeding the standard concentration at Chengnan site occurred when the wind speed was greater than 3 m/s; the frequency of naphthalene, as a typical tracer of coking, appearing higher than its mean value in the southerly direction was 30.4%, which indicated that the unreasonable industrial layout made the atmosphere in Linfen City affected by the coking area, and O3 concentration was more likely to exceed the standard when the southerly wind blew. The pollution emission in Xiangfen, Hongdong, Yicheng and Fushan counties contributed to O3 pollution in Linfen City. The above results showed that O3 pollution in the urban area of Linfen City was not only affected by the local generation but also by the transportation of polluted air masses containing high concentration of NOx and VOCs emitted by coking and steel plants in the above four counties. Therefore, joint prevention and control with the upwind areas affected by coking should be paid attention to while strengthening the control of local LPG use and vehicle exhaust emissions in Linfen urban area.
-

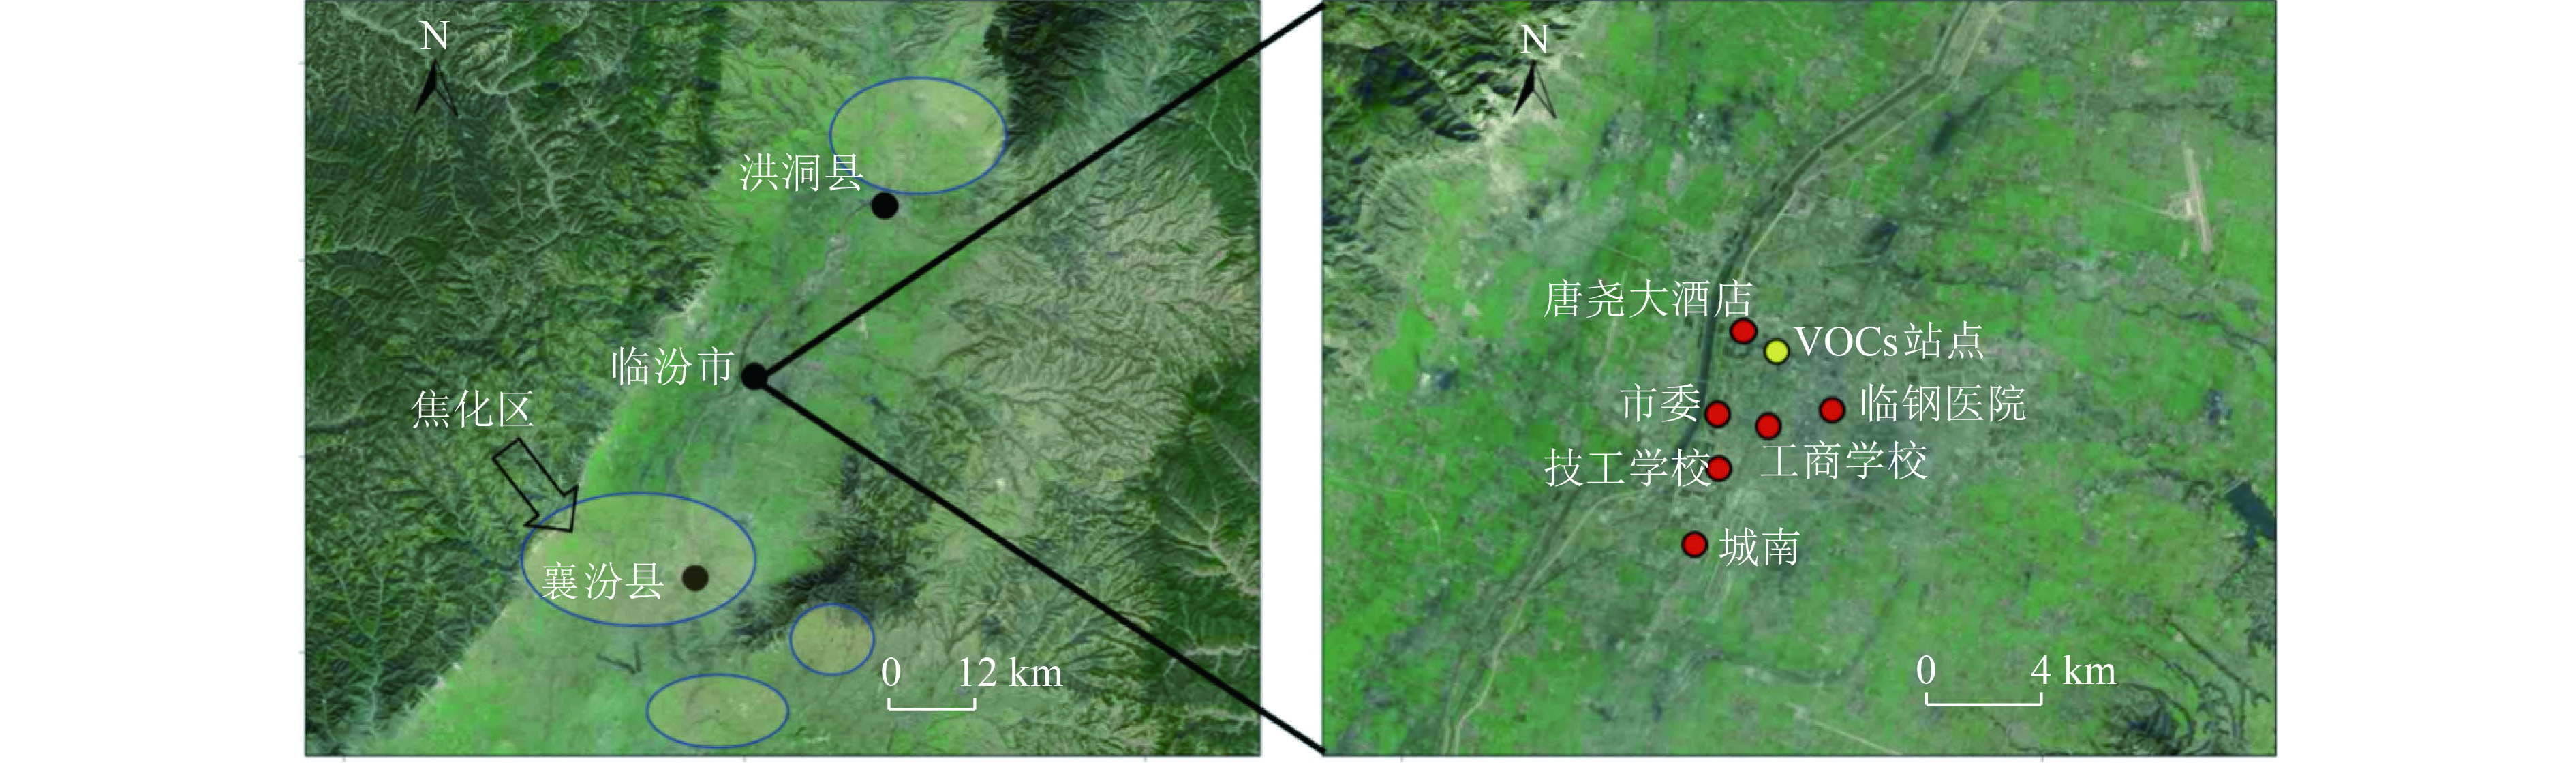
图 1 临汾市地形及焦化区和6个监测点位置分布
Figure 1. Topographic map of Linfen City and coking area and the location of six monitoring sites

图 2 临汾市2019年各月MDA8均值及超标天数
Figure 2. Average values of MDA8 and the days of MDA8 exceeding the standard in each month in 2019 in Linfen City

图 3 2019年5—9月临汾市不同天气条件下O3浓度的日变化
Figure 3. Daily variation of O3 concentrations under different weather conditions from May to September in 2019 in Linfen City

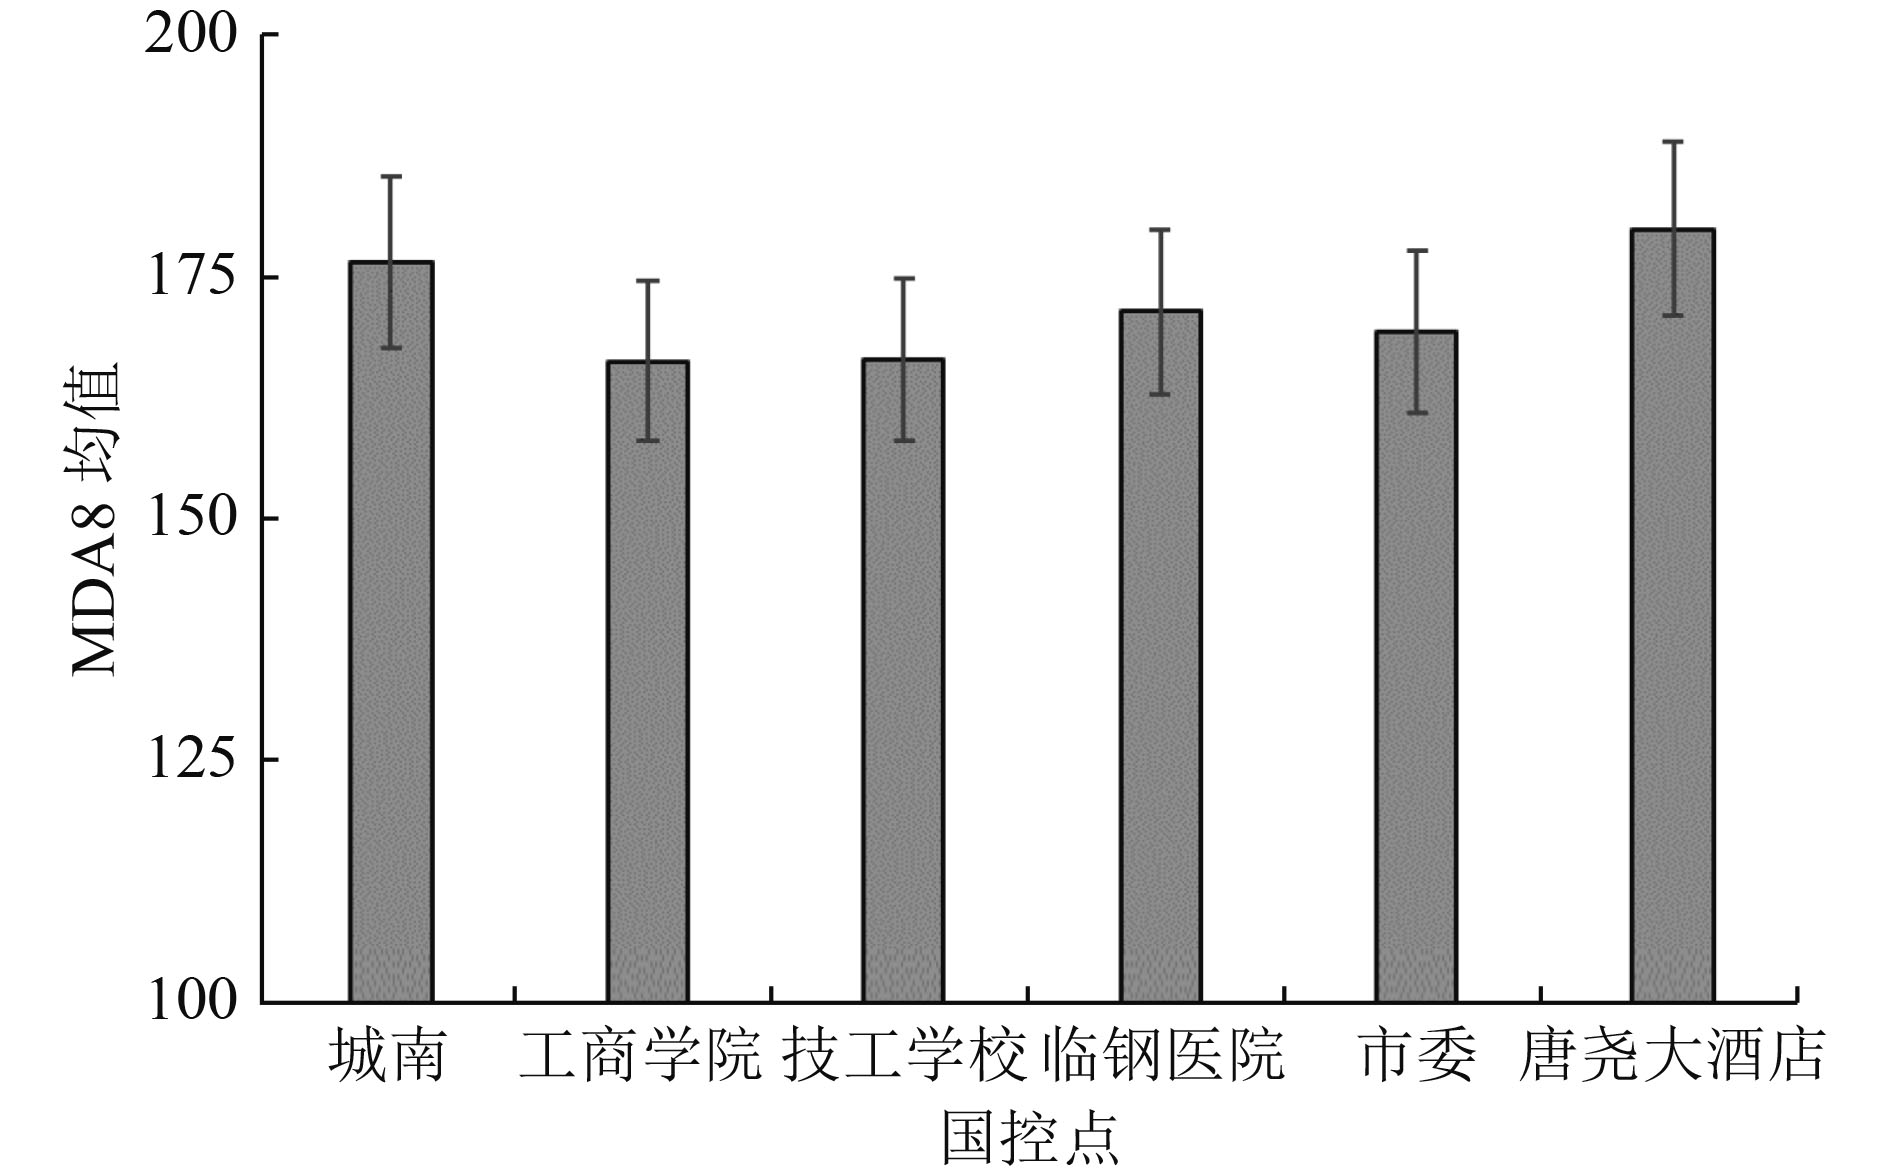
图 4 2019年5—9月临汾市各国控点MDA8均值
Figure 4. Average MDA8 at each monitoring site in Linfen City from May to September in 2019
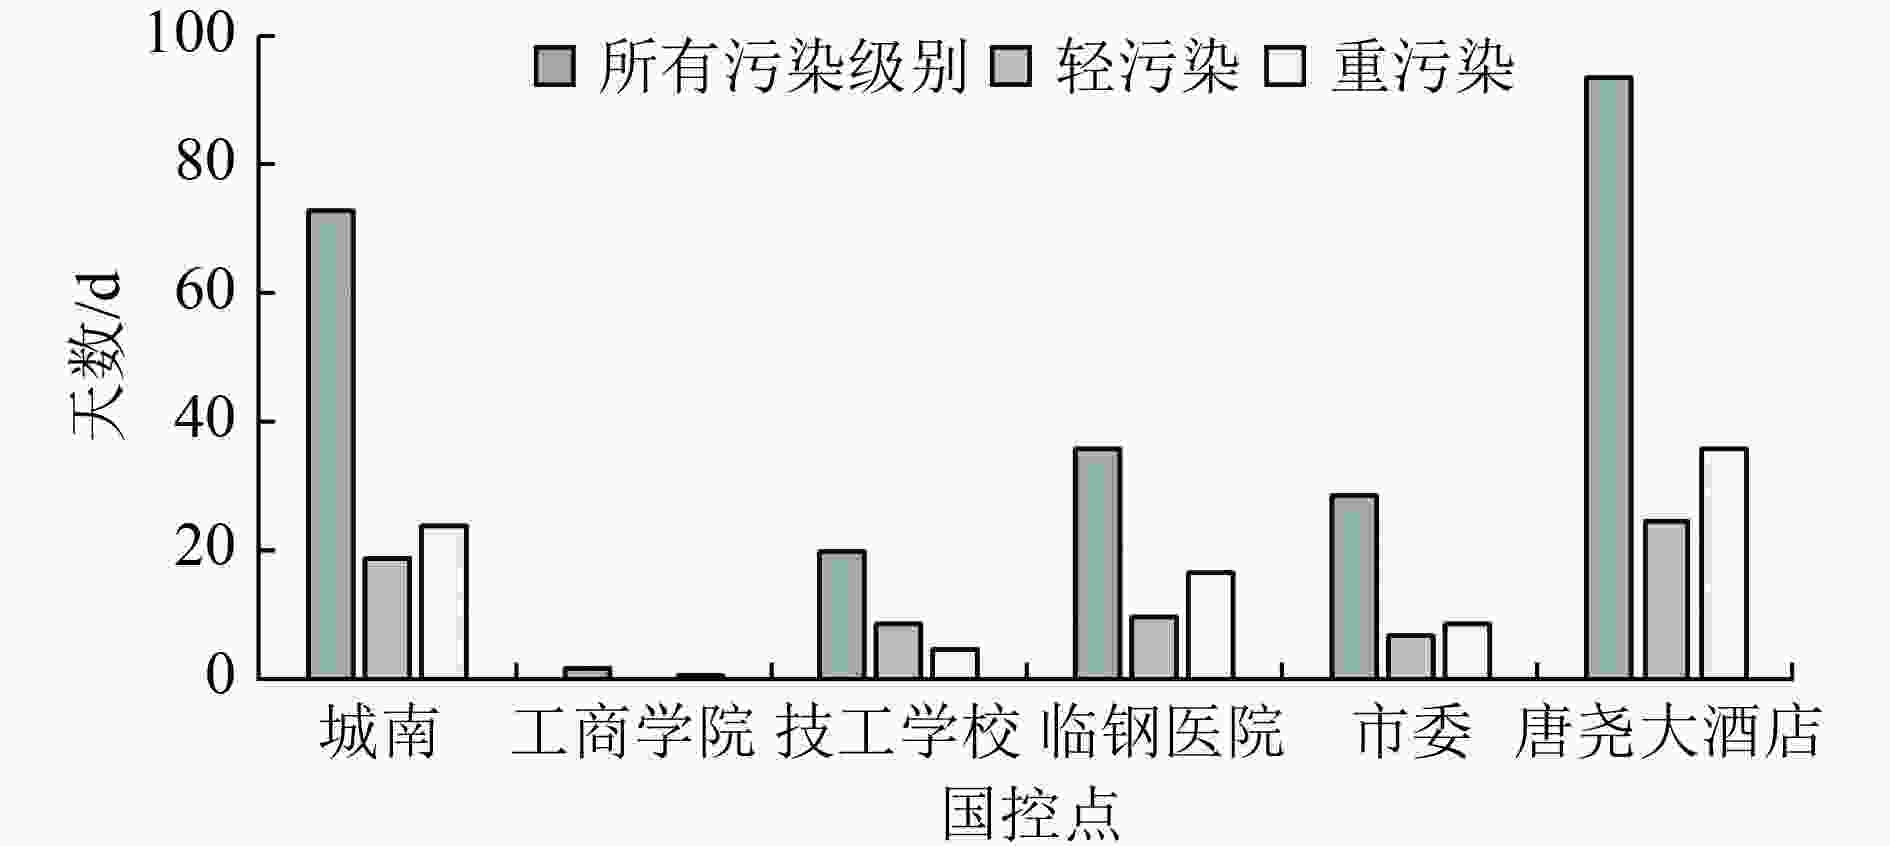
图 5 2019年5—9月不同污染级别下各站点MDA8高于临汾市区MDA8均值的天数
Figure 5. Number of days of each site that MDA8 was higher than the average value of MDA8 in Linfen urban area under different pollution levels from May to September in 2019
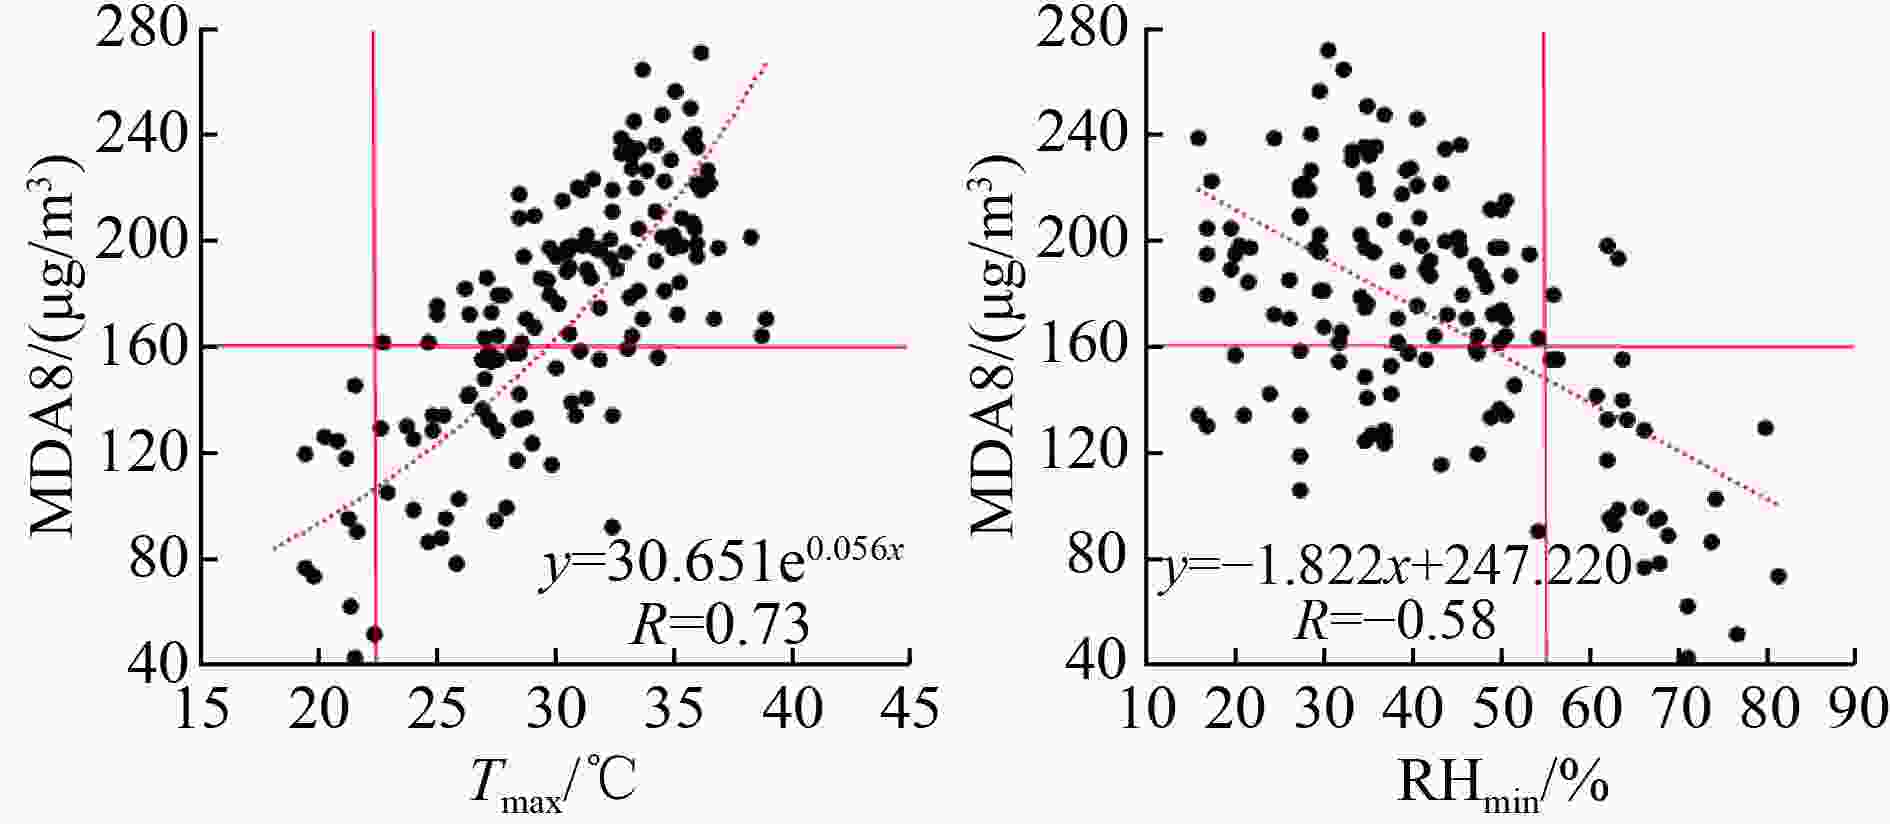
图 6 5—9月临汾市区日最高气温和日最低相对湿度与MDA8的关系
Figure 6. Correlations between MDA8 and Tmax, and RHmin from May to September in Linfen urban area

图 7 2019年7月和9月临汾市区VOCs浓度和OFP排名前10的物种
Figure 7. Top 10 species for VOCs concentration and for OFP in July and September in 2019 in Linfen City

图 8 临汾市区的萘浓度在各个风向高于均值的占比
Figure 8. Proportion of naphthalene concentration above the mean in each wind direction in Linfen City

图 9 2019年5—9月临汾市后向轨迹聚类分析结果
Figure 9. Clustering analysis results of backward trajectory in Linfen City from May to September in 2019

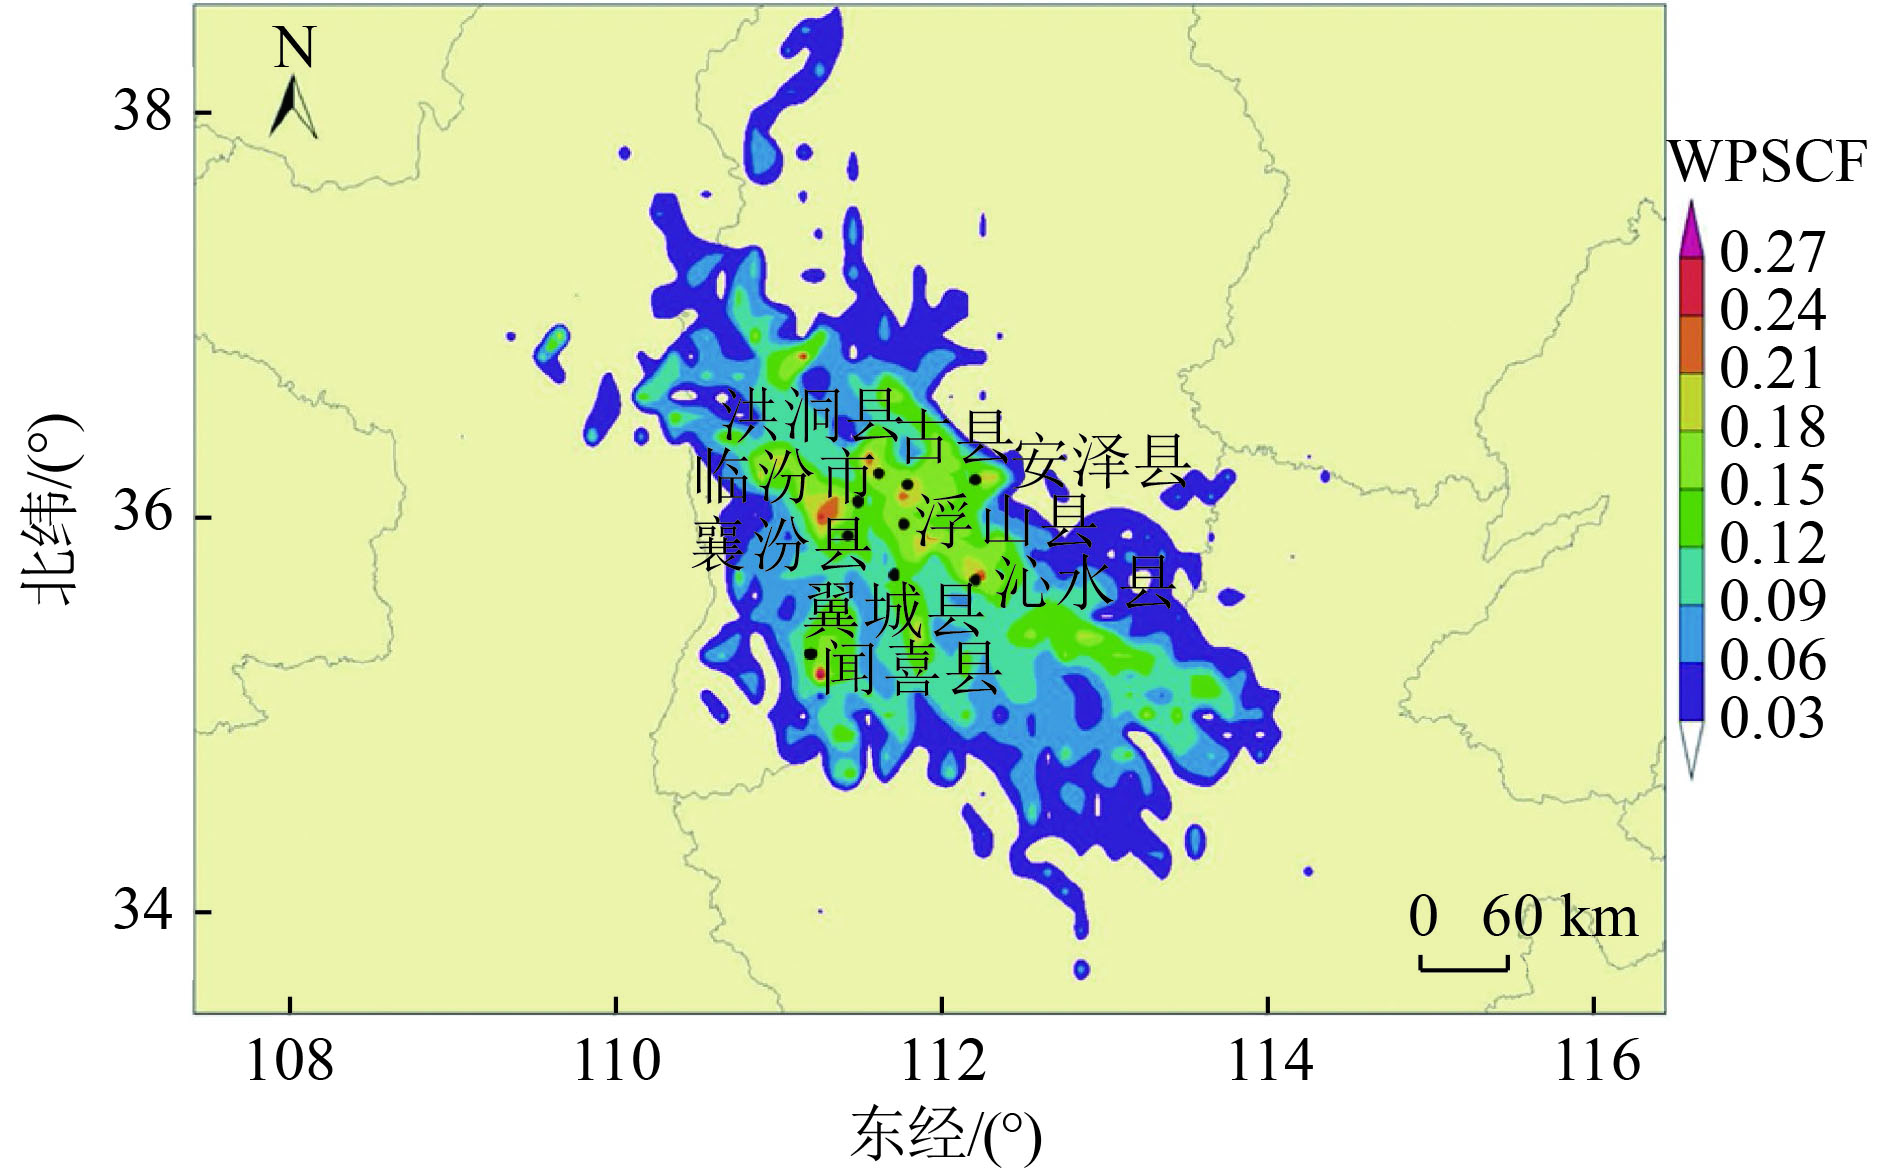
图 10 2019年5—9月临汾市O3的WPSCF分析结果
Figure 10. Result of WPSCF analysis of O3 from May to September in 2019 in Linfen City

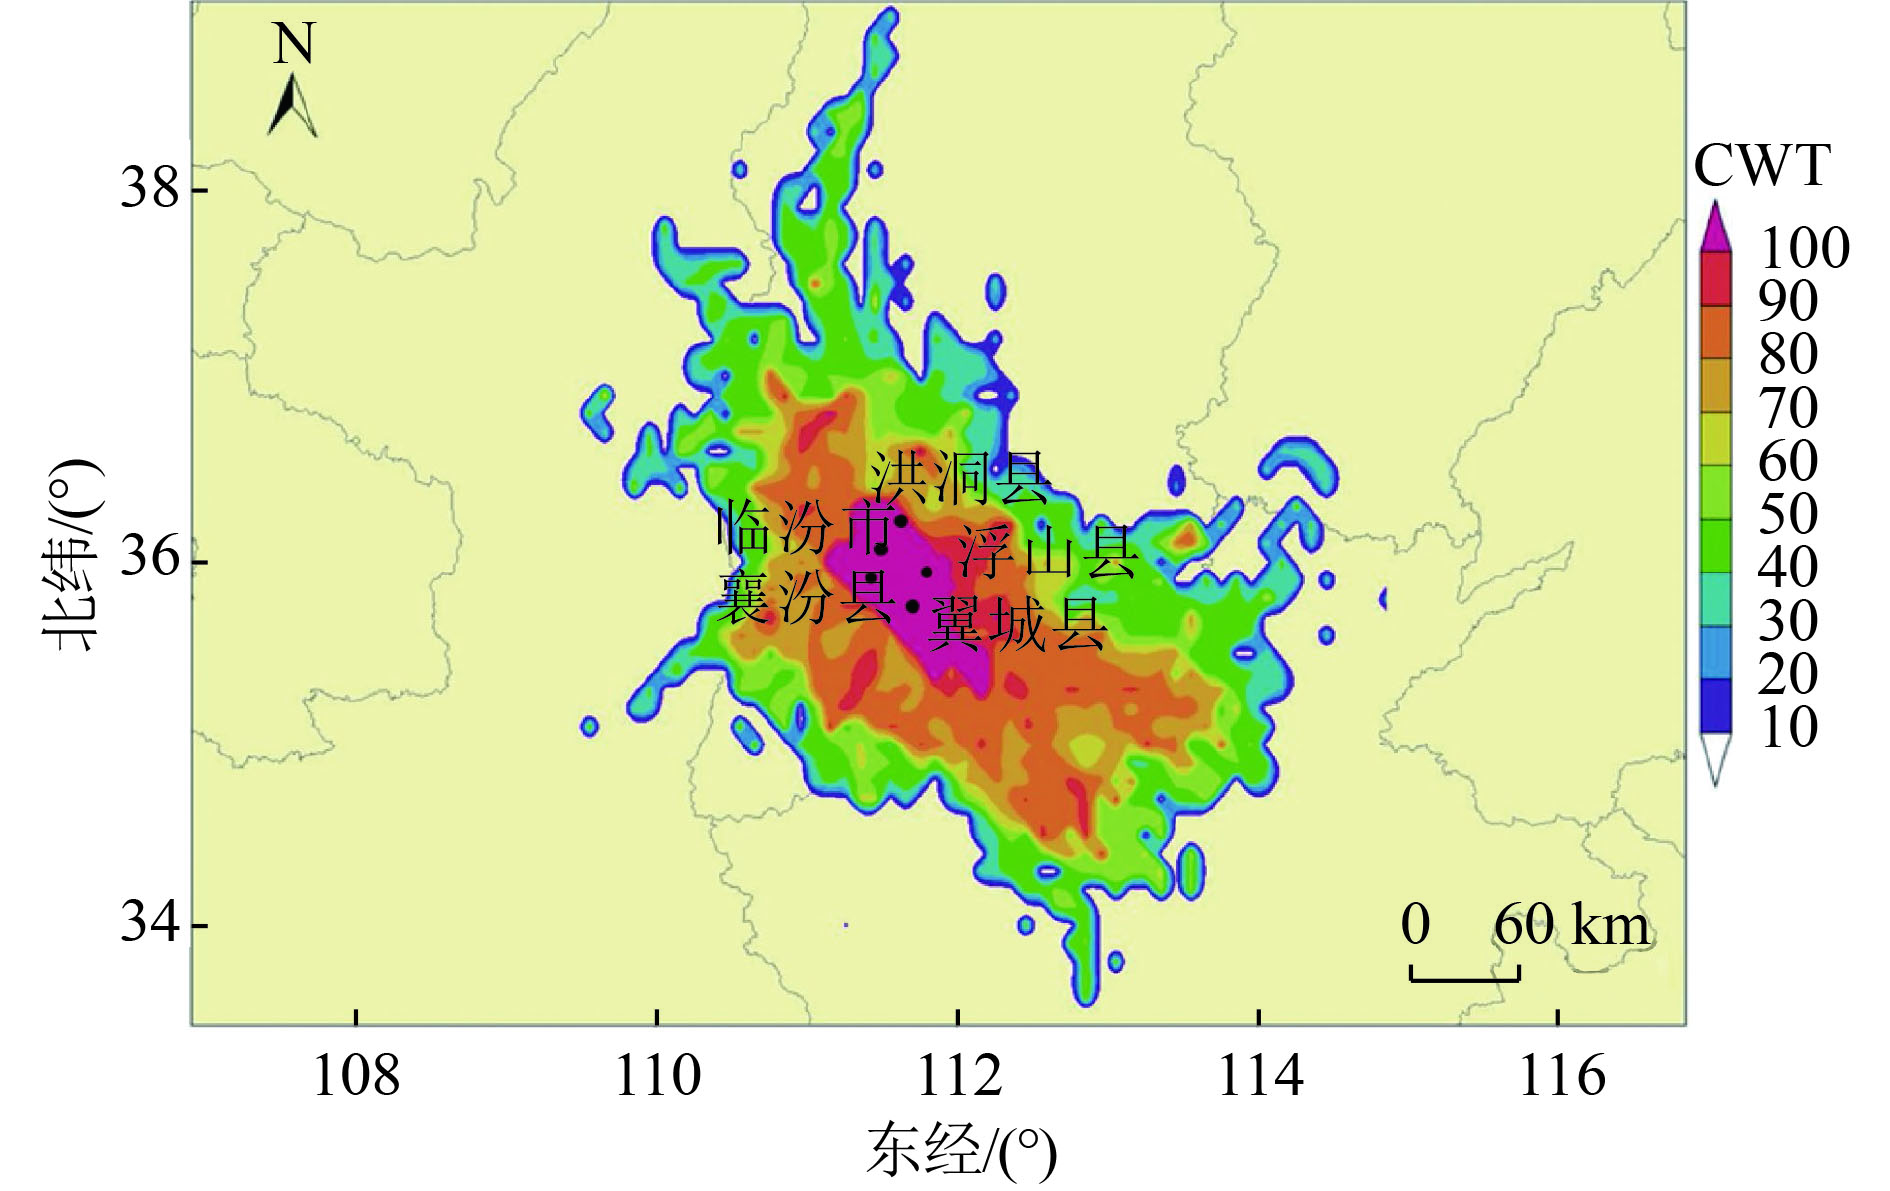
图 11 2019年5—9月临汾市O3的CWT分析结果
Figure 11. Result of CWT analysis of O3 from May to September in 2019 in Linfen City
表 1 2018—2019年临汾市O3污染情况对比
Table 1. Comparison of O3 pollution in 2018-2019 in Linfen City
年份 MDA8最大值/
(μg/m3)MDA8-90th/
(μg/m3)轻度污染
天数/d中度污染
天数/d重度污染
天数/d2019 271 204 74 28 1 2018 256 198 60 21 0  下载: 导出CSV
表 2 不同风向和风速的O3小时浓度超标数占所有O3小时浓度超标数的比例
Table 2. Percentage of O3-h exceeding standard number in different wind direction and wind speed to all O3-h exceeding standard number %
风向 城南 唐尧大酒店 风速<
1.5 m/s风速≥
3 m/s小计 风速<
1.5 m/s风速≥
3 m/s小计 南风和西南风 21.0 16.6 77.1 17.3 4.1 76.8 其他风向 18.0 0.0 22.9 14.7 1.5 23.2 合计 39.0 16.6 100 32.0 5.6 100
下载: 导出CSV
-
[1] SILLMAN S. The relation between ozone, NOx and hydrocarbons in urban and polluted rural environments[J]. Atmospheric Environment,1999,33(12):1821-1845. doi: 10.1016/S1352-2310(98)00345-8 [2] STAEHELIN J, HARRIS N R P, APPENZELLER C, et al. Ozone trends: a review[J]. Reviews of Geophysics,2001,39(2):231-290. doi: 10.1029/1999RG000059 [3] LIU H, WANG X M, PANG J M, et al. Feasibility and difficulties of China's new air quality standard compliance: PRD case of PM2.5 and ozone from 2010 to 2025[J]. Atmospheric Chemistry and Physics,2013,13(23):12013-12027. doi: 10.5194/acp-13-12013-2013 [4] 杜肖肖, 张立清, 梁海霞.东营市空气质量指数和酸雨的变化特征及相关性分析[J]. 环境工程技术学报,2021,11(1):33-40. doi: 10.12153/j.issn.1674-991X.20200057DU X X, ZHANG L Q, LIANG H X. Variation characteristics and correlation analysis of air quality index and acid rain in Dongying City[J]. Journal of Environmental Engineering Technology,2021,11(1):33-40. doi: 10.12153/j.issn.1674-991X.20200057 [5] GAO C, XIU A J, ZHANG X L, et al. Spatiotemporal characteristics of ozone pollution and policy implications in Northeast China[J]. Atmospheric Pollution Research,2020,11(2):357-369. doi: 10.1016/j.apr.2019.11.008 [6] HUI L R, LIU X G, TAN Q W, et al. VOC characteristics, chemical reactivity and sources in urban Wuhan, central China[J]. Atmospheric Environment,2020,224:117340. doi: 10.1016/j.atmosenv.2020.117340 [7] 赵伟, 高博, 刘明, 等.气象因素对香港地区臭氧污染的影响[J]. 环境科学,2019,40(1):55-66.ZHAO W, GAO B, LIU M, et al. Impact of meteorological factors on the ozone pollution in Hong Kong[J]. Environmental Science,2019,40(1):55-66. [8] 程念亮, 李云婷, 张大伟, 等.2014年北京市城区臭氧超标日浓度特征及与气象条件的关系[J]. 环境科学,2016,37(6):2041-2051.CHENG N L, LI Y T, ZHANG D W, et al. Characteristics of ozone over standard and its relationships with meteorological conditions in Beijing City in 2014[J]. Environmental Science,2016,37(6):2041-2051. [9] 符传博, 丹利, 唐家翔, 等.2017年10月海南省一次臭氧污染特征及输送路径与潜在源区分析[J]. 环境科学研究,2021,34(4):863-871.FU C B, DAN L, TANG J X, et al. Potential source contribution and transported route analysis in Hainan Province during the ozone polluted episode in October, 2017[J]. Research of Environmental Sciences,2021,34(4):863-871. [10] LI B, ZHOU Z Z, XUE Z G, et al. Study on the pollution characteristics and sources of ozone in typical loess plateau city[J]. Atmosphere,2020,11(6):555. doi: 10.3390/atmos11060555 [11] FENG Z Z, HU E Z, WANG X K, et al. Ground-level O3 pollution and its impacts on food crops in China: a review[J]. Environmental Pollution,2015,199:42-48. doi: 10.1016/j.envpol.2015.01.016 [12] XIE Y, DAI H C, ZHANG Y X, et al. Comparison of health and economic impacts of PM2.5 and ozone pollution in China[J]. Environment International,2019,130:104881. doi: 10.1016/j.envint.2019.05.075 [13] 曾贤刚, 阮芳芳, 姜艺婧.中国臭氧污染的空间分布和健康效应[J]. 中国环境科学,2019,39(9):4025-4032. doi: 10.3969/j.issn.1000-6923.2019.09.051CENG X G, RUAN F F, JIANG Y J. Spatial distribution and health effects of ozone pollution in China[J]. China Environmental Science,2019,39(9):4025-4032. doi: 10.3969/j.issn.1000-6923.2019.09.051 [14] CARTER, W P L. Development of a condensed SAPRC chemical mechanisms[J]. Atmospheric Environment,2010,44(40):5336-5345. doi: 10.1016/j.atmosenv.2010.01.024 [15] CARTER W P L. Development of ozone reactivity scales for volatile organic compounds[J]. Air & Waste,1994,44(7):881-899. [16] TONG L, ZHANG J J, XIAO H, et al. Identification of the potential regions contributing to ozone at a coastal site of Eastern China with air mass typology[J]. Atmospheric Pollution Research,2017,8(6):1044-1057. doi: 10.1016/j.apr.2017.04.005 [17] DRAXLER R R, HESS G D. An overview of the HYSPLIT-4 modelling system for trajectories, dispersion, and deposition[J]. Australian Meteorological Magazine,1998,47(4):295-308. [18] 杜朋, 李德平, 刘建国, 等.APEC前后北京郊区大气颗粒物变化特征及其潜在源区分析[J]. 环境科学学报,2018,38(10):3846-3855.DU P, LI D P, LIU J G, et al. Pollution characteristics and potential source region analysis of atmospheric particulate matter during 2014 APEC in Beijing Surburban[J]. Acta Scientiae Circumstantiae,2018,38(10):3846-3855. [19] 谢放尖, 陆晓波, 杨峰, 等.2017年春夏期间南京地区臭氧污染输送影响及潜在源区[J]. 环境科学,2021,42(1):88-96.XIE F J, LU X B, YANG F, et al. Transport influence and potential sources of ozone pollution for Nanjing during spring and summer in 2017[J]. Environmental Science,2021,42(1):88-96. [20] ZHAO S P, YU Y, QIN D H, et al. Analyses of regional pollution and transportation of PM2.5 and ozone in the city clusters of Sichuan Basin, China[J]. Atmospheric Pollution Research,2019,10(2):374-385. doi: 10.1016/j.apr.2018.08.014 [21] WANG Y Q, ZHANG X Y, DRAXLER R R. TrajStat: GIS-based software that uses various trajectory statistical analysis methods to identify potential sources from long-term air pollution measurement data[J]. Environmental Modelling & Software,2009,24(8):938-939. [22] LI L L, TAN Q W, ZHANG Y H, et al. Characteristics and source apportionment of PM2.5 during persistent extreme haze events in Chengdu, Southwest China[J]. Environmental Pollution,2017,230:718-729. doi: 10.1016/j.envpol.2017.07.029 [23] LIU B S, LIANG D N, YANG J M, et al. Characterization and source apportionment of volatile organic compounds based on 1-year of observational data in Tianjin, China[J]. Environmental Pollution,2016,218:757-769. doi: 10.1016/j.envpol.2016.07.072 [24] 张晓, 张艳品, 钤伟妙.石家庄市主城区臭氧污染特征及气象成因分析[J]. 环境科学研究,2021,34(2):245-253.ZHANG X, ZHANG Y P, QIAN W M. Characteristics of ozone pollution and its meteorological factors in Shijiazhuang urban area[J]. Research of Environmental Sciences,2021,34(2):245-253. [25] FANG X Z, XIAO H Y, SUN H X, et al. Characteristics of ground-level ozone from 2015 to 2018 in BTH area, China[J]. Atmosphere,2020,11(2):130. doi: 10.3390/atmos11020130 [26] 王旭东, 尹沙沙, 杨健, 等.郑州市臭氧污染变化特征、气象影响及输送源分析[J]. 环境科学,2021,42(2):604-615.WANG X D, YIN S S, YANG J, et al. Characteristics, meteorological influences, and transport source of ozone pollution in Zhengzhou City[J]. Environmental Science,2021,42(2):604-615. [27] TAN Q W, ZHOU L, LIU H F, et al. Observation-based summer O3 control effect evaluation: a case study in Chengdu, a megacity in Sichuan Basin, China[J]. Atmosphere,2020,11(12):1278. doi: 10.3390/atmos11121278 [28] BROWN S G, FRANKEL A, HAFNER H R. Source apportionment of VOCs in the Los Angeles area using positive matrix factorization[J]. Atmospheric Environment,2007,41(2):227-237. doi: 10.1016/j.atmosenv.2006.08.021 [29] HUI L R, LIU X G, TAN Q W, et al. Characteristics, source apportionment and contribution of VOCs to ozone formation in Wuhan, Central China[J]. Atmospheric Environment,2018,192:55-71. doi: 10.1016/j.atmosenv.2018.08.042 [30] 张利慧, 毋振海, 李斌, 等.北京市城区春季大气挥发性有机物污染特征[J]. 环境科学研究,2020,33(3):526-535.ZHANG L H, WU Z H, LI B, et al. Pollution characterizations of atmospheric volatile organic compounds in spring of Beijing urban area[J]. Research of Environmental Sciences,2020,33(3):526-535. [31] MCGAUGHEY G R, DESAI N R, ALLEN D T, et al. Analysis of motor vehicle emissions in a Houston tunnel during the Texas Air Quality Study 2000[J]. Atmospheric Environment,2004,38(20):3363-3372. doi: 10.1016/j.atmosenv.2004.03.006 [32] AKAGI S K, YOKELSON R J, WIEDINMYER C, et al. Emission factors for open and domestic biomass burning for use in atmospheric models[J]. Atmospheric Chemistry and Physics,2011,11(9):4039-4072. doi: 10.5194/acp-11-4039-2011 [33] YURDAKUL S, CIVAN M, KUNTASAL Ö, et al. Temporal variations of VOC concentrations in Bursa atmosphere[J]. Atmospheric Pollution Research,2018,9(2):189-206. doi: 10.1016/j.apr.2017.09.004 [34] WANG H L, HAO R, FANG L, et al. Study on emissions of volatile organic compounds from a typical coking chemical plant in China[J]. Science of the Total Environment,2021,752:141927. doi: 10.1016/j.scitotenv.2020.141927 [35] 高志凤, 张晓红, 赵文娟, 等.典型焦化厂大气挥发性有机物排放表征分析[J]. 环境科学研究,2019,32(9):1540-1545.GAO Z F, ZHANG X H, ZHAO W J, et al. Characteristic analysis of VOCs emitted from a typical coking plant[J]. Research of Environmental Sciences,2019,32(9):1540-1545. [36] YAO S, WANG Q H, ZHANG J M, et al. Ambient volatile organic compounds in a heavy industrial city: concentration, ozone formation potential, sources, and health risk assessment[J]. Atmospheric Pollution Research,2021,12(5):101053. doi: 10.1016/j.apr.2021.101053 [37] LI J, LI H Y, HE Q S, et al. Characteristics, sources and regional inter-transport of ambient volatile organic compounds in a city located downwind of several large coke production bases in China[J]. Atmospheric Environment,2020,233:117573. □ doi: 10.1016/j.atmosenv.2020.117573 -

 下载:
下载:


 点击查看大图
计量
- 文章访问数: 224
- HTML全文浏览量: 102
- PDF下载量: 31
- 被引次数: 0