

Projection of residential annual water consumption in Hengshui City based on dynamic gray model groups
-
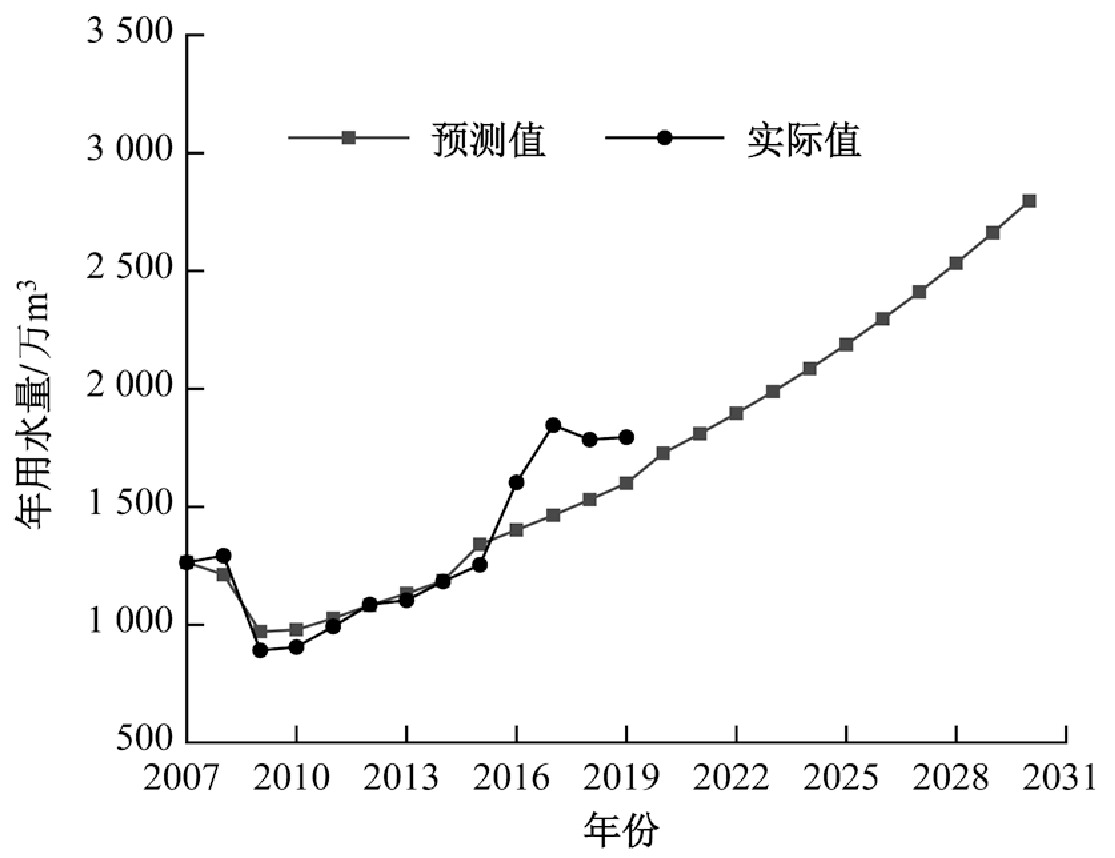
摘要: 针对居民用水量序列的随机性和周期性以及传统灰色模型由于离散程度大而产生的过拟合问题,依据灰色模型理论构造了由5个GM(1,1)模型组成的灰色动态模型群;基于衡水市2007—2019年居民年用水量数据,采用灰色动态模型群对衡水市2020—2030年居民年用水量变化进行预测研究,并对预测结果进行残差检验以及残差修正;将灰色动态模型群分别与5个GM(1,1)模型进行对比,以检验模型性能。结果表明:灰色动态模型群的预测相对误差整体小于传统GM(1,1)模型,具有更好的准确性和适用性;衡水市2019年居民年用水量为1 795.00万m3,2030年预计增至2 862.21万m3,未来衡水市居民年用水量呈明显增长趋势,这与衡水市未来人口增长和社会经济发展趋势相吻合。衡水市未来居民用水量预测结果可为供水优化调度和水资源优化配置提供参考。Abstract: To address the randomness and periodicity of the residential water consumption (RWC) data along with overfitting problem caused by the large dispersion of traditional gray model, a dynamic gray model group consisting of five GM(1,1) models was proposed based on gray model theory. Based on the annual RWC data of Hengshui City from 2007 to 2019, the dynamic gray model group was used to project the future changes of annual RWC in Hengshui City during 2020-2030, and meanwhile residual tests and corrections were conducted using the projected results; the dynamic gray model group was compared with five GM(1,1) models to test the model accuracy. The results showed that the projected relative error of the dynamic gray model group was smaller than that of the traditional GM(1, 1) model, implying better accuracy and applicability. The annual RWC in Hengshui approached 17.95 million m3 in 2019 and was expected to increase to 28.62 million m3 in 2030, which indicated that the future RWC in Hengshui City would be at an obvious uptrend, and this result was in line with the future population growth and socio-economic development trend. The projected results of RWC in this study was capable of providing reference for optimal water supply and water resources allocation in Hengshui City.
-

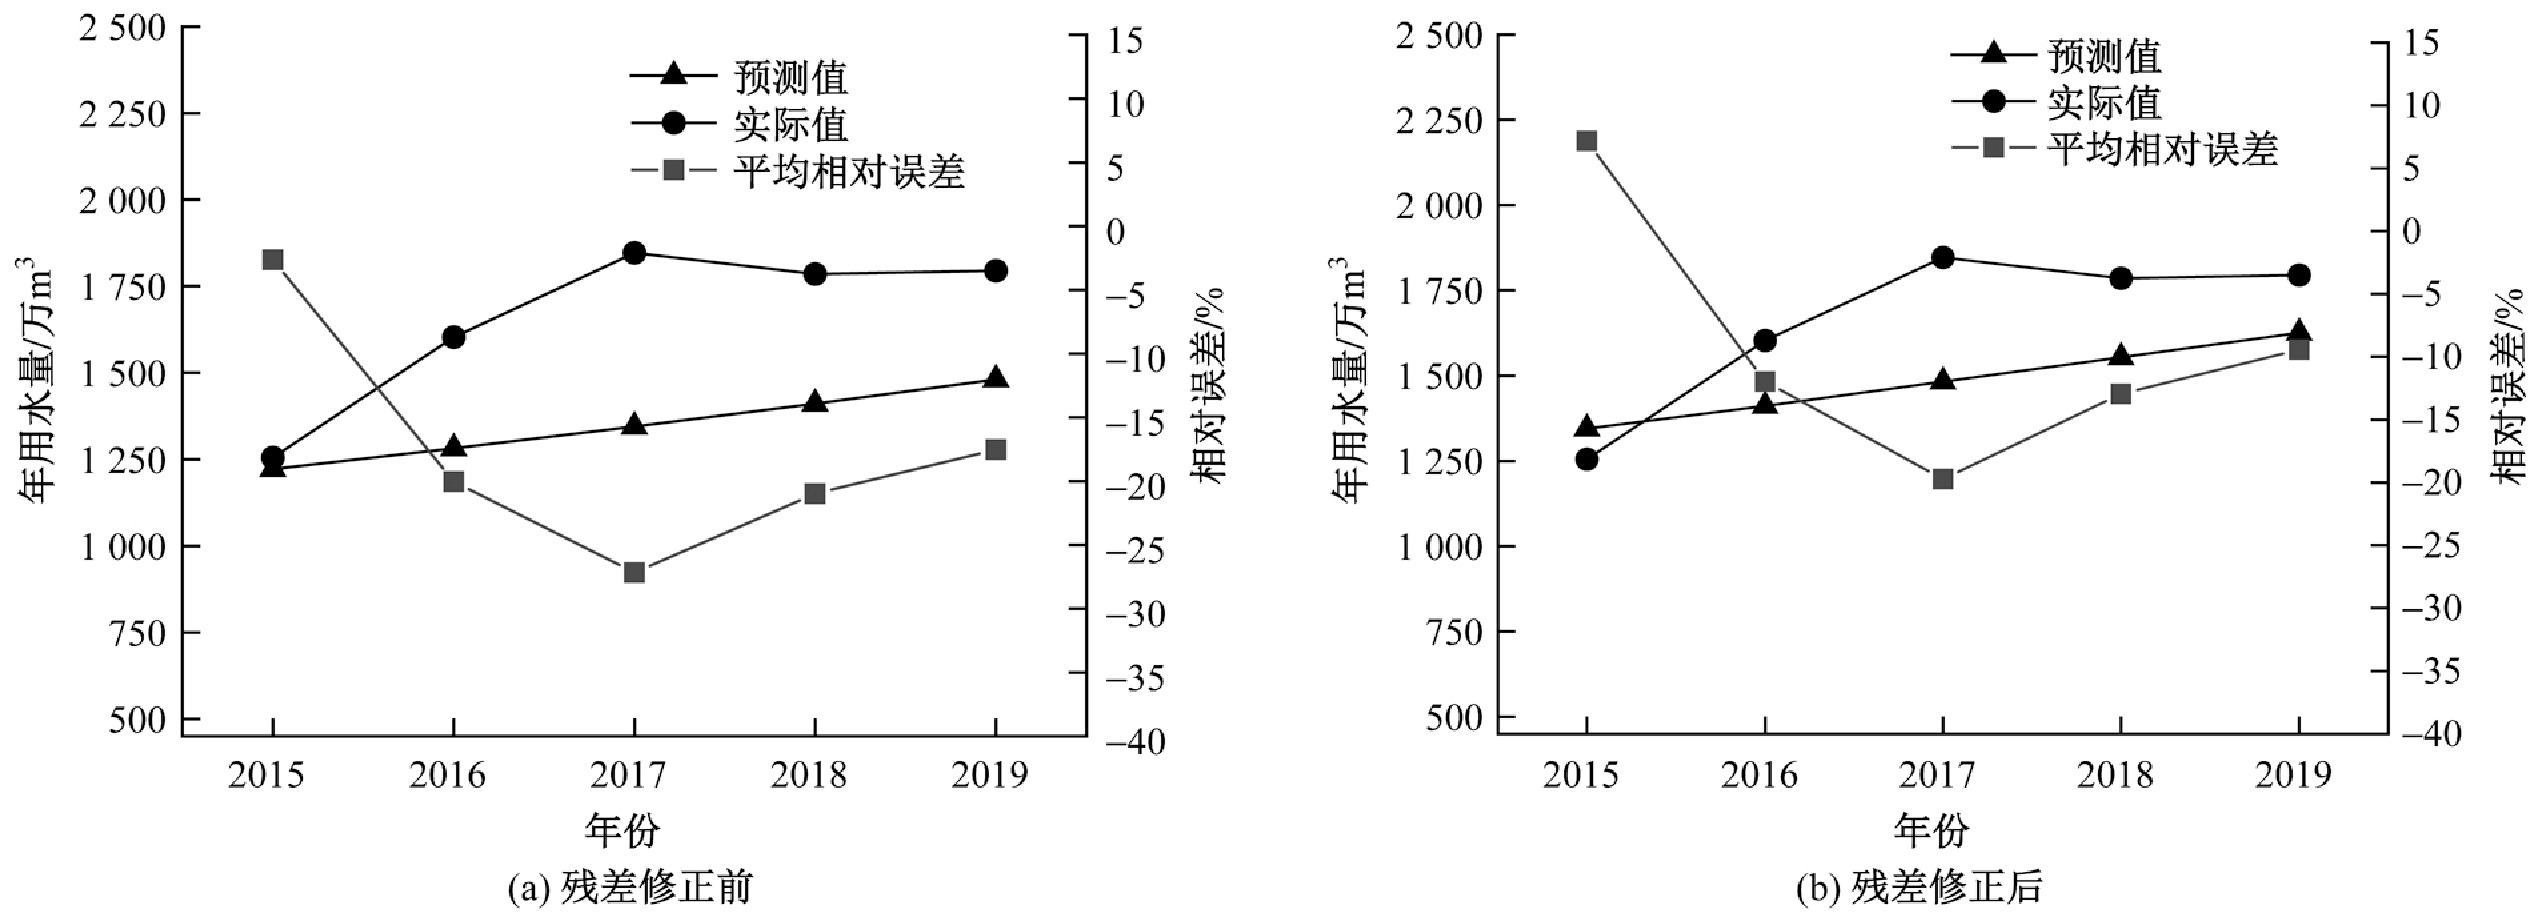
图 1 2015—2019年衡水市居民年用水量预测值与实际值对比及相对误差
Figure 1. Comparison and relative error between predicted and actual annual RWC of Hengshui City from 2015 to 2019

图 2 2015—2019年衡水市居民用水量灰色动态模型群误差检验
注:纵坐标为单一GM(1,1)模型与灰色动态模型群预测结果的相对误差。
Figure 2. Error test of dynamic gray model group of RWC in Hengshui City from 2015 to 2019

图 3 衡水市居民用水量预测拟合效果及未来用水量预测
Figure 3. Prediction and fitting effect and change trend of RWC in Hengshui City in the future
表 1 检验精度指示表
Table 1. Check accuracy indicator
精度 P C 等级 良好 ≥0.95 ≤0.35 1 合格 0.80~0.95 0.35~0.50 2 勉强接受 0.70~0.80 0.50~0.65 3 不合格 <0.70 >0.65 4  下载: 导出CSV
表 2 灰色模型精度要求
Table 2. Grey model accuracy requirements
预测时间段 相对误差/% 短期预测(≤1 a) 2~5 中期预测(1~5 a) 10~20 长期预测(5~10 a) 30~40
下载: 导出CSV
表 3 2007—2019年衡水市居民年用水量
Table 3. Annual RWC in Hengshui City from 2007 to 2019
万 m3 年份 年用水量 年份 年用水量 2007 1 264.65 2014 1 184.43 2008 1 293.37 2015 1 254.85 2009 891.51 2016 1 603.20 2010 905.00 2017 1 846.50 2011 993.00 2018 1 785.30 2012 1 086.20 2019 1 795.00 2013 1 104.52
下载: 导出CSV
表 4 GM(1,1)模型群及残差检验
Table 4. GM(1,1) model group and residual test
模型 GM(1,1)预测模型 P C 精度 等级 1 ${\hat x}^{\left(1\right)}\left( {k + 1} \right) = {\text{100\;714} }{\text{.11} }{ {\rm{e} }^{0.010\;2k} } - 99\;449.46$ 1 0.643 6 合格 3 2 ${\hat x}^{\left(1\right)}\left( {k + 1} \right) = 14\;234.23{ {\rm{e} }^{0.060\;0k} } - 12\;940.86$ 1 0.017 6 良好 1 3 ${\hat x}^{\left(1\right)} \left( {k + 1} \right) = 1{\text{4\;253} }{\text{.85} }{ {\rm{e} }^{0.063\;0k} } - 13\;362.34$ 1 0.0294 良好 1 4 ${\hat x}^{\left(1\right)} \left( {k + 1} \right) = {\text{1} }8\;071.92{ {\rm{e} }^{0.054\;1k} } - 17\;166.92$ 1 0.022 1 良好 1 5 ${\hat x}^{\left(1\right)} \left( {k + 1} \right) = 23\;885.56{ {\rm{e} }^{0.044\;1k} } - 22\;892.56$ 1 0.031 8 良好 1
下载: 导出CSV
表 5 残差修正前2015—2019用水量预测值与实际值对比
Table 5. Comparison of projected and actual water consumption data from 2015-2019 before residual correction
年份 预测值/万m³ 实际值/万m³ 相对误差/% 残差/万m³ 模型1 模型2 模型3 模型4 模型5 均值 2015 1 109.22 1 258.26 1 266.94 1 246.49 1 227.02 1 221.59 1 254.85 −2.65 −33.26 2016 1 120.93 1 338.17 1 350.82 1 316.98 1 282.93 1 281.97 1 603.20 −20.04 −321.23 2017 1 132.42 1 420.86 1 438.57 1 390.21 1 340.70 1 344.55 1 846.50 −27.18 −501.95 2018 1 144.04 1 508.65 1 532.02 1 467.50 1 401.08 1 410.66 1 785.30 −20.98 −374.64 2019 1 155.77 1 601.87 1 631.54 1 549.10 1 464.18 1 480.49 1 795.00 −17.52 −314.51
下载: 导出CSV
表 6 GM(1,1)残差修正后预测模型群
Table 6. GM(1,1) residual-corrected prediction model group
模型 残差修正后GM(1,1)预测模型 1 ${\hat Y}^{\left(1\right)} \left( {k + 1} \right)$= ${\text{100\;714} }{\text{.11} }{{\rm{e}}^{0.010\;2k} } - 282.02{{\rm{e}}^{ - 0.762\;5k} } - 99\;167.44$ 2 ${\hat Y}^{\left(1\right)} \left( {k + 1} \right)$= $14\;234.23{{\rm{e}}^{0.060\;0k} } + 154{{\rm{e}}^{00.002\;2k} } - 12\;994.86$ 3 ${\hat Y}^{\left(1\right)} \left( {k + 1} \right)$= $1{\text{4\;253} }{\text{.85} }{{\rm{e}}^{0.063\;0k} } + 85.84{{\rm{e}}^{0.298\;9k} } - 13\;247.50$ 4 ${\hat Y}^{\left(1\right)} \left( {k + 1} \right)$= ${\text{1} }8\;071.92{{\rm{e}}^{0.054\;1k} } - 51.63{{\rm{e}}^{ - 0.004\;5k} } - 17\;115.92$ 5 ${\hat Y}^{\left(1\right)} \left( {k + 1} \right)$= $23\;885.56{{\rm{e}}^{0.044\;1k} } + 54.83{{\rm{e}}^{0.003\;9k} } - 22\;946.56$
下载: 导出CSV
表 7 残差修正后2015—2019用水量预测值与实际值对比
Table 7. Comparison of predicted and actual water consumption data for 2015-2019 after residual correction
年份 预测值/万m³ 实际值/万m³ 平均相对
误差/%残差/万m³ 模型1 模型2 模型3 模型4 模型5 平均值 2015 1 490.22 1 268.26 1 271.94 1 256.49 1 437.02 1 344.79 1 254.85 7.17 89.94 2016 1 501.93 1 348.17 1 355.82 1 326.98 1 522.93 1 411.17 1 603.20 −11.98 −192.03 2017 1 513.42 1 430.86 1 443.57 1 400.21 1 623.70 1 482.35 1 846.50 −19.72 −364.15 2018 1 525.04 1 518.65 1 537.02 1 477.50 1 711.08 1 553.86 1 785.30 −12.96 −231.44 2019 1 536.77 1 611.87 1 636.54 1 559.10 1 784.18 1 625.69 1 795.00 −9.43 −169.31
下载: 导出CSV
表 8 衡水市居民年用水量预测结果
Table 8. Projected annual water consumption of Hengshui residents
万 m3 年份 预测值 实际值 模型1 模型2 模型3 模型4 模型5 平均值 2015 1 490.22 1 268.26 1 271.94 1 256.49 1 437.02 1 344.79 1 254.85 2016 1 501.93 1 348.17 1 355.82 1 326.98 1 522.93 1 411.17 1 603.20 2017 1 513.42 1 430.86 1 443.57 1 400.21 1 623.70 1 482.35 1 846.50 2018 1 525.04 1 518.65 1 537.02 1 477.50 1 711.08 1 553.86 1 785.30 2019 1 536.77 1 611.87 1 636.54 1 559.10 1 784.18 1 625.69 1 795.00 2020 1 543.93 1 917.53 1 950.41 1 735.23 1 830.12 1 795.44 2021 1 556.28 2 036.01 2 070.61 1 826.15 1 899.03 1 877.62 2022 1 568.75 2 161.81 2 198.63 1 922.12 1 961.04 1 962.47 2023 1 581.36 2 295.39 2 334.96 2 023.43 2 024.29 2 051.89 2024 1 594.09 2 437.22 2 480.14 2 130.37 2 107.12 2 149.79 2025 1 616.95 2 587.81 2 634.76 2 243.26 2 193.01 2 255.16 2026 1 629.95 2 747.71 2 799.43 2 362.43 2 282.76 2 364.46 2027 1 663.08 2 917.48 2 974.79 2 488.22 2 376.56 2 484.03 2028 1 678.34 3 097.75 3 161.54 2 621.01 2 474.58 2 606.64 2029 1 689.74 3 289.16 3 360.42 2 761.18 2 577.01 2 735.50 2030 1 700.28 3 492.39 3 572.23 2 909.14 2 637.01 2 862.21
下载: 导出CSV
-
[1] 秦欢欢, 赖冬蓉, 万卫, 等.基于系统动力学的北京市需水量预测及缺水分析[J]. 科学技术与工程,2018,18(21):175-182. doi: 10.3969/j.issn.1671-1815.2018.21.027QIN H H, LAI D R, WAN W, et al. Water demand prediction and water deficit analysis in Beijing based on system dynamics[J]. Science Technology and Engineering,2018,18(21):175-182. doi: 10.3969/j.issn.1671-1815.2018.21.027 [2] 宋帆, 杨晓华, 武翡翡, 等.灰色关联-集对聚类预测模型在吉林省用水量预测中的应用[J]. 水资源与水工程学报,2018,29(3):28-33. doi: 10.11705/j.issn.1672-643X.2018.03.05SONG F, YANG X H, WU F F, et al. Application of grey correlation degree-set pair analysis classified prediction method on water consumption prediction of Jilin Province[J]. Journal of Water Resources and Water Engineering,2018,29(3):28-33. doi: 10.11705/j.issn.1672-643X.2018.03.05 [3] 牟天蔚, 蒋白懿, 沈丹玉, 等.深度学习框架对城市日供水量预测的研究[J]. 人民黄河,2018,40(9):58-62. doi: 10.3969/j.issn.1000-1379.2018.09.014MU T W, JIANG B Y, SHEN D Y, et al. Study on the prediction of deep learning framework for city daily water supply[J]. Yellow River,2018,40(9):58-62. doi: 10.3969/j.issn.1000-1379.2018.09.014 [4] 薛文志, 唐德善.改进的GM(1, 1)模型在城市用水量预测中的应用[J]. 水电能源科学,2010,28(11):38-40. doi: 10.3969/j.issn.1000-7709.2010.11.013XUE W Z, TANG D S. Application of improved GM(1, 1) model to predicting urban water consumption[J]. Water Resources and Power,2010,28(11):38-40. doi: 10.3969/j.issn.1000-7709.2010.11.013 [5] 柳烨, 王孔锋, 陈帝伊.灰色模型结合微粒群算法的城市用水量预测[J]. 人民黄河,2012,34(3):42-44. doi: 10.3969/j.issn.1000-1379.2012.03.016LIU Y, WANG K F, CHEN D Y. Urban water consumption prediction by gray model combined with PSO[J]. Yellow River,2012,34(3):42-44. doi: 10.3969/j.issn.1000-1379.2012.03.016 [6] 任晔, 徐淑琴.灰色神经网络组合模型在庆安县年降雨量预测中的应用[J]. 节水灌溉,2012(9):24-25. [7] 赵宇哲, 武春友.灰色振荡序列GM(1, 1)模型及在城市用水中的应用[J]. 运筹与管理,2010,19(5):155-159. doi: 10.3969/j.issn.1007-3221.2010.05.025ZHAO Y Z, WU C Y. GM(1, 1) model of grey oscillation sequences and its application to urban water consumption forecasting[J]. Operations Research and Management Science,2010,19(5):155-159. doi: 10.3969/j.issn.1007-3221.2010.05.025 [8] 唐万梅.基于灰色支持向量机的新型预测模型[J]. 系统工程学报,2006,21(4):410-413. doi: 10.3969/j.issn.1000-5781.2006.04.013TANG W M. New forecasting model based on grey support vector machine[J]. Journal of Systems Engineering,2006,21(4):410-413. doi: 10.3969/j.issn.1000-5781.2006.04.013 [9] 刘献, 袁旦, 张小丽, 等.基于残差灰色-马尔可夫链的生活用水量预测研究[J]. 人民珠江,2020,41(8):1-6. doi: 10.3969/j.issn.1001-9235.2020.08.001LIU X, YUAN D, ZHANG X L, et al. Study on prediction of domestic water consumption based on residual grey Markov chain model[J]. Pearl River,2020,41(8):1-6. doi: 10.3969/j.issn.1001-9235.2020.08.001 [10] 杜懿, 麻荣永.不同改进灰色模型在广西年用水量预测中的应用研究[J]. 水资源与水工程学报,2017,28(3):87-90.DU Y, MA R Y. Application of different improved grey model on the water consumption prediction in Guangxi[J]. Journal of Water Resources and Water Engineering,2017,28(3):87-90. [11] 白鹏, 龙秋波.3种用水量预测方法在京津冀地区的适用性比较[J]. 水资源保护,2021,37(2):102-107. doi: 10.3880/j.issn.1004-6933.2021.02.016BAI P, LONG Q B. Applicability comparison of three water consumption prediction methods in Beijing-Tianjin-Hebei Region[J]. Water Resources Protection,2021,37(2):102-107. doi: 10.3880/j.issn.1004-6933.2021.02.016 [12] 刘呈玲, 方红远, 刘志辉.改进的灰色预测模型在区域用水总量预测中的应用[J]. 华北水利水电大学学报(自然科学版),2018,39(2):57-62.LIU C L, FANG H Y, LIU Z H. Application of grey system model in prediction of regional water consumption[J]. Journal of North China University of Water Resources and Electric Power (Natural Science Edition),2018,39(2):57-62. [13] 唐晓灵, 李竹青.区域工业用水效率及节水潜力研究: 以关中平原城市群为例[J]. 生态经济,2020,36(10):134-140.TANG X L, LI Z Q. Research on industrial water efficiency and water saving potential: taking the Guanzhong plain urban agglomeration as an example[J]. Ecological Economy,2020,36(10):134-140. [14] 李如忠, 汪家权, 钱家忠.基于灰色动态模型群法的河流水质预测研究[J]. 水土保持通报,2002,22(4):10-12. doi: 10.3969/j.issn.1000-288X.2002.04.003LI R Z, WANG J Q, QIAN J Z. Prediction of river water quality based on gray dynamic model group[J]. Bulletin of Soil and Water Conservation,2002,22(4):10-12. doi: 10.3969/j.issn.1000-288X.2002.04.003 [15] 张保祥, 汪家权, 卢朝霞, 等.灰色动态模型群法及其工业取水量预测应用[J]. 水资源与水工程学报,2005,16(3):44-47. doi: 10.3969/j.issn.1672-643X.2005.03.011ZHANG B X, WANG J Q, LU Z X, et al. Grey dynamic model group and its application in predicting of industrial water demand[J]. Journal of Water Resources and Water Engineering,2005,16(3):44-47. doi: 10.3969/j.issn.1672-643X.2005.03.011 [16] 袁娜, 宋云峰, 王雅欣, 等.基于灰色动态模型群的济宁市需水量预测[J]. 水电能源科学,2014,32(7):33-36.YUAN N, SONG Y F, WANG Y X, et al. Water demand forecasting of Jining City based on gray dynamic model groups[J]. Water Resources and Power,2014,32(7):33-36. [17] 王韶伟, 许新宜, 贾香香, 等.基于灰色动态模型群的需水预测研究[J]. 中国农村水利水电,2010(2):29-31.WANG S W, XU X Y, JIA X X, et al. Prediction of water demand based on the gray dynamic model group[J]. China Rural Water and Hydropower,2010(2):29-31. [18] 文静, 雷晓云, 朱连勇, 等.改进的灰色动态模型在五家渠市需水预测中的应用[J]. 节水灌溉,2012(2):78-80.WEN J, LEI X Y, ZHU L Y, et al. Application of improved grey dynamic model in water demand forecast of Wujiaqu City[J]. Water Saving Irrigation,2012(2):78-80. [19] CHEN H X. Application study on the prediction of grain output in Huainan by grey GM (1, 1) model[J]. Advance Journal of Food Science and Technology,2016,10(2):95-98. doi: 10.19026/ajfst.10.1805 [20] XIAO X P, GUO H, MAO S H. The modeling mechanism, extension and optimization of grey GM (1, 1) model[J]. Applied Mathematical Modelling,2014,38(5/6):1896-1910. [21] 曹飞.基于灰色残差模型的我国财政收入预测[J]. 财会月刊,2012(21):69-70. [22] 李刚, 黄同愿, 闫河, 等.公路交通事故预测的灰色残差模型[J]. 交通运输工程学报,2009,9(5):88-93. doi: 10.3321/j.issn:1671-1637.2009.05.016LI G, HUANG T Y, YAN H, et al. Grey residual error model of highway traffic accident forecast[J]. Journal of Traffic and Transportation Engineering,2009,9(5):88-93. doi: 10.3321/j.issn:1671-1637.2009.05.016 [23] 左朝晖, 李绍康, 杨津津, 等.基于GA-BP神经网络的页岩气开发区域水资源承载力研究[J]. 环境工程技术学报,2021,11(1):194-201. doi: 10.12153/j.issn.1674-991X.20200081ZUO Z H, LI S K, YANG J J, et al. Research on water resources carrying capacity of shale gas development area based on GA-BP neural network[J]. Journal of Environmental Engineering Technology,2021,11(1):194-201. doi: 10.12153/j.issn.1674-991X.20200081 [24] 郝跃颖.衡水市水资源状况及承载力探讨[J]. 水利科技与经济,2017,23(1):58-61. doi: 10.3969/j.issn.1006-7175.2017.01.015HAO Y Y. Water resources and carrying capacity of water resources in Hengshui City[J]. Water Conservancy Science and Technology and Economy,2017,23(1):58-61. doi: 10.3969/j.issn.1006-7175.2017.01.015 [25] 韩燕, 李海涛.衡水市用水结构与变化趋势分析[J]. 水科学与工程技术,2015(5):25-27. doi: 10.3969/j.issn.1672-9900.2015.05.009HAN Y, LI H T. Analyses of water use structure and change trend of Hengshui City[J]. Water Sciences and Engineering Technology,2015(5):25-27. doi: 10.3969/j.issn.1672-9900.2015.05.009 [26] 住房和城乡建设部. 中国城市建设统计年鉴(2007—2019年)[M]. 北京: 中国统计出版社, 2007—2019. [27] LIU X Y, PENG H Q, BAI Y, et al. Tourism flows prediction based on an improved grey GM(1, 1) model[J]. Procedia - Social and Behavioral Sciences,2014,138:767-775. ⊗ doi: 10.1016/j.sbspro.2014.07.256 -

 下载:
下载:


 点击查看大图
计量
- 文章访问数: 428
- HTML全文浏览量: 274
- PDF下载量: 35
- 被引次数: 0