

Comparative analysis of air quality between Beijing and Hohhot
-
摘要:
为了对比北京市和呼和浩特市空气质量,探讨其差异性成因及防治对策,收集2市2014—2019年的空气质量常规监测数据,对空气污染物浓度、首要污染物变化及空气质量指数等特征进行分析。结果表明:北京和呼和浩特2市空气中PM10、PM2.5、SO2、NO2、CO这5种污染物浓度表现出相似的季节变化特征,空气质量冬季最差,夏季最好;2市空气中污染物都是以颗粒物为主,其中北京市以PM2.5为主,呼和浩特市以PM10为主;长期监测数据显示,2市在经济社会快速发展的同时,污染物浓度大多呈持续下降的趋势,但O3浓度有所增加。从2市各经济指标和污染物浓度变化的相关性看出,城市高质量发展越来越受到城市空气质量的约束,而改善城市经济结构在空气污染防治中具有极大作用。
Abstract:In order to compare the air quality of Beijing and Hohhot and discuss the different causes and the prevention and control measures of air pollution, the characteristics of air pollutant quality concentration, primary pollutant change and air quality index of the two cities was analyzed based on the regular monitoring data of air quality of the two cities from January 2014 to December 2019 released by Environmental Monitoring Station of China. The results showed that: The pollutants in the atmosphere of Beijing and Hohhot, including PM10, PM2.5, SO2, NO2 and CO, shared similar seasonal variation characteristics. The air quality of both cities was the best in summer and the worst in winter. The chief pollutant contributing to the air quality of the two cities was particulate matter, with PM2.5 in Beijing and PM10 in Hohhot. Long-term monitoring data showed that the concentration of pollutants in the air of the both cities present a continuous downward trend with the rapid development of economy and society, while the concentration of O3 was still increasing. According to the correlation analysis between the economic index and pollutant concentration in the two cities, high-quality urban development is increasingly constrained by air quality, improving urban economic structure plays an important role in preventing and controlling air pollution.
-
Key words:
- Beijing /
- Hohhot /
- air quality /
- air quality index /
- economic indicators
-

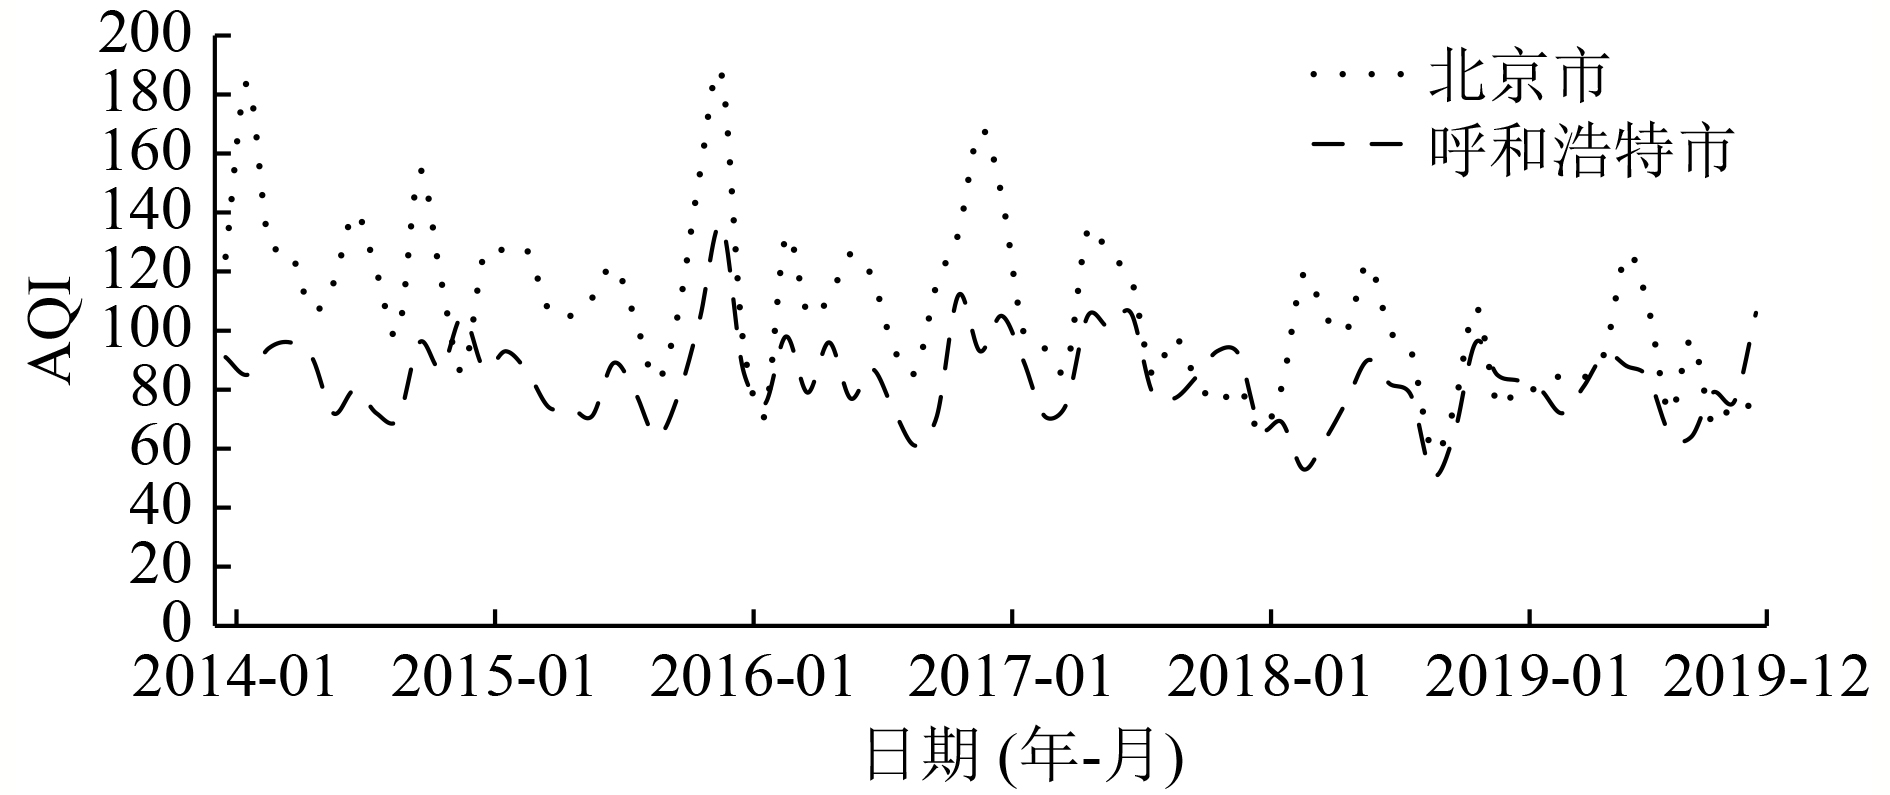
图 1 2014—2019年北京市和呼和浩特市AQI逐月变化
Figure 1. Monthly changes of the air quality indexes from 2014 to 2019 in Beijing and Hohhot

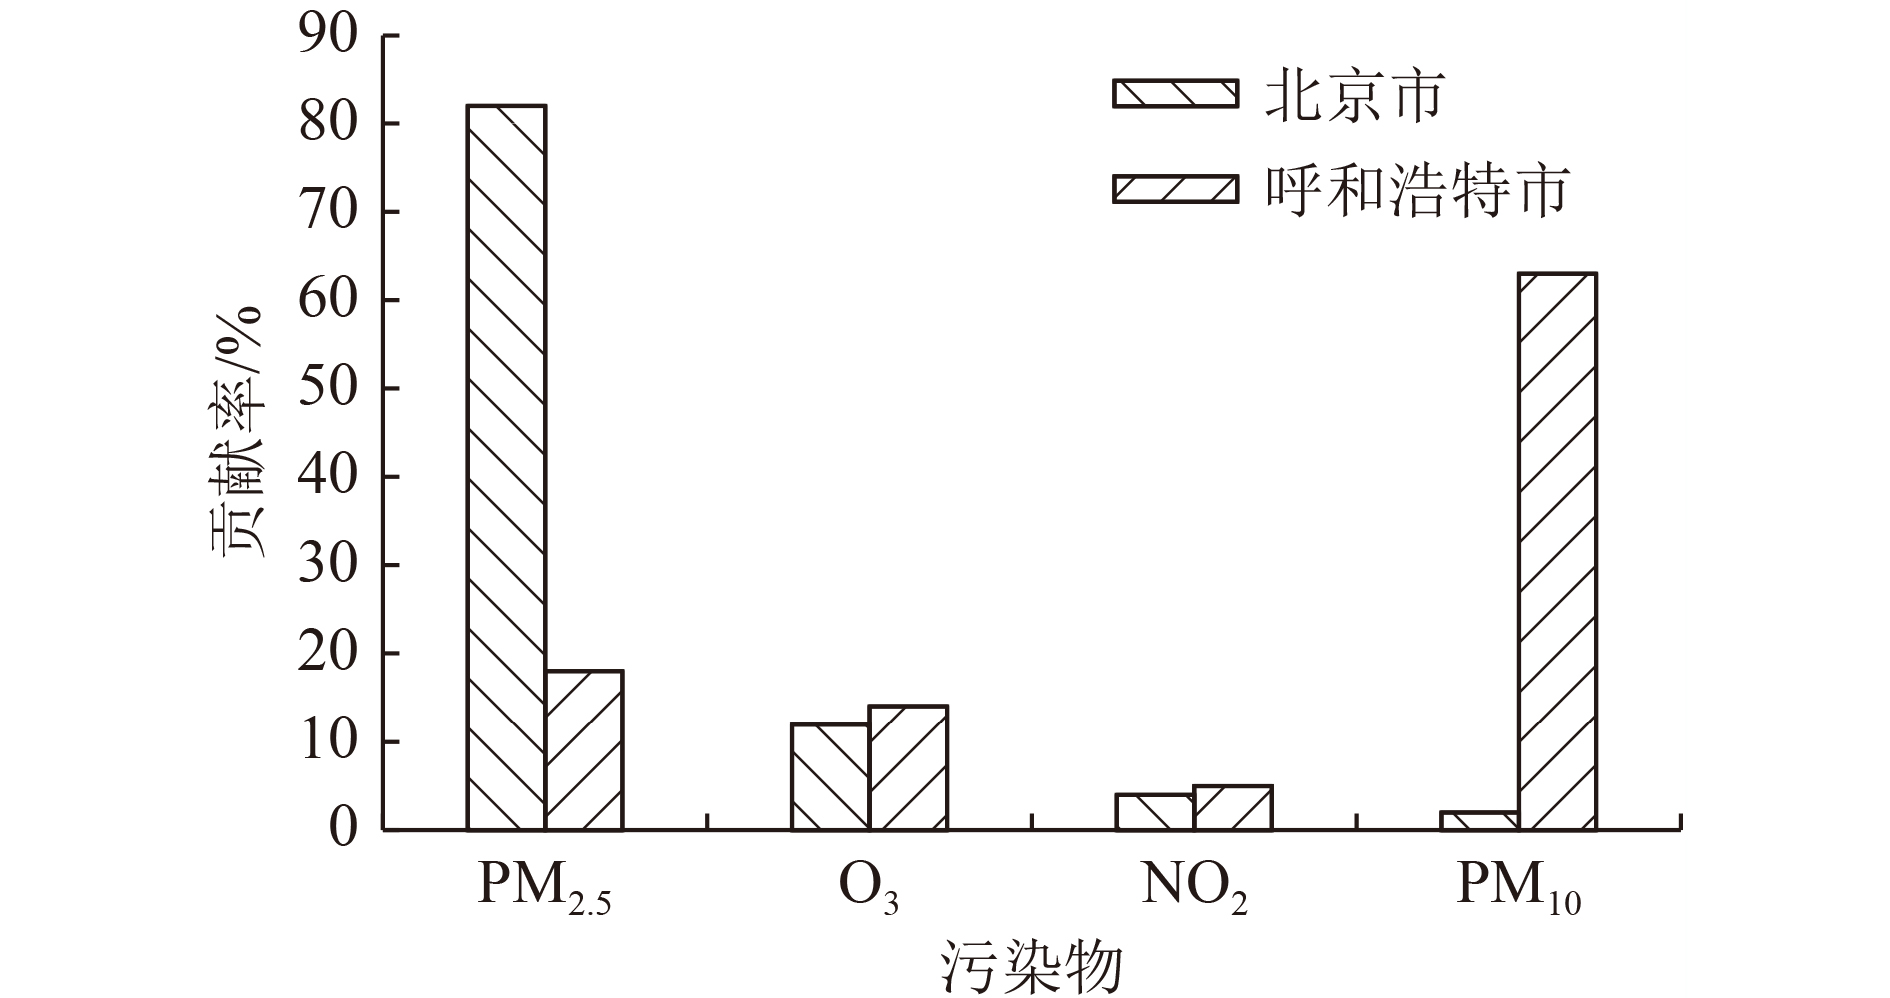
图 2 北京市和呼和浩特市主要污染物对AQI的贡献
Figure 2. Contribution of different major pollutants to the air quality index in Beijing and Hohhot

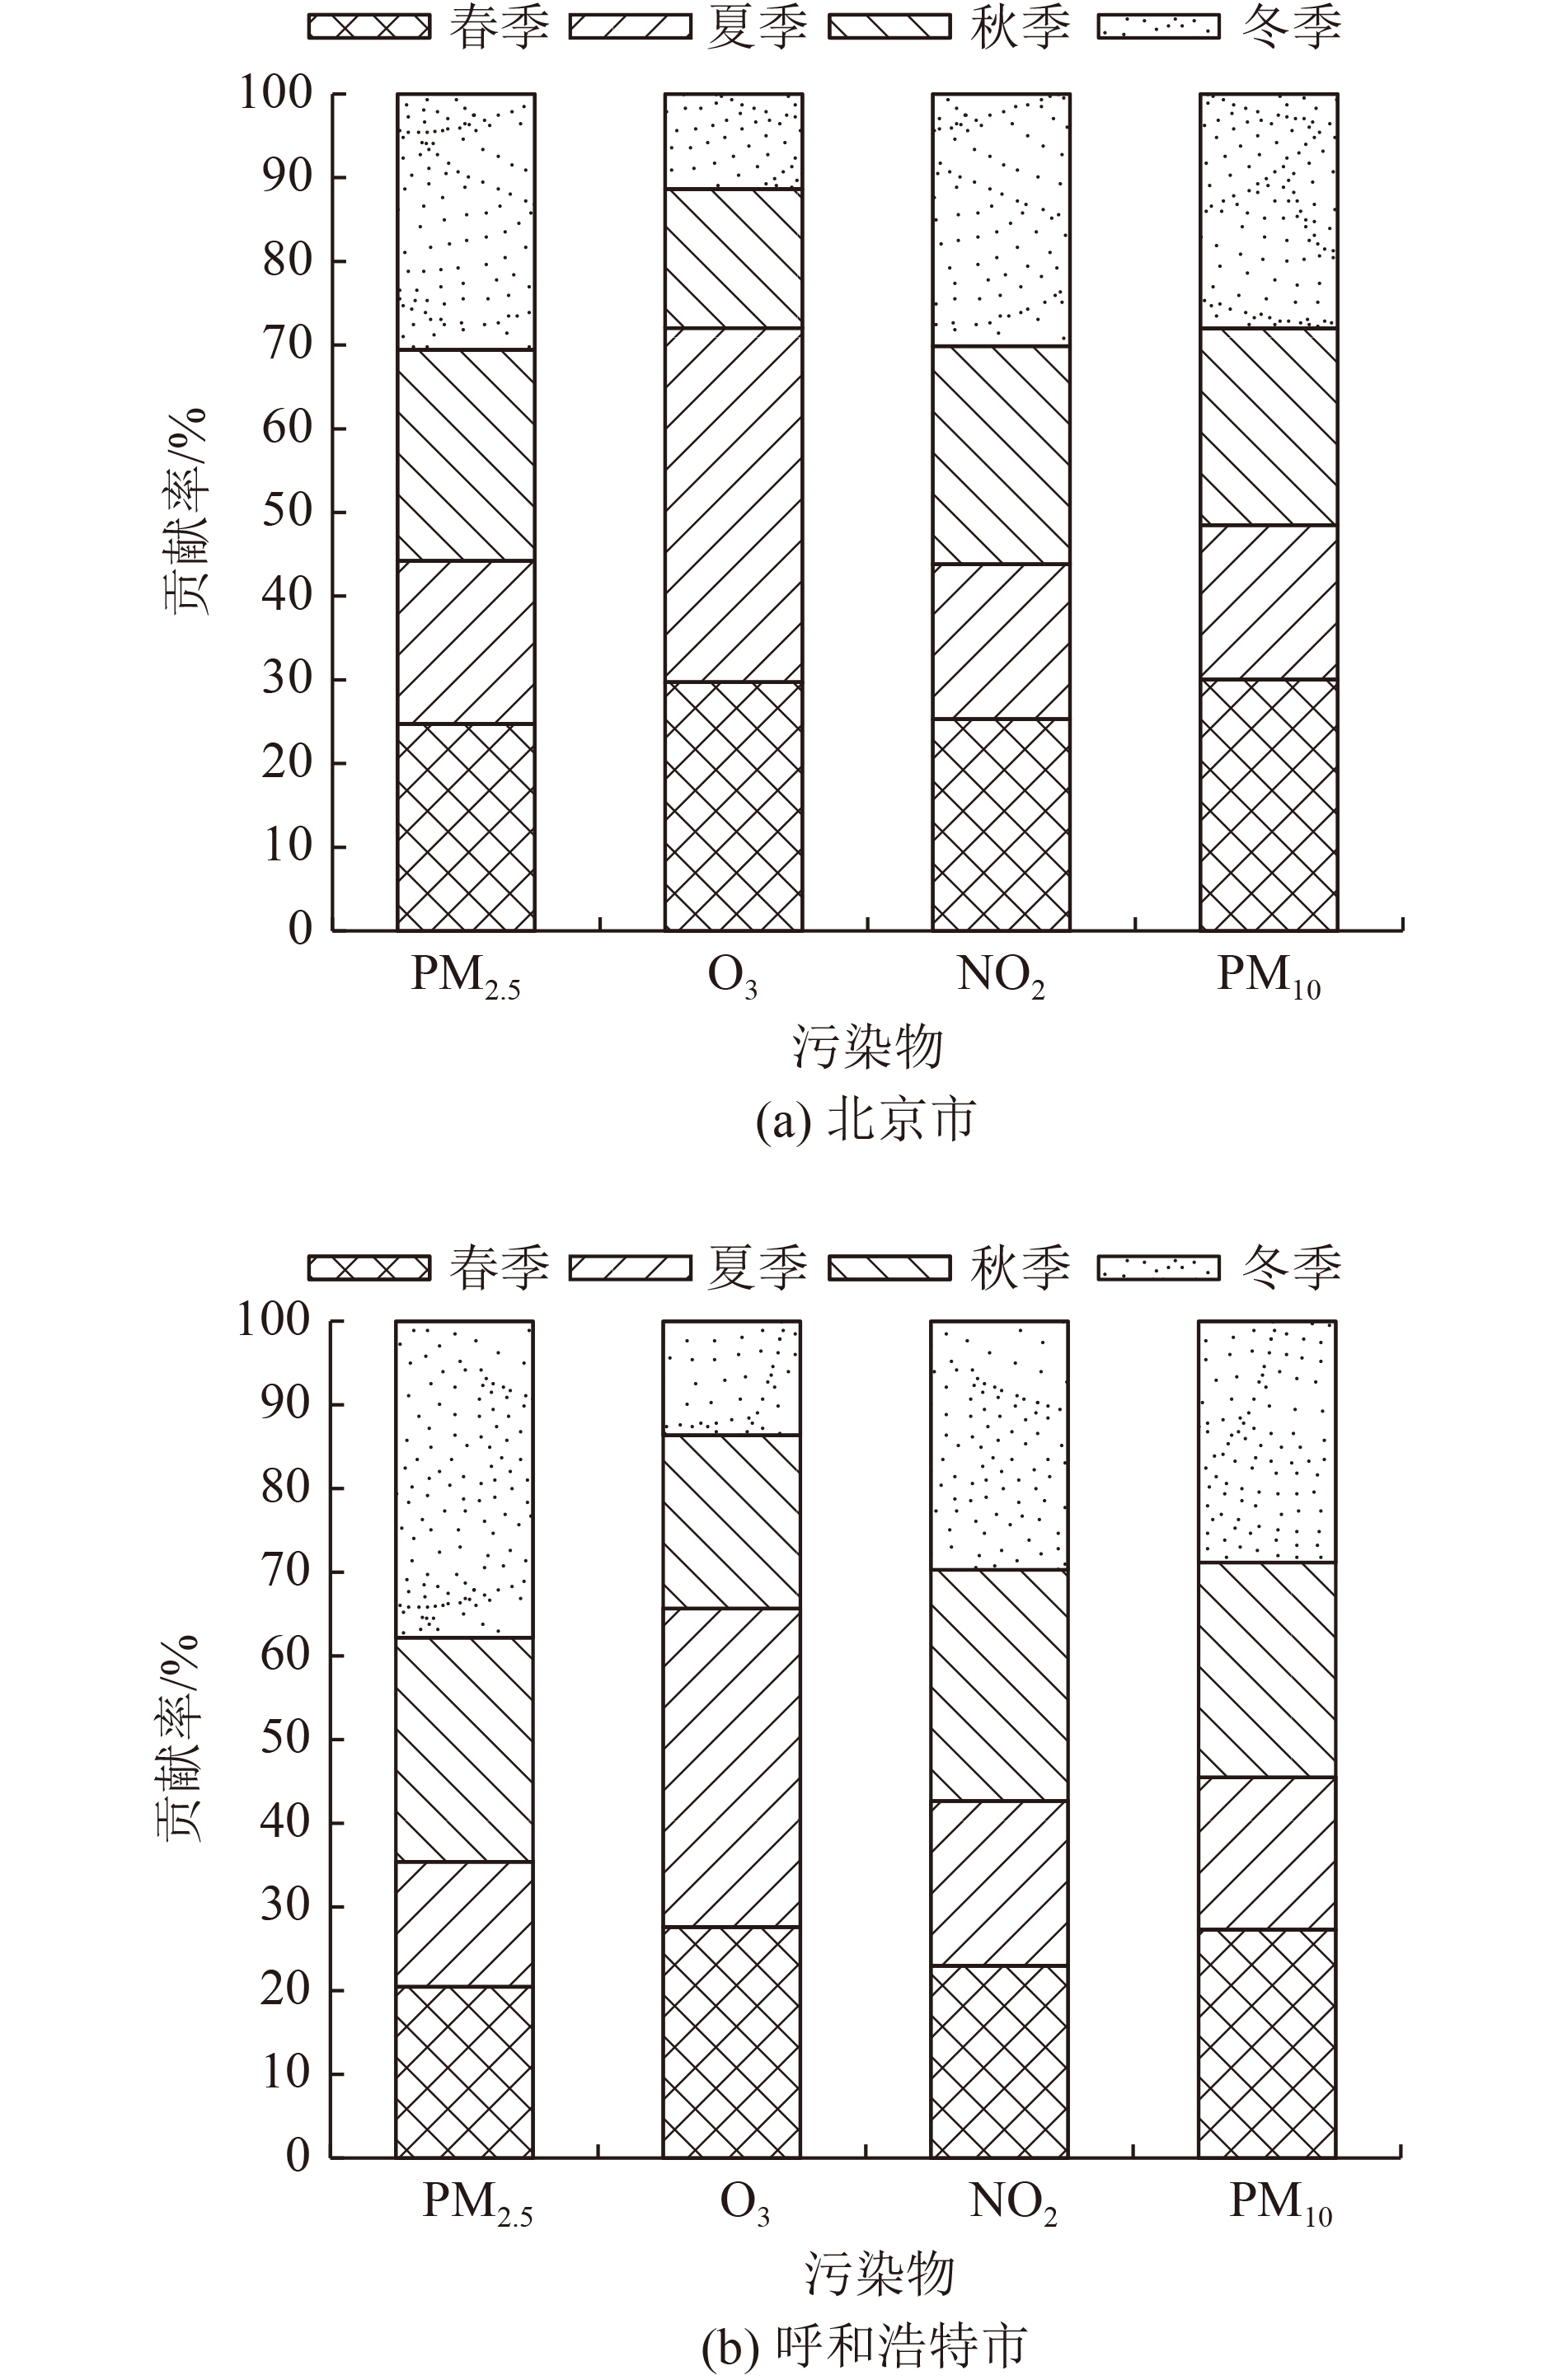
图 3 2014—2019年北京市和呼和浩特市首要污染物季节贡献
Figure 3. Seasonal contribution of major pollutants from 2014 to 2019 in Beijing and Hohhot
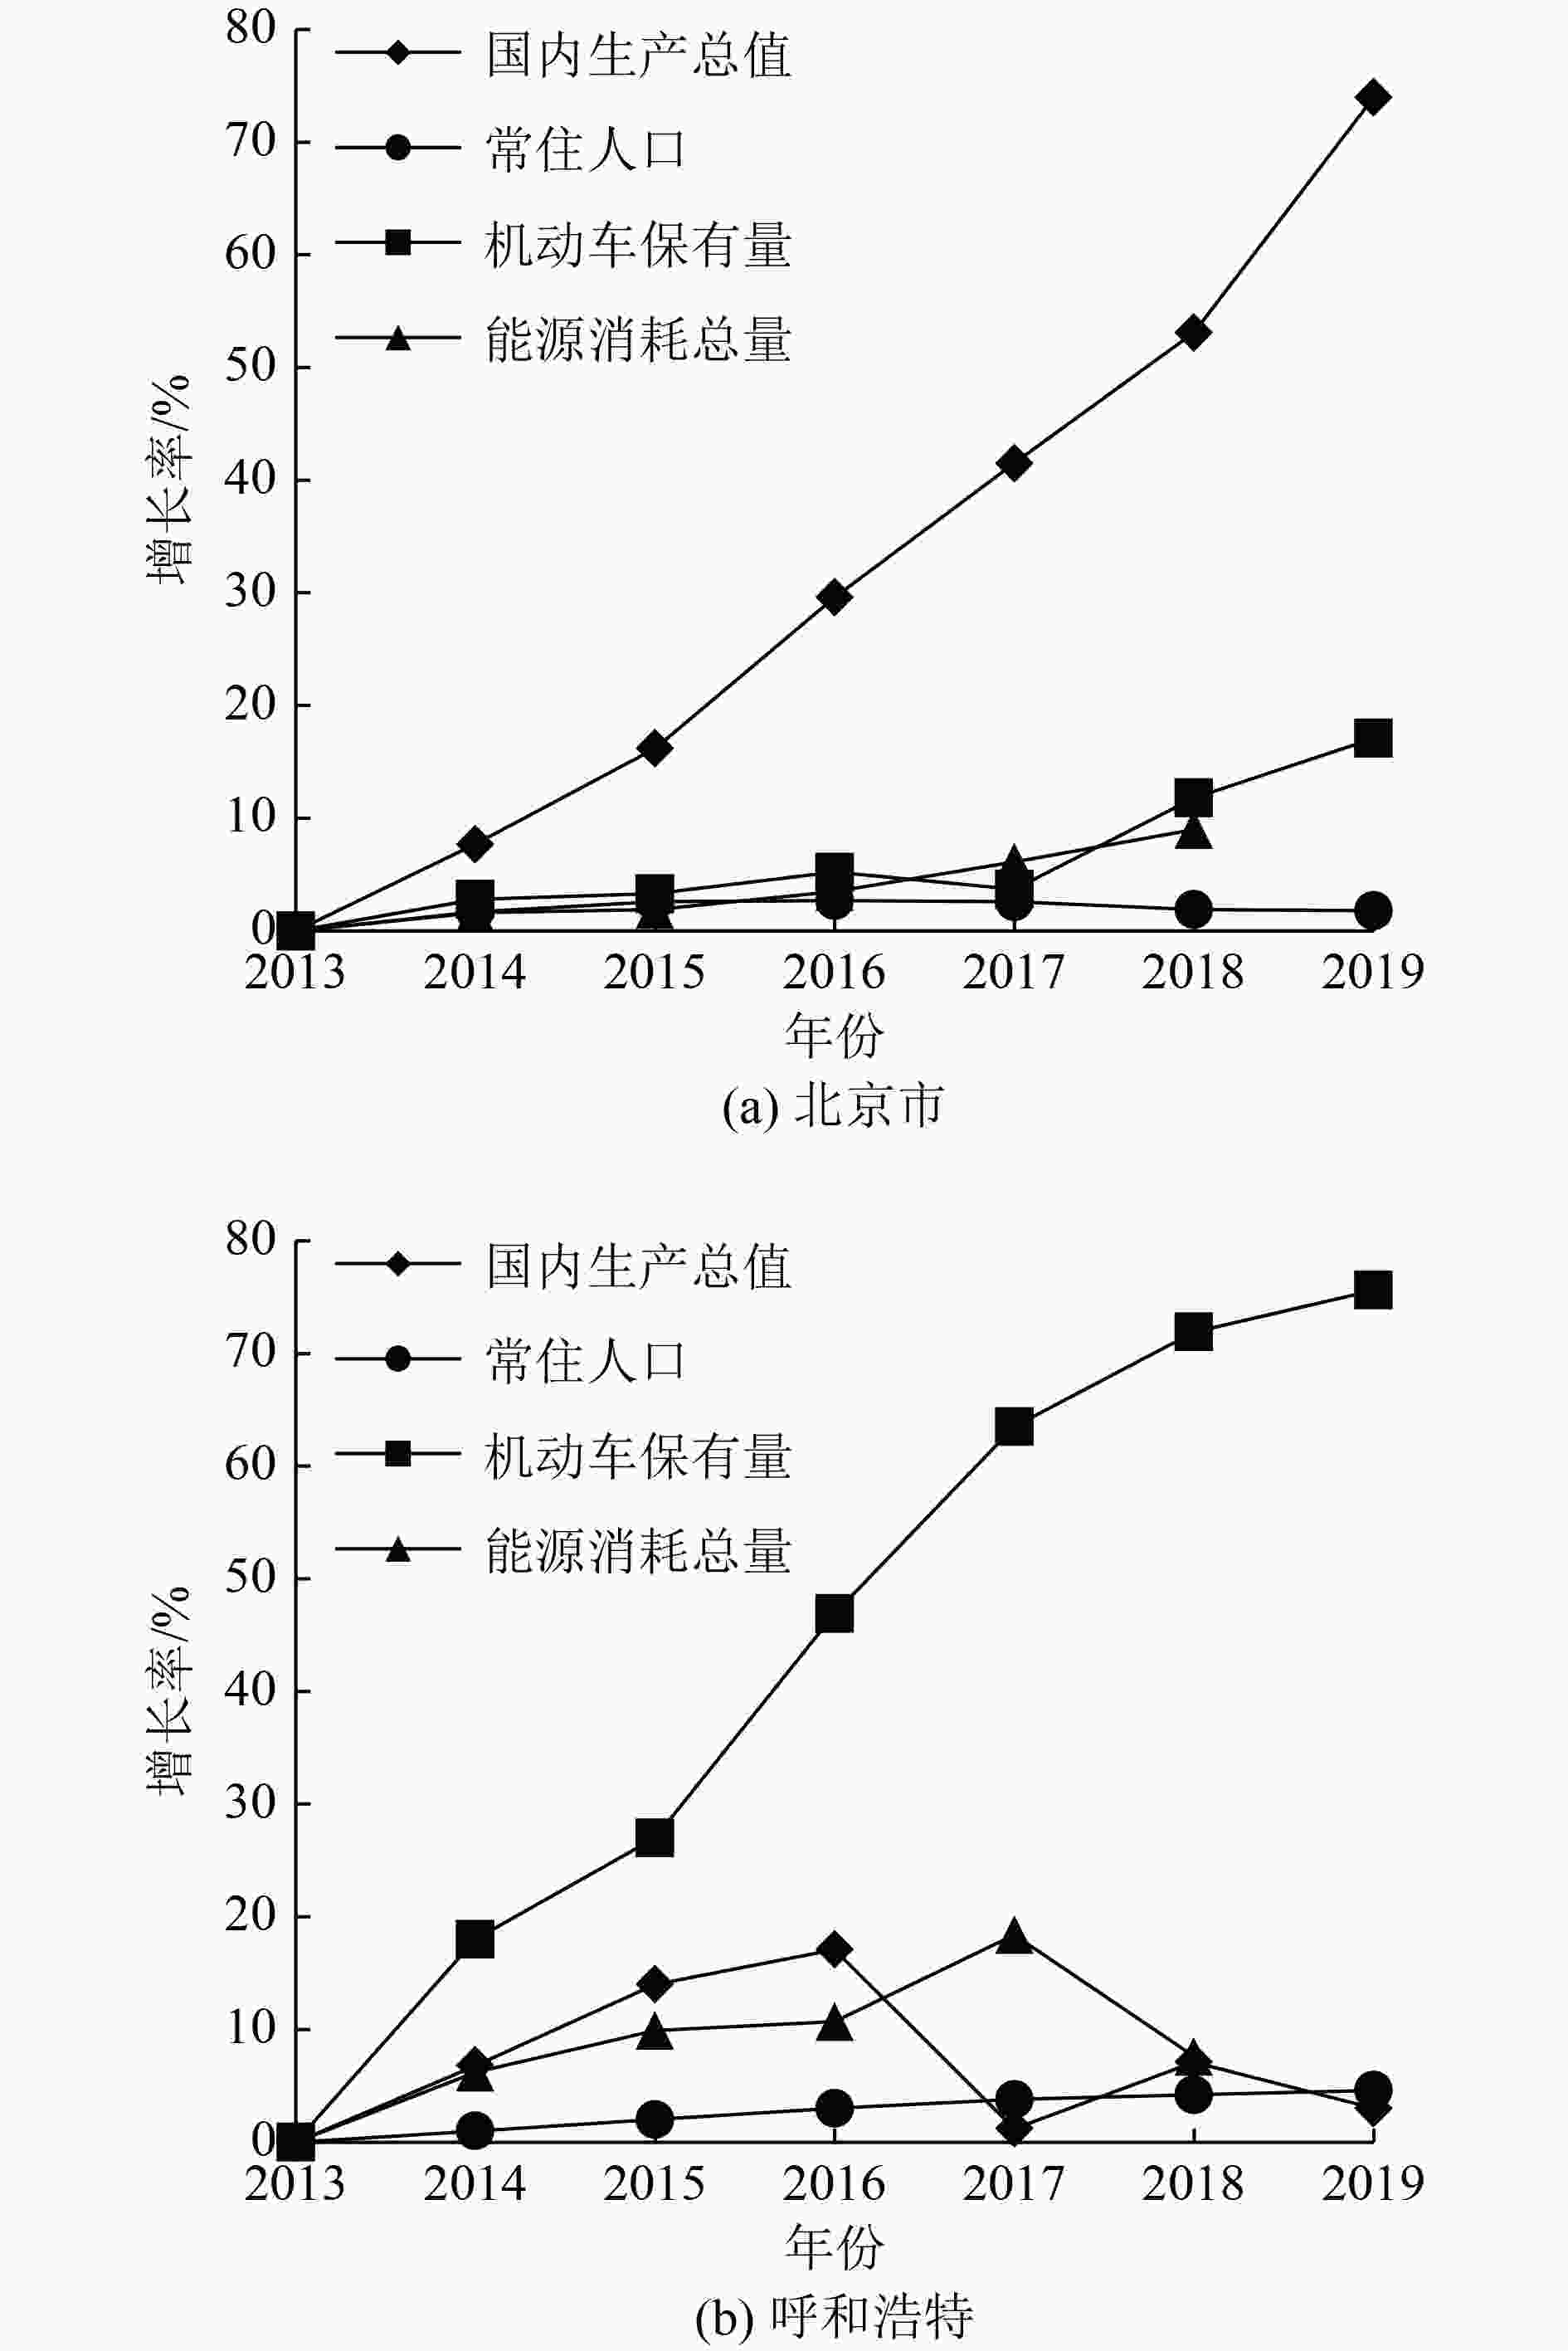
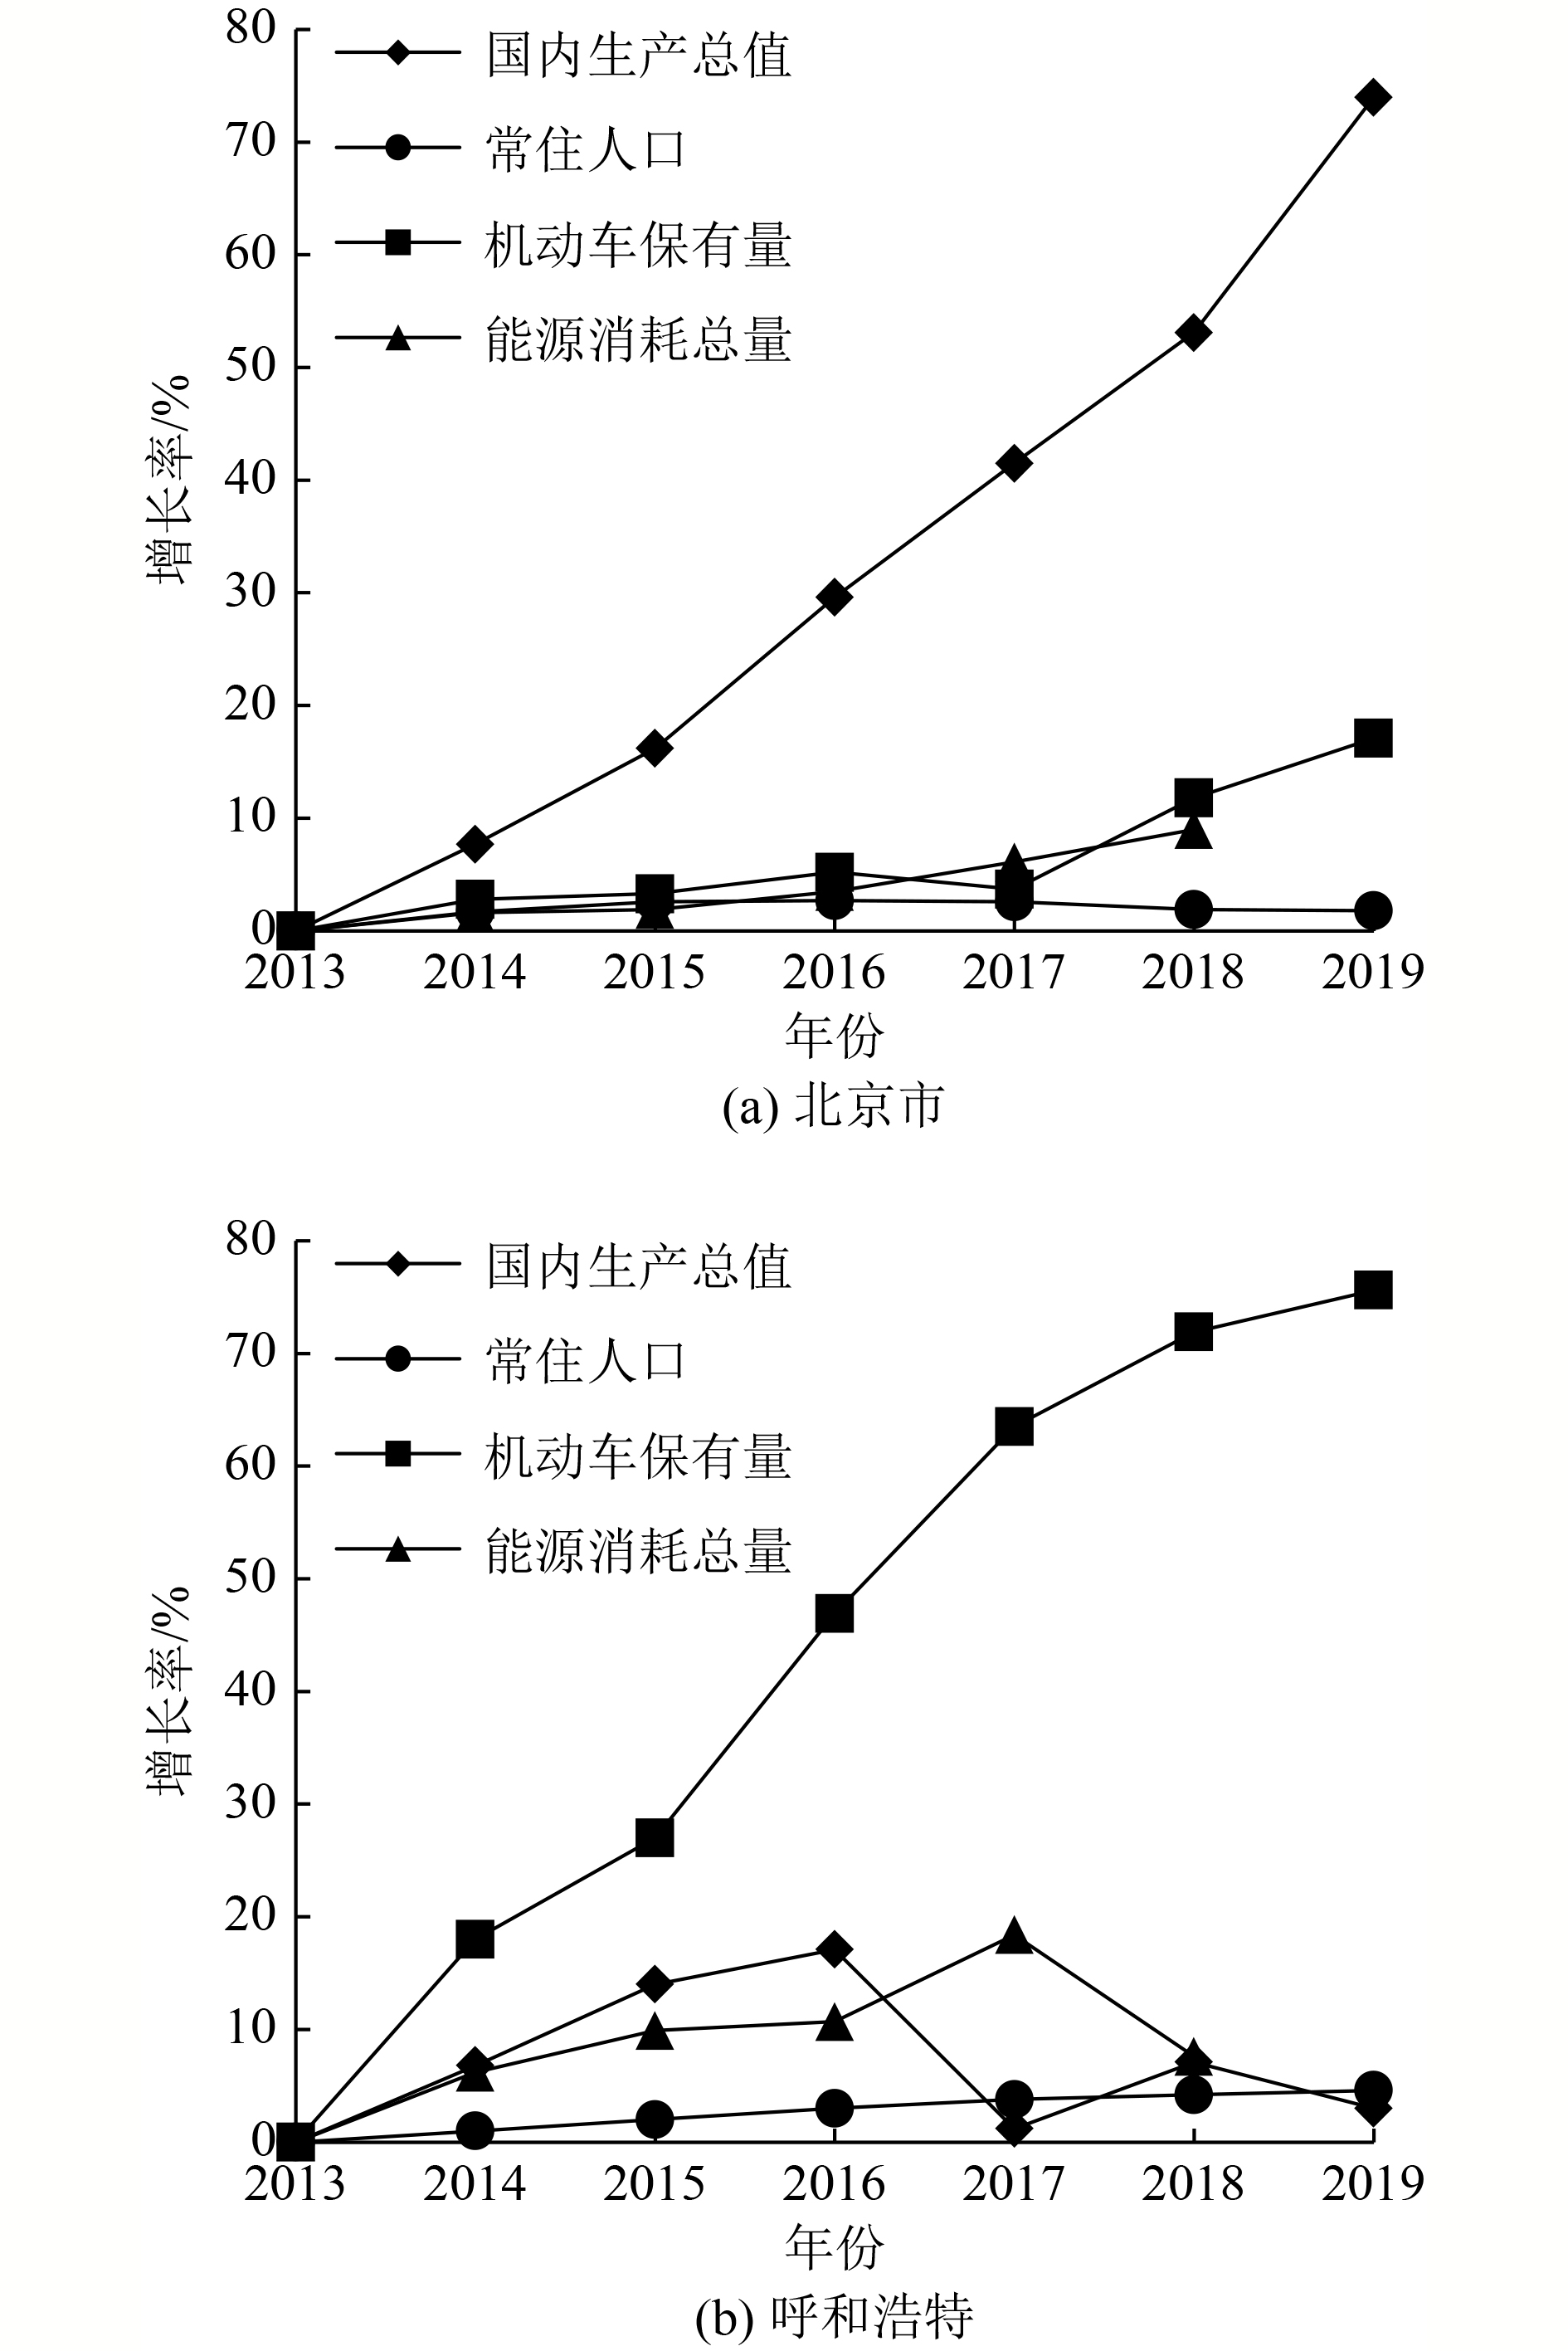
图 4 北京市和呼和浩特市国内生产总值、常住人口、能源消耗总量、机动车保有量变化趋势
Figure 4. The change trend of GDP, resident population, total energy consumption, motor vehicle ownership of the Beijing and Hohhot
表 1 空气质量级别及相关信息[10]
Table 1. Air quality levels and related information
AQI 空气质量级别 空气质量类别 0~50 一级 优 51~100 二级 良 101~150 三级 轻度污染 151~200 四级 中度污染 201~300 五级 重度污染 >300 六级 严重污染  下载: 导出CSV
表 2 2014—2019年北京市空气污染物浓度年均值比较
Table 2. Comparison of annual mean mass concentration in Beijing from 2014 to 2019
mg/m3 年份 PM10 SO2 NO2 PM2.5 CO O3 2014 0.117 0.021 0.055 0.085 1.274 0.099 2015 0.101 0.013 0.049 0.080 1.302 0.099 2016 0.097 0.010 0.048 0.073 1.160 0.096 2017 0.084 0.008 0.046 0.057 1.009 0.099 2018 0.076 0.006 0.041 0.050 0.842 0.100 2019 0.078 0.005 0.037 0.047 0.706 0.104
下载: 导出CSV
表 3 2014—2019年呼和浩特市空气污染物浓度年均值比较
Table 3. Comparison of annual mean mass concentration in Hohhot from 2014 to 2019
mg/m3 年份 PM10 SO2 NO2 PM2.5 CO O3 2014 0.116 0.047 0.045 0.044 1.907 0.067 2015 0.104 0.034 0.039 0.043 1.281 0.082 2016 0.094 0.028 0.042 0.040 1.197 0.091 2017 0.094 0.029 0.045 0.043 1.309 0.101 2018 0.078 0.019 0.040 0.032 1.179 0.093 2019 0.084 0.016 0.038 0.038 1.017 0.097
下载: 导出CSV
表 4 2014—2019年北京市各经济指标与污染物浓度相关性
Table 4. Correlation between economic indicators and pollutants in Beijing from 2014 to 2019
经济指标 PM10 SO2 NO2 PM2.5 O3 CO 国内生产总值 −0.896* −0.850* −0.973** −0.942** 0.735 −0.974** 常住人口 −0.158 −0.383 −0.087 0.043 −0.667 0.214 机动车保有量 −0.751 −0.686 −0.915* −0.818* 0.802 −0.915* 能源消耗总量 −0.930* −0.822 −0.917* −0.986** 0.338 −0.995** 注:**表示在0.01水平下相关性显著;*表示在0.05水平下相关性显著。
下载: 导出CSV
表 5 2014—2019年呼和浩特市各经济指标与污染物浓度相关性
Table 5. Correlation between economic indicators and pollutants in Hohhot from 2014 to 2019
经济指标 PM10 SO2 NO2 PM2.5 O3 CO 国内生产总值 −0.190 −0.276 0.284 0.314 0.714 −0.488 常住人口 −0.946* −0.941* −0.090 −0.683 0.925* −0.781 机动车保有量 −0.941** −0.936** −0.305 −0.700 0.888** −0.771 能源消耗总量 −0.997** −0.987** −0.358 −0.866 0.792 −0.815 注:同表4。
下载: 导出CSV
-
[1] SEINFELD J H. Air pollution: a half century of progress[J]. AIChE Journal,2004,50(6):1096-1108. doi: 10.1002/aic.10102 [2] DIAO X D, ZENG S X, TAM C M, et al. EKC analysis for studying economic growth and environmental quality: a case study in China[J]. Journal of Cleaner Production,2009,17(5):541-548. doi: 10.1016/j.jclepro.2008.09.007 [3] 李瑞娥, 张海军.中国环境库兹涅茨曲线的变化特征(1981—2004)[J]. 西安交通大学学报(社会科学版),2008,28(4):35-43.LI R E, ZHANG H J. An empirical analysis on the regional discrepancy and tendency of EKC in China (1981-2004)[J]. Journal of Xi'an Jiaotong University (Social Sciences),2008,28(4):35-43. [4] GROSSMAN G, KRUEGER A. Environmental impacts of a North American free trade agreement[R]. National Bureau of Economic Research, 1991. [5] 李正升.对环境库兹涅茨曲线的质疑与思考[J]. 生态经济,2010,26(11):55-58.LI Z S. Considerations of the environmental Kuznets curve[J]. Ecological Economy,2010,26(11):55-58. [6] 钟茂初, 张学刚.环境库兹涅茨曲线理论及研究的批评综论[J]. 中国人口·资源与环境,2010,20(2):62-67. doi: 10.3969/j.issn.1002-2104.2010.02.011ZHONG M C, ZHANG X G. Summary about the critique of environmental Kuznets curve[J]. China Population Resources and Environment,2010,20(2):62-67. doi: 10.3969/j.issn.1002-2104.2010.02.011 [7] 姜新华, 薛河儒, 张存厚, 等.基于主成分分析的呼和浩特市空气质量影响因素研究[J]. 安全与环境工程,2016,23(1):75-79.JIANG X H, XUE H R, ZHANG C H, et al. Research on the influencing factors of air quality in Hohhot City based on principal component analysis[J]. Safety and Environmental Engineering,2016,23(1):75-79. [8] 陈添.气象条件对北京市空气质量的影响[J]. 环境保护,2006,34(10):46-49. doi: 10.3969/j.issn.0253-9705.2006.10.012 [9] 国家质量监督检验检疫总局, 国家标准化管理委员会. 环境空气质量标准: GB 3095—2012[S]. 北京: 中国环境科学出版社, 2016. [10] 环境保护部. 环境空气质量指数(AQI)技术规定(试行): HJ 633—2012[S]. 北京: 中国环境科学出版社, 2016. [11] 李霞. 模拟研究京津冀和关中地区大气重污染期间各污染源排放对空气质量的贡献[D]. 西安: 中国科学院大学(中国科学院地球环境研究所), 2018. [12] 赵凯丽, 贾陈忠, 秦巧燕, 等.华北地区五所典型城市空气质量对比分析[J]. 山西师范大学学报(自然科学版),2018,32(3):87-94.ZHAO K L, JIA C Z, QIN Q Y, et al. Comparative analysis of air quality on five typical cities in North China[J]. Journal of Shanxi Normal University (Natural Science Edition),2018,32(3):87-94. [13] WANG Y A, ZHANG R Y, SARAVANAN R. Asian pollution climatically modulates mid-latitude cyclones following hierarchical modelling and observational analysis[J]. Nature Communications,2014,5:3098. doi: 10.1038/ncomms4098 [14] 王琼, 方建龙, 刘园园, 等.济南市大气颗粒物短期暴露对老年人群血清淀粉样蛋白P组分影响的定群研究[J]. 环境科学研究,2021,34(1):229-234.WANG Q, FANG J L, LIU Y Y, et al. Panel study on effects of short-term exposure of particulate matters on human serum amyloid P component[J]. Research of Environmental Sciences,2021,34(1):229-234. [15] 李明珠, 徐峻, 刘厚凤, 等.济南都市圈PM2.5来源贡献分析[J]. 环境工程技术学报,2021,11(2):209-216. doi: 10.12153/j.issn.1674-991X.20200145LI M Z, XU J, LIU H F, et al. PM2.5 source apportionment over Jinan Metropolitan Area[J]. Journal of Environmental Engineering Technology,2021,11(2):209-216. doi: 10.12153/j.issn.1674-991X.20200145 [16] 吴锴, 康平, 于雷, 等.2015—2016年中国城市臭氧浓度时空变化规律研究[J]. 环境科学学报,2018,38(6):2179-2190.WU K, KANG P, YU L, et al. Pollution status and spatio-temporal variations of ozone in China during 2015-2016[J]. Acta Scientiae Circumstantiae,2018,38(6):2179-2190. [17] TANG G, WANG Y, LI X, et al. Spatial-temporal variations in surface ozone in Northern China as observed during 2009-2010 and possible implications for future air quality control strategies[J]. Atmospheric Chemistry and Physics,2012,12(5):2757-2776. doi: 10.5194/acp-12-2757-2012 [18] 罗蕊, 王学中, 林国梁, 等.一次污染物对臭氧生成的影响研究[J]. 环境科学研究,2006,19(4):26-30. doi: 10.3321/j.issn:1001-6929.2006.04.005LUO R, WANG X Z, LIN G L, et al. Study on the impact of primary pollutants on ozone formation[J]. Research of Environmental Sciences,2006,19(4):26-30. doi: 10.3321/j.issn:1001-6929.2006.04.005 [19] 林道辉, 沈学优, 刘亚儿.环境与经济协调发展理论研究进展[J]. 环境污染与防治,2002,24(2):120-123. doi: 10.3969/j.issn.1001-3865.2002.02.020LIN D H, SHEN X Y, LIU Y E. Theory advance of environment and economy coordinating development[J]. Environmental Pollution & Control,2002,24(2):120-123. doi: 10.3969/j.issn.1001-3865.2002.02.020 [20] 张晓东, 池天河.90年代中国省级区域经济与环境协调度分析[J]. 地理研究,2001,20(4):506-515. doi: 10.3321/j.issn:1000-0585.2001.04.015ZHANG X D, CHI T H. Differentiating and analysis of the coordination degree between economic development and environment of provinces (regions) in China[J]. Geographical Research,2001,20(4):506-515. doi: 10.3321/j.issn:1000-0585.2001.04.015 [21] 国家统计局. 中国统计年鉴[J]. 北京: 中国统计出版社, 2019. [22] 康婷婷, 刘丹丹.工业城市臭氧来源、污染特征与变化趋势分析: 以京津冀、长三角、珠三角等地区部分工业城市为例[J]. 江西化工,2018(6):13-14. doi: 10.3969/j.issn.1008-3103.2018.06.004KANG T T, LIU D D. An analysis of ozone source, polution characteristics and evolution trend in industrial cities[J]. Jiangxi Chemical Industry,2018(6):13-14. doi: 10.3969/j.issn.1008-3103.2018.06.004 [23] 徐丽娜, 李兴华, 冯震, 等.呼和浩特市大气污染特征及气象影响因子研究[J]. 干旱区资源与环境,2019,33(6):150-157.XU L N, LI X H, FENG Z, et al. The study of characteristics of air pollution and meteorological factors in Hohhot[J]. Journal of Arid Land Resources and Environment,2019,33(6):150-157. [24] 刘小真, 任羽峰, 刘忠马, 等.南昌市大气颗粒物污染特征及PM2.5来源解析[J]. 环境科学研究,2019,32(9):1546-1555.LIU X Z, REN Y F, LIU Z M, et al. Pollution characteristics of atmospheric particles and source apportionment of PM2.5 in Nanchang City[J]. Research of Environmental Sciences,2019,32(9):1546-1555. [25] HUANG R J, ZHANG Y L, BOZZETTI C, et al. High secondary aerosol contribution to particulate pollution during haze events in China[J]. Nature,2014,514:218-222. doi: 10.1038/nature13774 [26] 纪亮, 袁盈, 李刚, 等.我国机动车排放标准的大气污染物减排效果研究[J]. 环境工程技术学报,2011,1(3):237-242. doi: 10.3969/j.issn.1674-991X.2011.03.039JI L, YUAN Y, LI G, et al. Study on emission reduction effect of motor vehicle emission standards in China[J]. Journal of Environmental Engineering Technology,2011,1(3):237-242. doi: 10.3969/j.issn.1674-991X.2011.03.039 [27] 刘艳菊, 杨峥, 刘庆阳, 等.北京4个功能区春冬季大气重污染期间PM10和PM2.5化学污染特征及影响因素分析[J]. 环境工程技术学报,2021,11(4):631-646. doi: 10.12153/j.issn.1674-991X.20200214LIU Y J, YANG Z, LIU Q Y, et al. Chemical pollution characteristics of PM10 and PM2.5 during heavy air pollution in spring and winter in four functional areas of Beijing and their associated influencing factors[J]. Journal of Environmental Engineering Technology,2021,11(4):631-646. doi: 10.12153/j.issn.1674-991X.20200214 [28] 于洲. 杭州市大气污染物浓度时空变化特征分析[D]. 南京: 南京信息工程大学, 2016. [29] 朱珊珊. 河北邯郸市2013—2017年大气颗粒物化学组成特征的研究[D]. 南宁: 广西大学, 2019. [30] 李娜, 周涛, 刘小雪, 等.廊坊市臭氧污染特征及其与气象因素的关系[J]. 环境工程技术学报,2021,11(2):217-225. doi: 10.12153/j.issn.1674-991X.20200147LI N, ZHOU T, LIU X X, et al. Characteristics of ozone pollution and its relationship with meteorological factors in Langfang City[J]. Journal of Environmental Engineering Technology,2021,11(2):217-225. doi: 10.12153/j.issn.1674-991X.20200147 [31] 梁银双, 刘黎明.冬季供暖对北京市空气质量影响的效应测算[J]. 环境科学与技术,2015,38(12):272-275.LIANG Y S, LIU L M. The calculation of effect on Beijing's air quality of winter heating[J]. Environmental Science & Technology,2015,38(12):272-275. [32] 邱雪, 张明军, 王圣杰.西北干旱区PM10浓度特征及其与水平能见度的关系[J]. 生态环境学报,2015,24(3):436-443.QIU X E, ZHANG M J, WANG S J. The PM10 concentration characteristics and its relationship with horizontal visibility in arid northwest China[J]. Ecology and Environmental Sciences,2015,24(3):436-443. [33] 金曼, 田璐, 佟俊旺.我国大气PM10污染对人群死亡率影响的meta分析[J]. 环境与健康杂志,2016,33(8):725-729.JIN M, TIAN L, TONG J W. Association between air inhalable particles and mortality in China: a meta-analysis[J]. Journal of Environment and Health,2016,33(8):725-729. [34] 申俊. PM2.5污染对公共健康和社会经济的影响研究[D]. 武汉: 中国地质大学, 2018. [35] 滕洁. 室外空气污染与呼吸系统疾病住院治疗的短期效应研究[D]. 合肥: 中国科学技术大学, 2019. [36] PAN R B, WANG X, YI W Z, et al. Interactions between climate factors and air quality index for improved childhood asthma self-management[J]. Science of the Total Environment,2020,723:137804. doi: 10.1016/j.scitotenv.2020.137804 [37] FORASTIERE F. Climate change and health: a challenge for epidemiology and public health[J]. International Journal of Public Health,2010,55(2):83-84. doi: 10.1007/s00038-009-0096-9 [38] MCMICHAEL A J. The urban environment and health in a world of increasing globalization: issues for developing countries[J]. Bulletin of the World Health Organization,2000,78(9):1117-1126. □ -

 下载:
下载:

 点击查看大图
计量
- 文章访问数: 308
- HTML全文浏览量: 166
- PDF下载量: 47
- 被引次数: 0