

Temporal and spatial distribution characteristics of atmospheric pollutants in urban area of Kunming City
-
摘要:
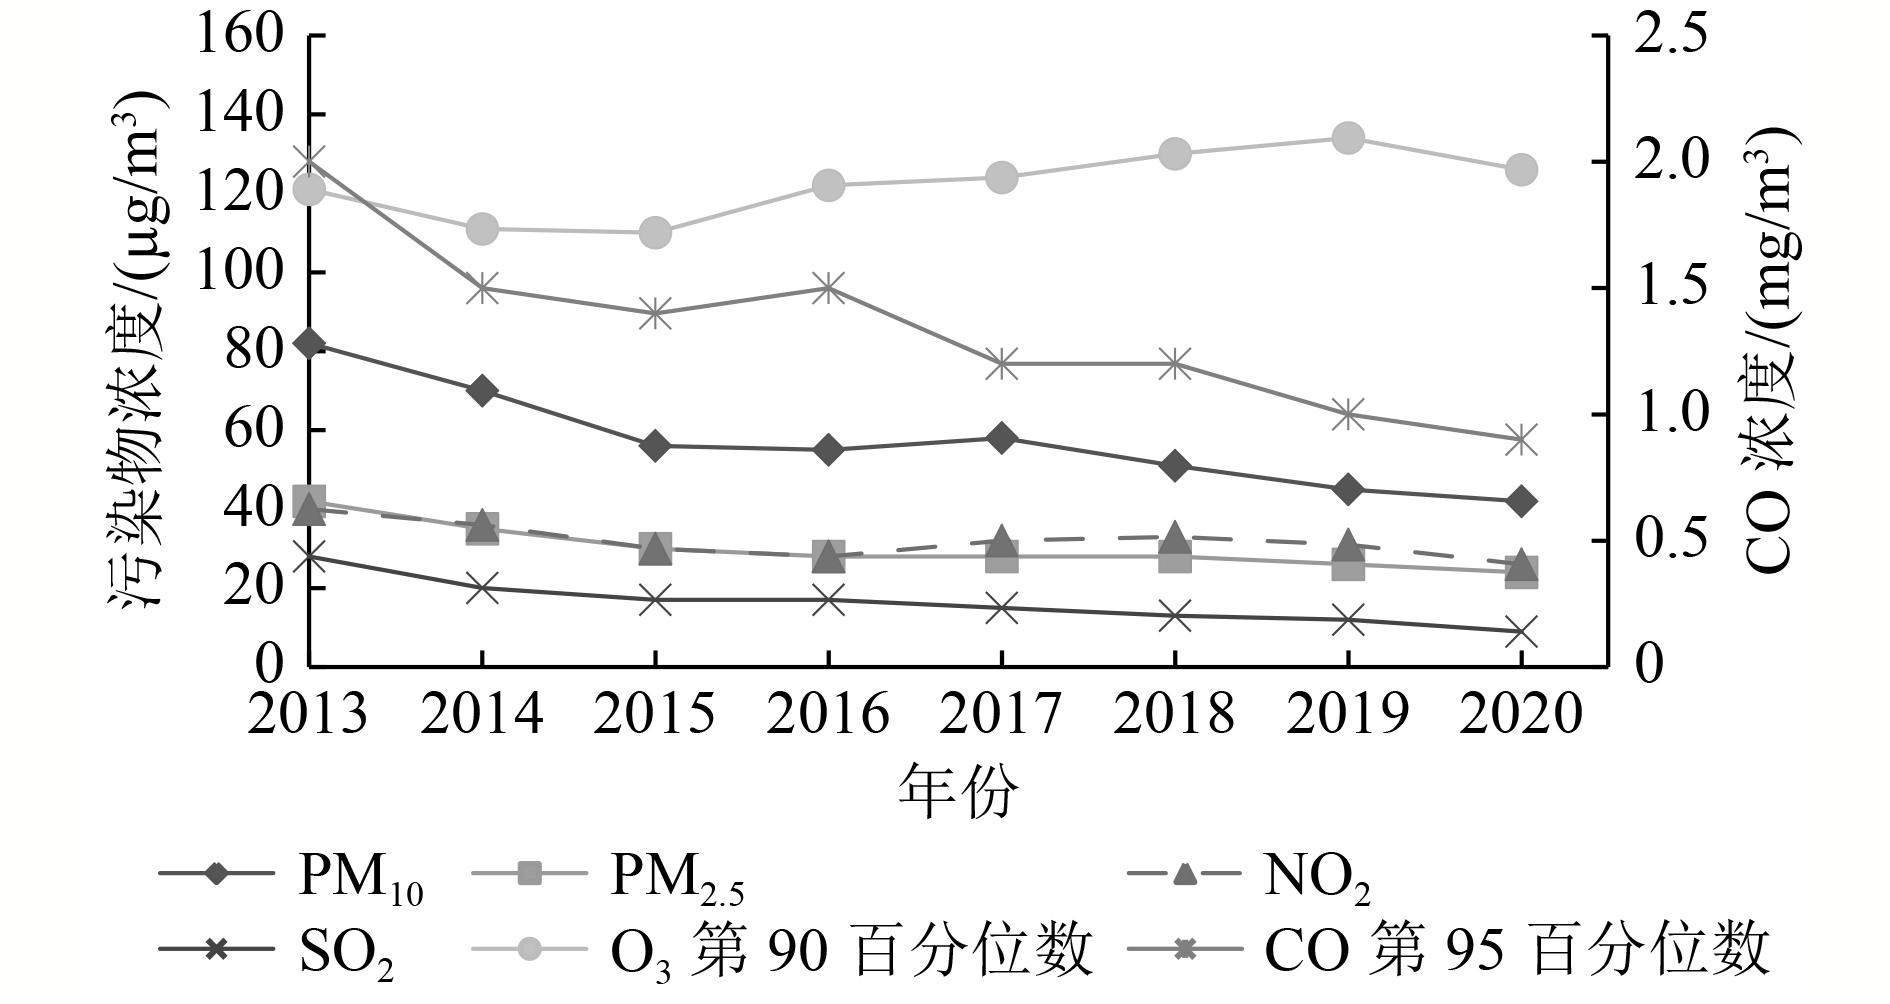
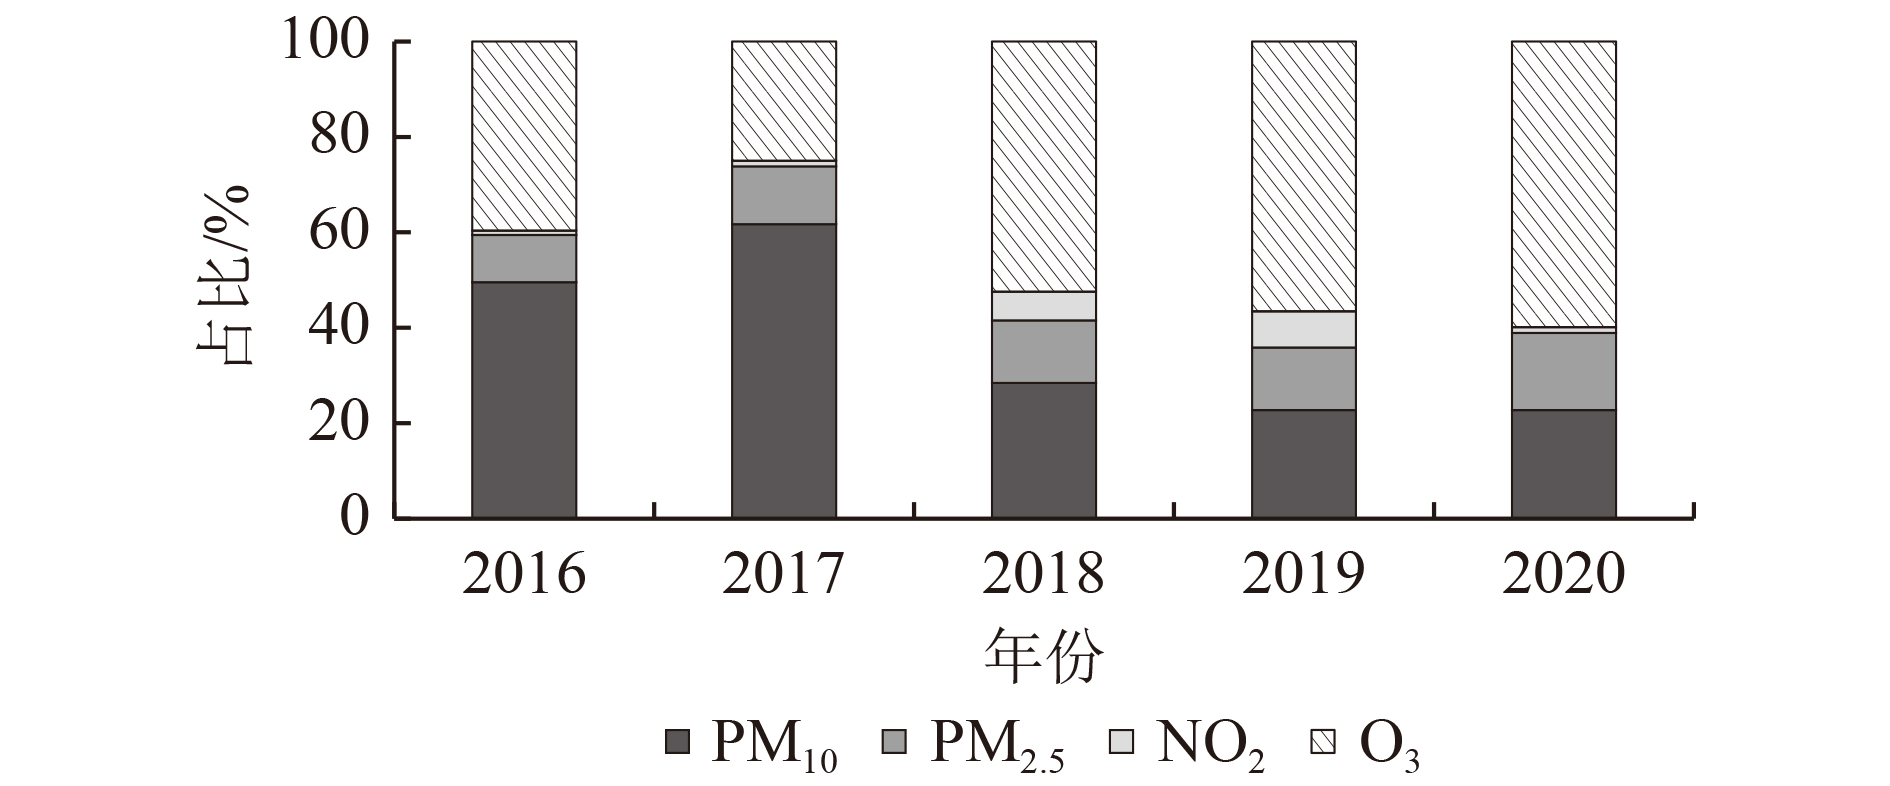
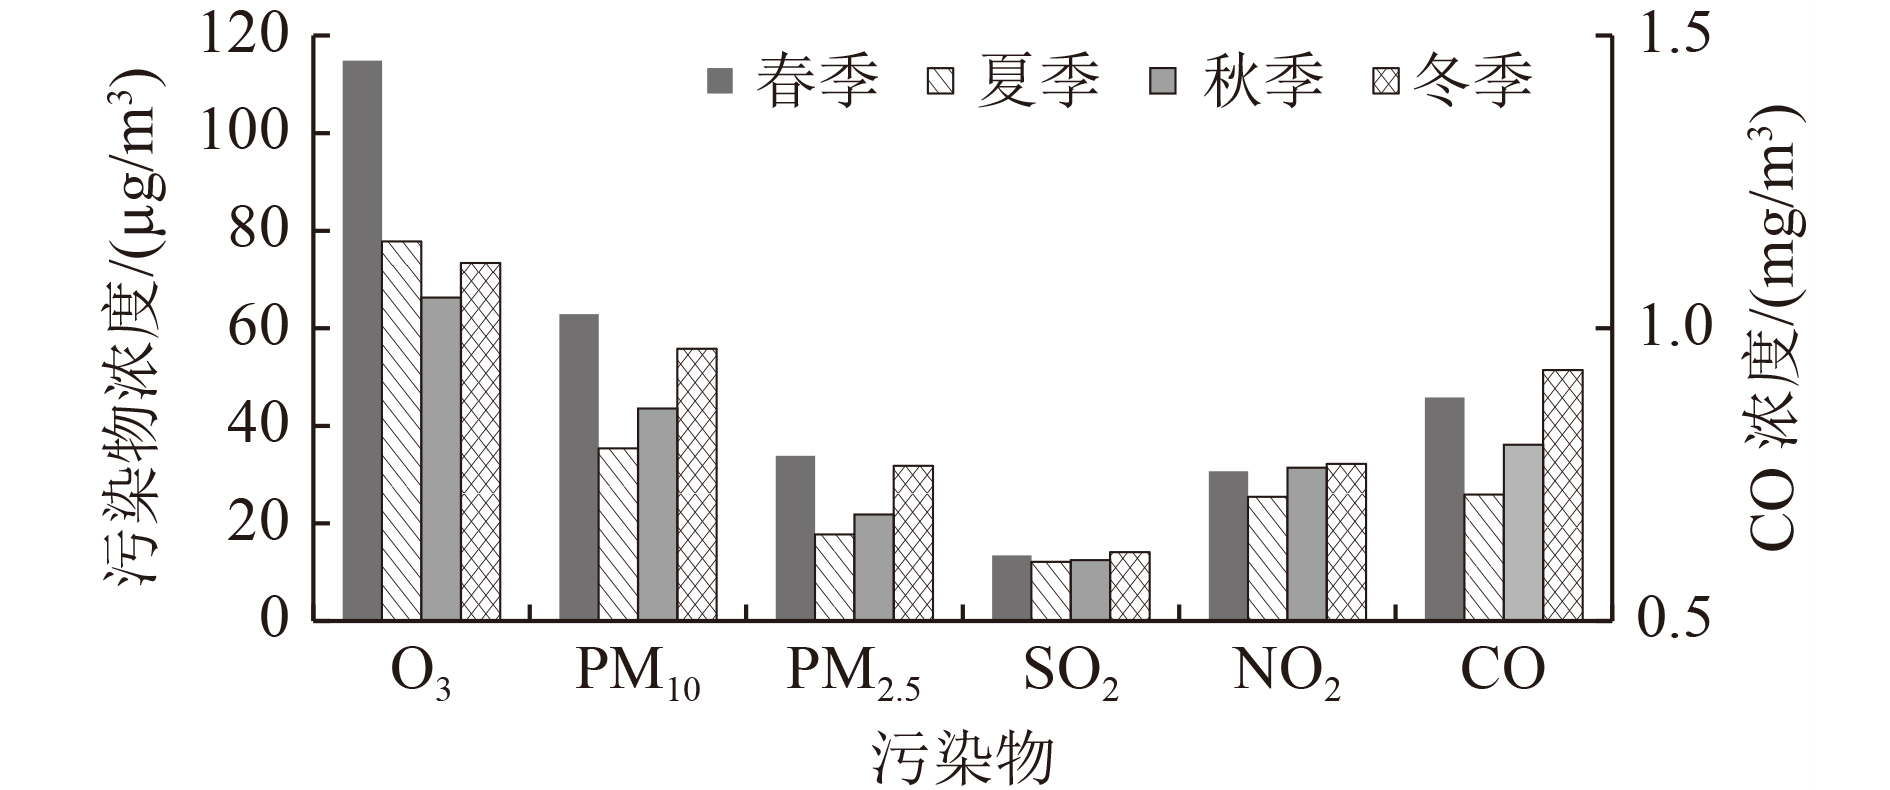
利用2013—2020年昆明城区国控点监测数据,分析大气污染物时空分布特征。结果表明:2013—2020年昆明城区O3年均浓度总体呈上升趋势,其余污染物年均浓度呈下降趋势,O3增幅为4.1%,SO2降幅为67.9%,其余污染物降幅为35.0%~55.0%。超过GB 3095—2012《环境空气质量标准》一级以上标准的首要污染物天数占比显示,O3已经代替PM2.5成为昆明市最主要的大气污染物;O3浓度春季最高,夏季次之,秋季最低;PM10和PM2.5浓度春、冬季高,夏季最低;SO2、NO2、CO浓度冬季最高,夏季最低,但SO2和NO2四季变化幅度较其他污染物小。春、夏季的O3,冬、春季的PM2.5是昆明市大气污染的防治的重点。O3浓度日变化呈单峰型分布,CO、NO2、PM10、PM2.5浓度呈双峰型分布,但PM10、PM2.5浓度峰谷变化不明显;NO2、CO、PM2.5、PM10浓度峰值出现在早高峰时段,O3浓度峰值出现在14:00—15:00,SO2浓度上午高于下午。大气污染物浓度分布具有明显的空间差异性,SO2、PM2.5、NO2、PM10、CO浓度城区西部高于东部,分别高出54.5%、20.0%、17.9%、14.6%和2.4%,O3浓度则相反,城区东部高于西部,高出9.0%;SO2、NO2、O3浓度东部、西部差异呈逐年减小趋势,不排除上风向安宁工业园区污染传输影响变弱的可能性。
Abstract:Based on the monitoring data of national control monitoring stations in the urban area of Kunming in 2013-2020, the temporal and spatial distribution features of atmospheric pollutants were analyzed. The results showed that during the period of 2013-2020, the annually-averaged concentration of O3 in the urban area of Kunming generally showed an upward trend, and the annually-averaged concentrations of other pollutants showed a downward trend. The annually-averaged concentration of O3 increased by 4.1%, while that of SO2 dropped by 67.9% and other pollutants dropped by 35.0%-55.0%. The proportion of days of primary pollutants exceeding Level 1 or above the standard of Ambient Air Quality Standards (GB 3095—2012 ) indicated that O3 instead of PM2.5 had become the primary atmospheric pollutant in Kunming. The highest concentration of O3 appeared in spring, followed by summer, and the lowest in autumn, the concentrations of PM10 and PM2.5 were generally high in spring and winter but low in autumn, and as for SO2, NO2 and CO, the highest concentrations appeared in winter and lowest in summer. But the variation ranges in four seasons of SO2 and NO2 were smaller than that of other pollutants. O3 in spring and summer and PM2.5 in spring and winter were the key points of air pollutants control in Kunming. The daily variation of O3 presented single peak distribution, CO, NO2, PM10 and PM2.5 presented double peaks distribution, but the variation of peak-valley of PM10 and PM2.5 concentrations were not distinct. The peaks of NO2, PM2.5, PM10 and CO were identical to morning rush hours, the peak of O3 usually appeared during 14:00-15:00, and the concentration of SO2 was higher in the morning than in the afternoon. As for spatial distribution patterns, remarkable distinctions existed for different pollutants. The concentrations of SO2, PM2.5, NO2, PM10 and CO of western stations were 54.5%, 20.0%, 17.9%, 14.6% and 2.4%, respectively higher than those of eastern stations. On the contrary, O3 concentrations in eastern stations were 9.0% higher than that of western stations. The difference of SO2, NO2 and O3 concentrations between eastern and western stations had narrowed down year by year, and this might be caused by the weakening of the impact of pollution transmission from Anning Industrial Park.
-

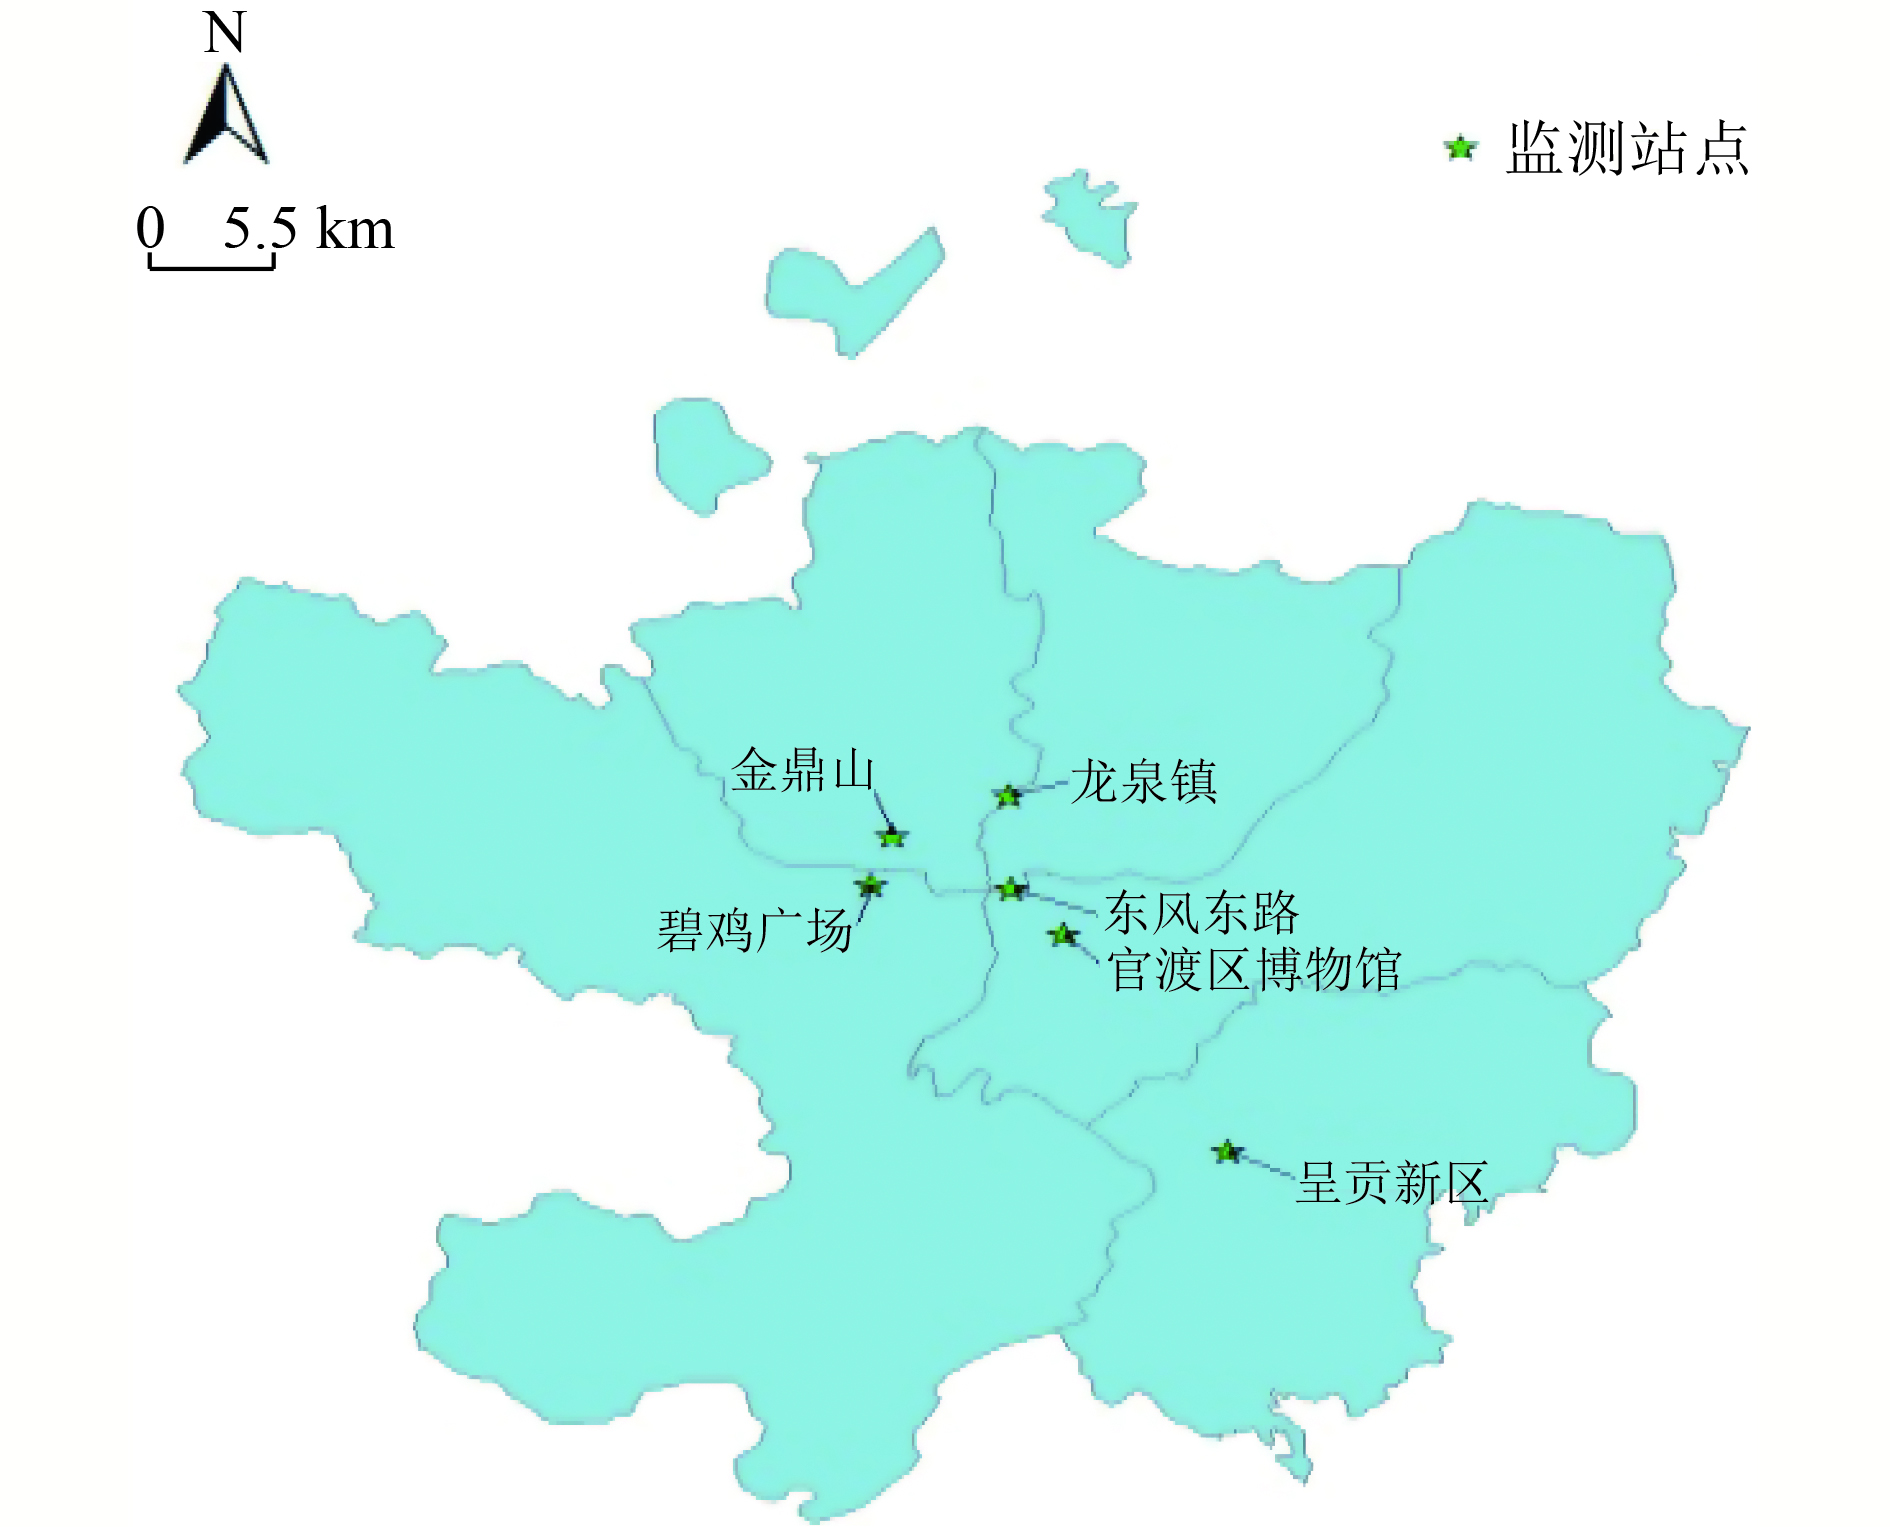
图 1 昆明城区空气质量监测站点分布示意
Figure 1. Distribution of urban air quality monitoring points in Kunming

图 2 2013—2020年昆明城区大气污染物浓度年际变化趋势
Figure 2. Interannual variation trends of atmospheric pollutants concentration in urban area of Kunming from 2013 to 2020

图 3 2016—2020年超过一级标准的首要污染物天数占比
Figure 3. Proportion of days with primary pollutants exceeding the Level 1 standard from 2016 to 2020

图 4 2016—2020年昆明城区大气污染物浓度季节变化
Figure 4. Seasonal variation of atmospheric pollutants concentration in urban area of Kunming from 2016 to 2020
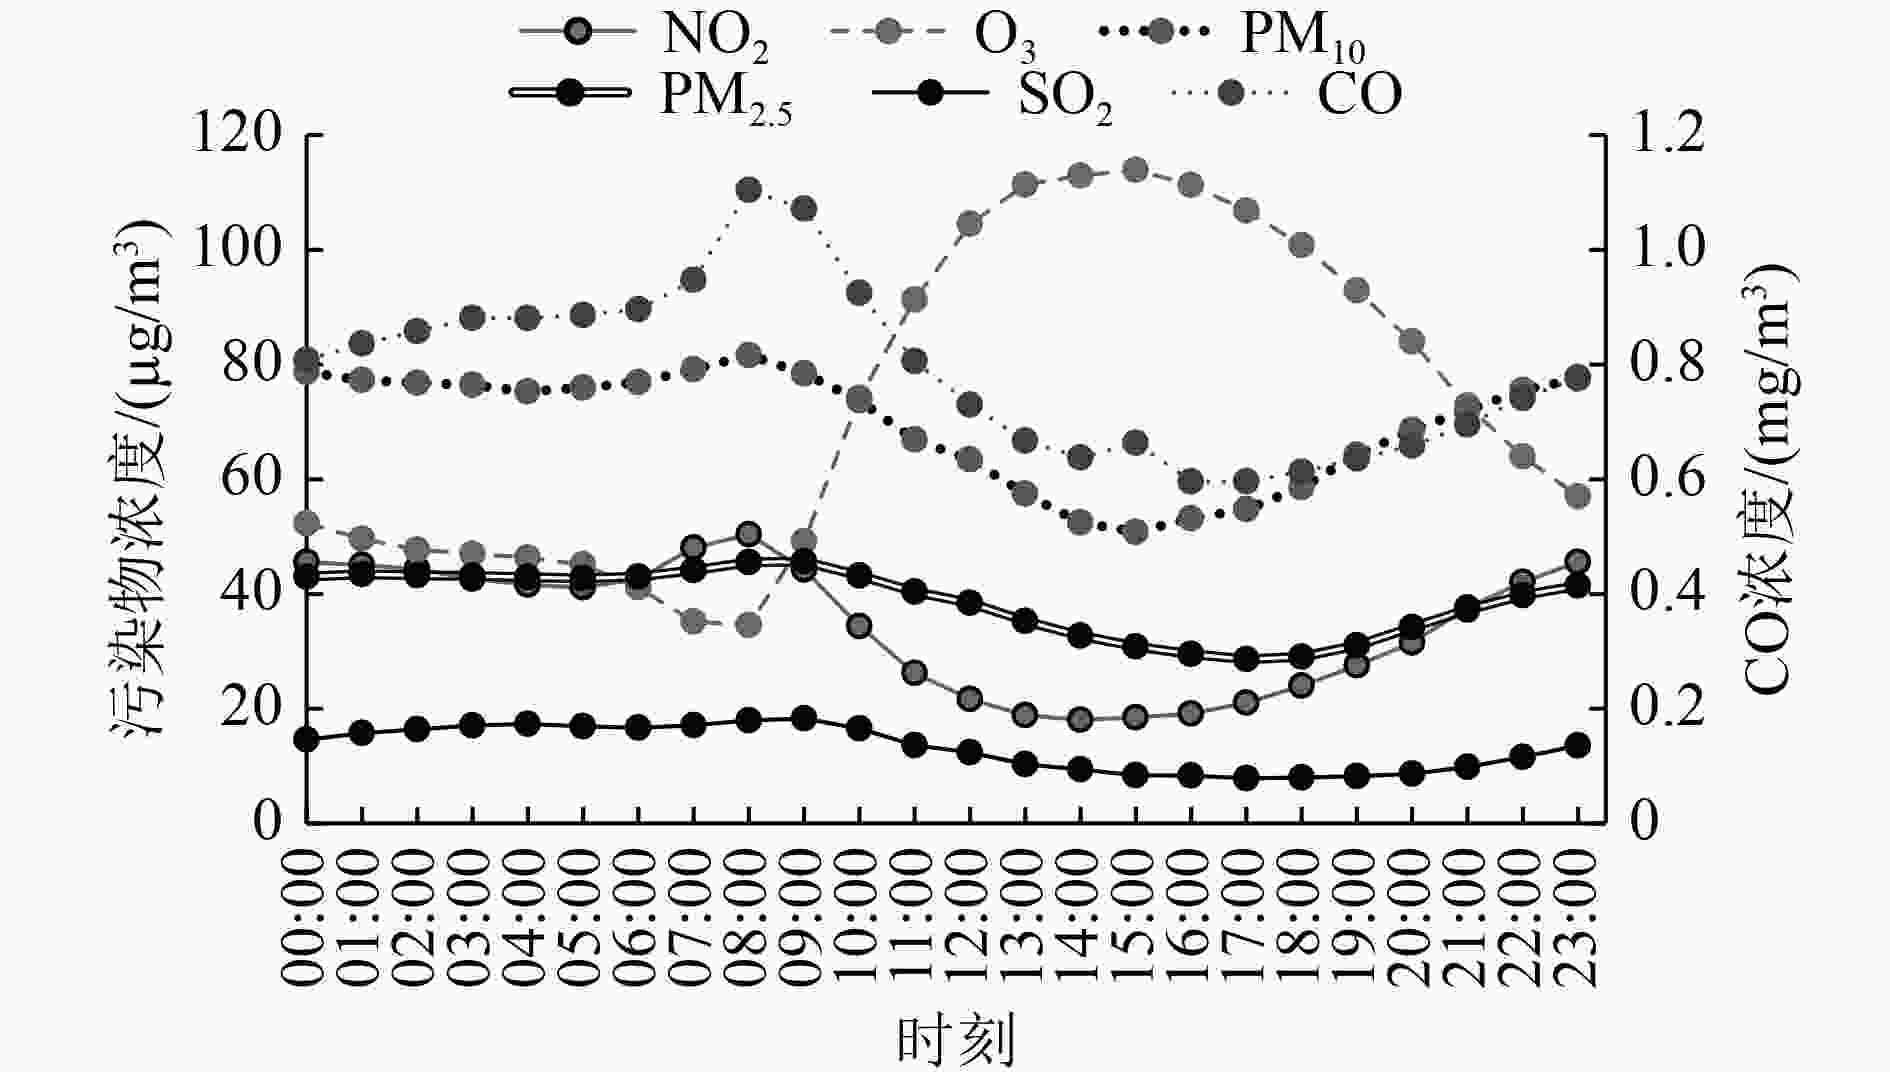
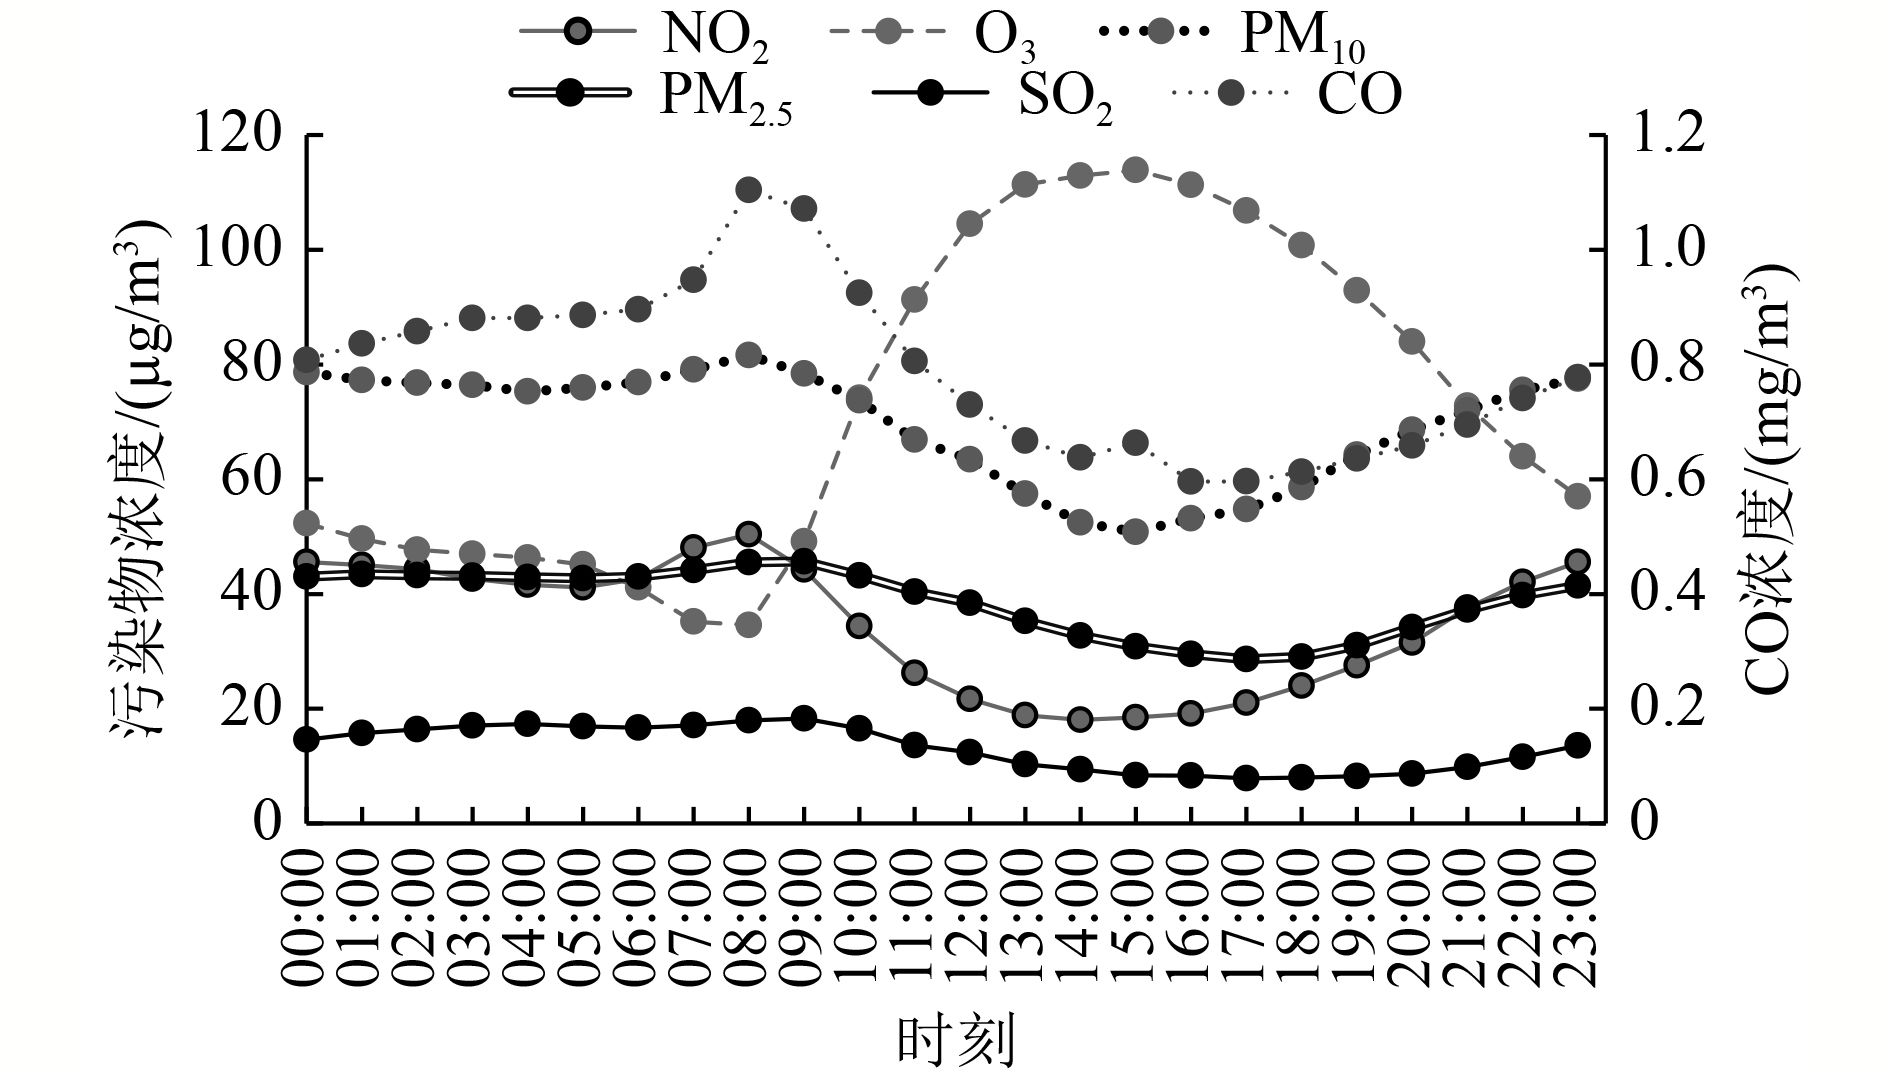
图 5 2018—2020年昆明城区大气污染物浓度日变化
Figure 5. Diurnal variations of atmospheric pollutants concentration in urban area of Kunming from 2018 to 2020

图 6 昆明城区大气污染物浓度空间分布
Figure 6. Spatial distribution of atmospheric pollutants concentration in urban area of Kunming

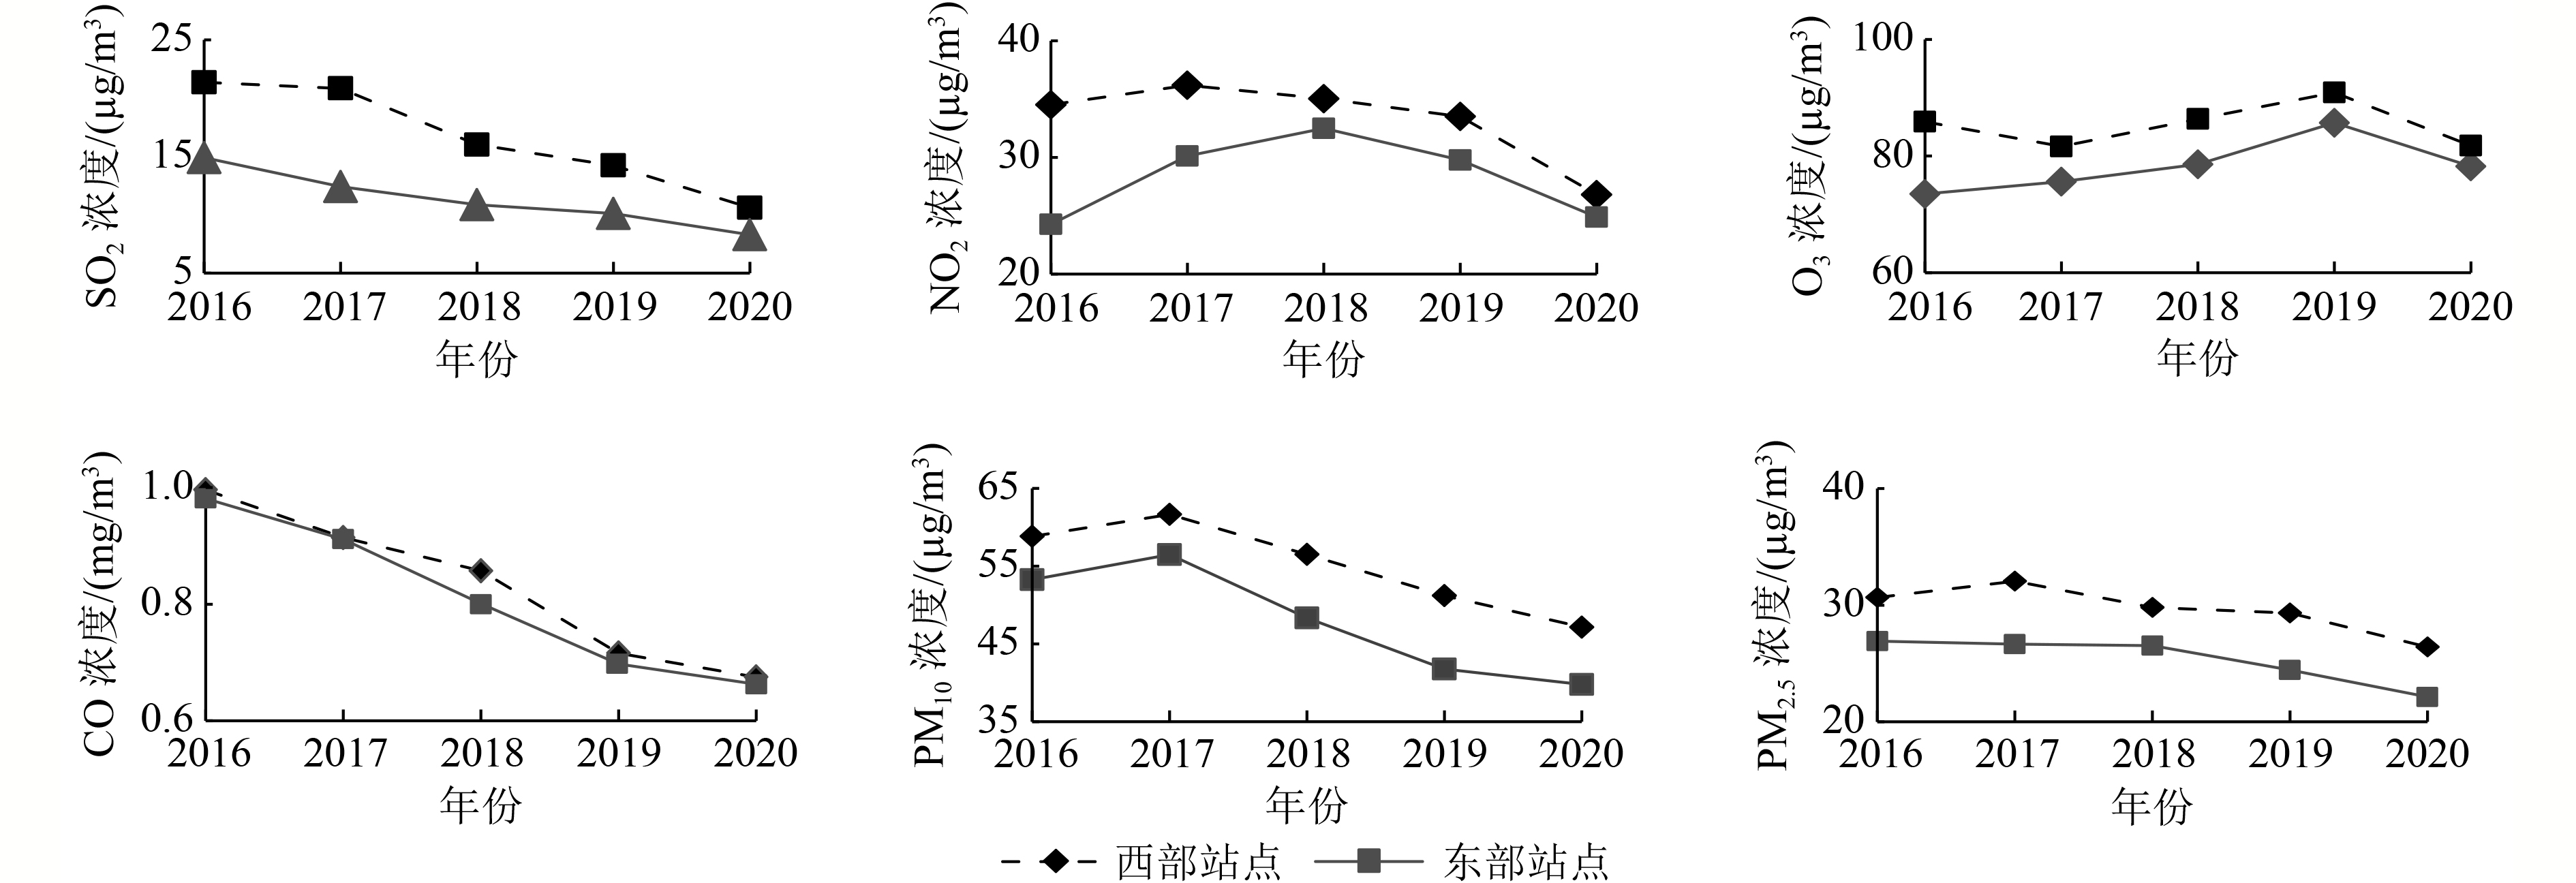
图 7 2016—2020年昆明城区东部、西部站点大气污染物浓度变化比较
Figure 7. Comparison of atmospheric pollutants concentration changes between eastern and western stations in urban area of Kunming from 2016 to 2020
表 1 气象参数的季节排序
Table 1. Seasonal ordering of the values of meteorological parameters
气象参数 排序/降水量分布 月均相对湿度 夏季≈秋季>冬季>春季 月均日照时间 春季>秋季>夏季≈冬季 辐射月均值 春季>夏季>冬季>秋季 月均风速 春季>冬季>夏季≈秋季 月均温度 夏季>春季>秋季>冬季 降水量 集中在5—8月,约占全年降水量的85%  下载: 导出CSV
-
[1] 徐锟, 刘志红, 何沐全, 等.成都市夏季近地面臭氧污染气象特征[J]. 中国环境监测,2018,34(5):36-45.XU K, LIU Z H, HE M Q, et al. Meteorological characteristics of O3 pollution near the ground in summer of Chengdu[J]. Environmental Monitoring in China,2018,34(5):36-45. [2] 赵熠琳, 原彩红, 刘峥, 等.我国典型南方城市臭氧污染特征[J]. 中国环境监测,2017,33(4):194-200.ZHAO Y L, YUAN C H, LIU Z, et al. Analysis on the characteristics of ozone pollution in typical cities of Southern China[J]. Environmental Monitoring in China,2017,33(4):194-200. [3] 林燕芬, 王茜, 伏晴艳, 等.上海市臭氧污染时空分布及影响因素[J]. 中国环境监测,2017,33(4):60-67.LIN Y F, WANG Q, FU Q Y, et al. Temporal-spatial characteristics and impact factors of ozone pollution in Shanghai[J]. Environmental Monitoring in China,2017,33(4):60-67. [4] 张春辉, 刘群, 徐徐, 等.贵阳市臭氧浓度变化及与气象因子的关联性[J]. 中国环境监测,2019,35(3):82-92.ZHANG C H, LIU Q, XU X, et al. The correlation between the characteristics of ozone concentration and meteorological factors in Guiyang[J]. Environmental Monitoring in China,2019,35(3):82-92. [5] 张智胜, 陶俊, 谢绍东, 等.成都城区PM2.5季节污染特征及来源解析[J]. 环境科学学报,2013,33(11):2947-2952.ZHANG Z S, TAO J, XIE S D, et al. Seasonal variations and source apportionment of PM2.5 at urban area of Chengdu[J]. Acta Scientiae Circumstantiae,2013,33(11):2947-2952. [6] 张殷俊, 陈曦, 谢高地, 等.中国细颗粒物(PM2.5)污染状况和空间分布[J]. 资源科学,2015,37(7):1339-1346.ZHANG Y J, CHEN X, XIE G D, et al. Pollution status and spatial distribution of PM2.5 in China[J]. Resources Science,2015,37(7):1339-1346. [7] 谢运兴, 唐晓, 郭宇宏, 等.新疆大气颗粒物的时空分布特征[J]. 中国环境监测,2019,35(1):26-36.XIE Y X, TANG X, GUO Y H, et al. Spatial and temporal distribution of atmospheric particulate matter in Xinjiang[J]. Environmental Monitoring in China,2019,35(1):26-36. [8] 李名升, 任晓霞, 于洋, 等.中国大陆城市PM2.5污染时空分布规律[J]. 中国环境科学,2016,36(3):641-650. doi: 10.3969/j.issn.1000-6923.2016.03.001LI M S, REN X X, YU Y, et al. Spatiotemporal pattern of ground-level fine particulate matter (PM2.5) pollution in mainland China[J]. China Environmental Science,2016,36(3):641-650. doi: 10.3969/j.issn.1000-6923.2016.03.001 [9] 王化杰, 张波, 胡昊, 等.安徽省大气污染物时空分布特征及演化规律[J]. 环境科学研究,2018,31(4):628-641.WANG H J, ZHANG B, HU H, et al. Evolution characteristics and spatial-temporal pattern of air pollutants in Anhui Province[J]. Research of Environmental Sciences,2018,31(4):628-641. [10] 黄晓虎, 韩秀秀, 李帅东, 等.城市主要大气污染物时空分布特征及其相关性[J]. 环境科学研究,2017,30(7):1001-1011.HUANG X H, HAN X X, LI S D, et al. Spatial and temporal variations and relationships of major air pollutants in Chinese cities[J]. Research of Environmental Sciences,2017,30(7):1001-1011. [11] 符传博, 周航.中国城市臭氧的形成机理及污染影响因素研究进展[J]. 中国环境监测,2021,37(2):33-43.FU C B, ZHOU H. Research progress on the formation mechanism and impact factors of urban ozone pollution in China[J]. Environmental Monitoring in China,2021,37(2):33-43. [12] 程麟钧. 我国臭氧污染特征及分区管理方法研究[D]. 北京: 中国地质大学(北京), 2018. [13] BEDDOWS A V, KITWIROON N, WILLIAMS M L, et al. Emulation and sensitivity analysis of the community multiscale air quality model for a UK ozone pollution episode[J]. Environmental Science & Technology,2017,51(11):6229-6236. [14] 张朝能, 王梦华, 胡振丹, 等.昆明市PM2.5浓度时空变化特征及其与气象条件的关系[J]. 云南大学学报(自然科学版),2016,38(1):90-98.ZHANG C N, WANG M H, HU Z D, et al. Temporal and spatial distribution of PM2.5 concentration and the correlation of PM2.5 and meteorological factors in Kunming City[J]. Journal of Yunnan University (Natural Sciences Edition),2016,38(1):90-98. [15] 陈燕. 昆明城市主要空气污染物污染特征及时空分布[J]. 云南环境科学, 2005, 24(增刊2): 102-105CHEN Y. Pollution characteristics and spatial distribution of air pollutants in Kunming City[J]. Yunnan Environmental Science, 2005, 24(Suppl 2): 102-105 [16] 施择, 毕丽玫, 史建武, 等.昆明多风季节大气PM2.5污染特征及来源分析[J]. 环境科学与技术,2014,37(12):143-147.SHI Z, BI L M, SHI J W, et al. Characterization and source identification of PM2.5 in ambient air of Kunming in windy spring[J]. Environmental Science & Technology,2014,37(12):143-147. [17] ZHAO W, FAN S J, GUO H, et al. Assessing the impact of local meteorological variables on surface ozone in Hong Kong during 2000-2015 using quantile and multiple line regression models[J]. Atmospheric Environment,2016,144:182-193. doi: 10.1016/j.atmosenv.2016.08.077 [18] 单瑞娟, 吴琳, 杨宁.北京市怀柔区大气污染物浓度变化规律及与其他要素的相关性[J]. 环境工程技术学报,2021,11(4):647-656. doi: 10.12153/j.issn.1674-991X.20200205SHAN R J, WU L, YANG N. The variation law of air pollutant concentrations and their correlations with other factors in Huairou District, Beijing City[J]. Journal of Environmental Engineering Technology,2021,11(4):647-656. doi: 10.12153/j.issn.1674-991X.20200205 [19] 郭丽辉.昆明市2016—2018年臭氧浓度变化特征[J]. 环境科学导刊,2019,38(5):55-60.GUO L H. The variation characteristics of ozone concentration in Kunming from 2016 to 2018[J]. Environmental Science Survey,2019,38(5):55-60. □ -

 下载:
下载:


 点击查看大图
计量
- 文章访问数: 391
- HTML全文浏览量: 221
- PDF下载量: 74
- 被引次数: 0