

Application of improved WQI model in water quality assessment of typical watershed in the hilly area of central Sichuan Province: a case study in the upper reaches of Qiongjiang River Basin
-
摘要: 水质指数(WQI)克服了传统水质评价方法无法同时满足定性评价与定量评价的缺点,但其所需指标较多,无法做到广泛运用。以琼江流域上游段为川中丘陵地区典型流域的代表,对其2018—2019年水质监测数据进行多元线性逐步回归分析,从25个水质指标中筛选出氨氮(NH3-N)、化学需氧量(CODCr)、生化需氧量(BOD5)、溶解氧(DO)4个指标建立改进WQI (WQImin)模型,该模型评价结果与WQI高度相关,并且具有较好的预测性能(R2=0.81,PE=11.9%)。WQImin评价结果表明:琼江流域上游段WQImin均值为63.1±17.2,水质等级为好;干流WQImin整体上呈沿程升高的趋势,流经安居区时,WQImin明显降低,但能较快恢复至入城区前的水平;WQImin由高至低依次为琼江干流>会龙河>玉丰河>蟠龙河>石洞河,主要支流水质均劣于干流,建议区域水污染治理的重点应逐步放到支流上。Abstract: Water quality index (WQI) overcomes the shortcomings of traditional water quality evaluation methods that cannot satisfy both qualitative and quantitative evaluation. However, WQI requires so many evaluation indexes that it cannot be widely used. Taking the upper reaches of Qiongjiang River Basin as the representative of the typical basin in the hilly area of central Sichuan Province, the monitoring data of water quality from 2018 to 2019 were analyzed through the multiple linear stepwise regression method. One improved model, the minimum water quality index (WQImin) model, was established by choosing NH3-N, CODCr, BOD5 and DO from 25 water quality indexes. WQImin model had better predictive performance, and its evaluation results were significantly correlated with WQI (R2=0.81, PE=11.9%). According to the results of WQImin model, the average WQImin value in the upper reaches of Qiongjiang River Basin were 63.1±17.2, and the water quality grade was "good". On the whole, the WQImin value of the mainstream increased along the flow direction. When it flowed through Anju District, WQImin decreased significantly, but it could return to its pre-affected level before entering the city quickly. The WQImin values from high to low were as follows: Qiongjiang River mainstream > Huilong River > Yufeng River > Panlong River > Shidong river, and the water quality in tributaries was worse than that of main streams. Therefore, the priority of water pollution control in this area should be gradually put on the tributaries.
-

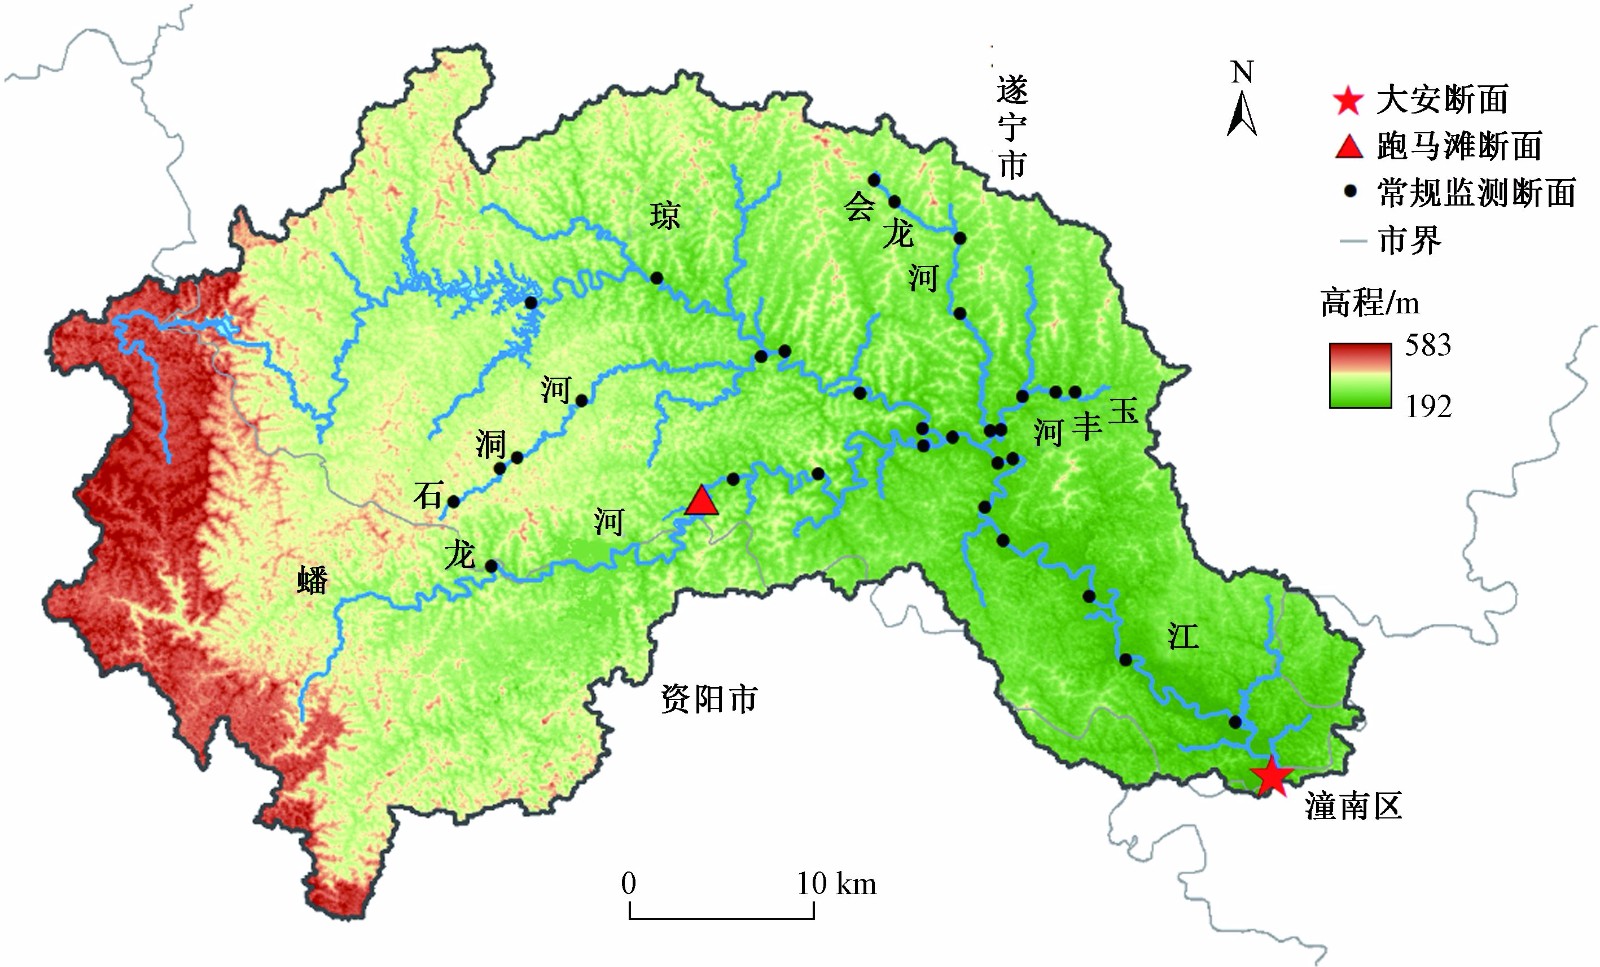
图 1 琼江流域上游段水系及监测断面分布
Figure 1. Distribution of water system and monitoring sections in the upper reaches of Qiongjiang River Basin
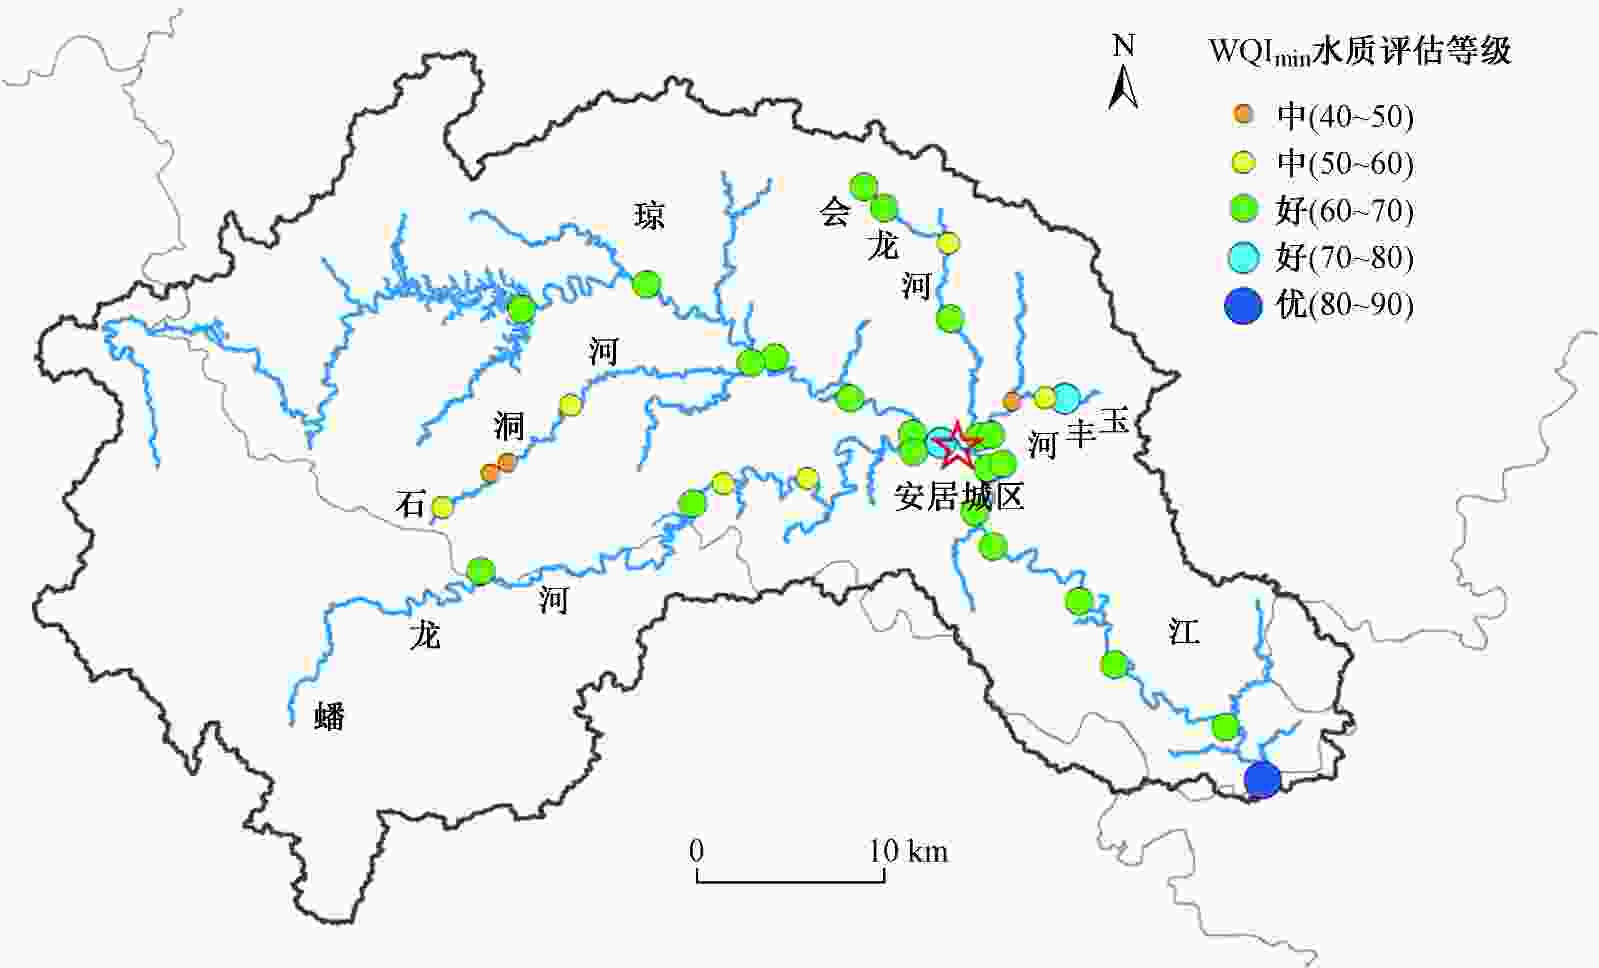
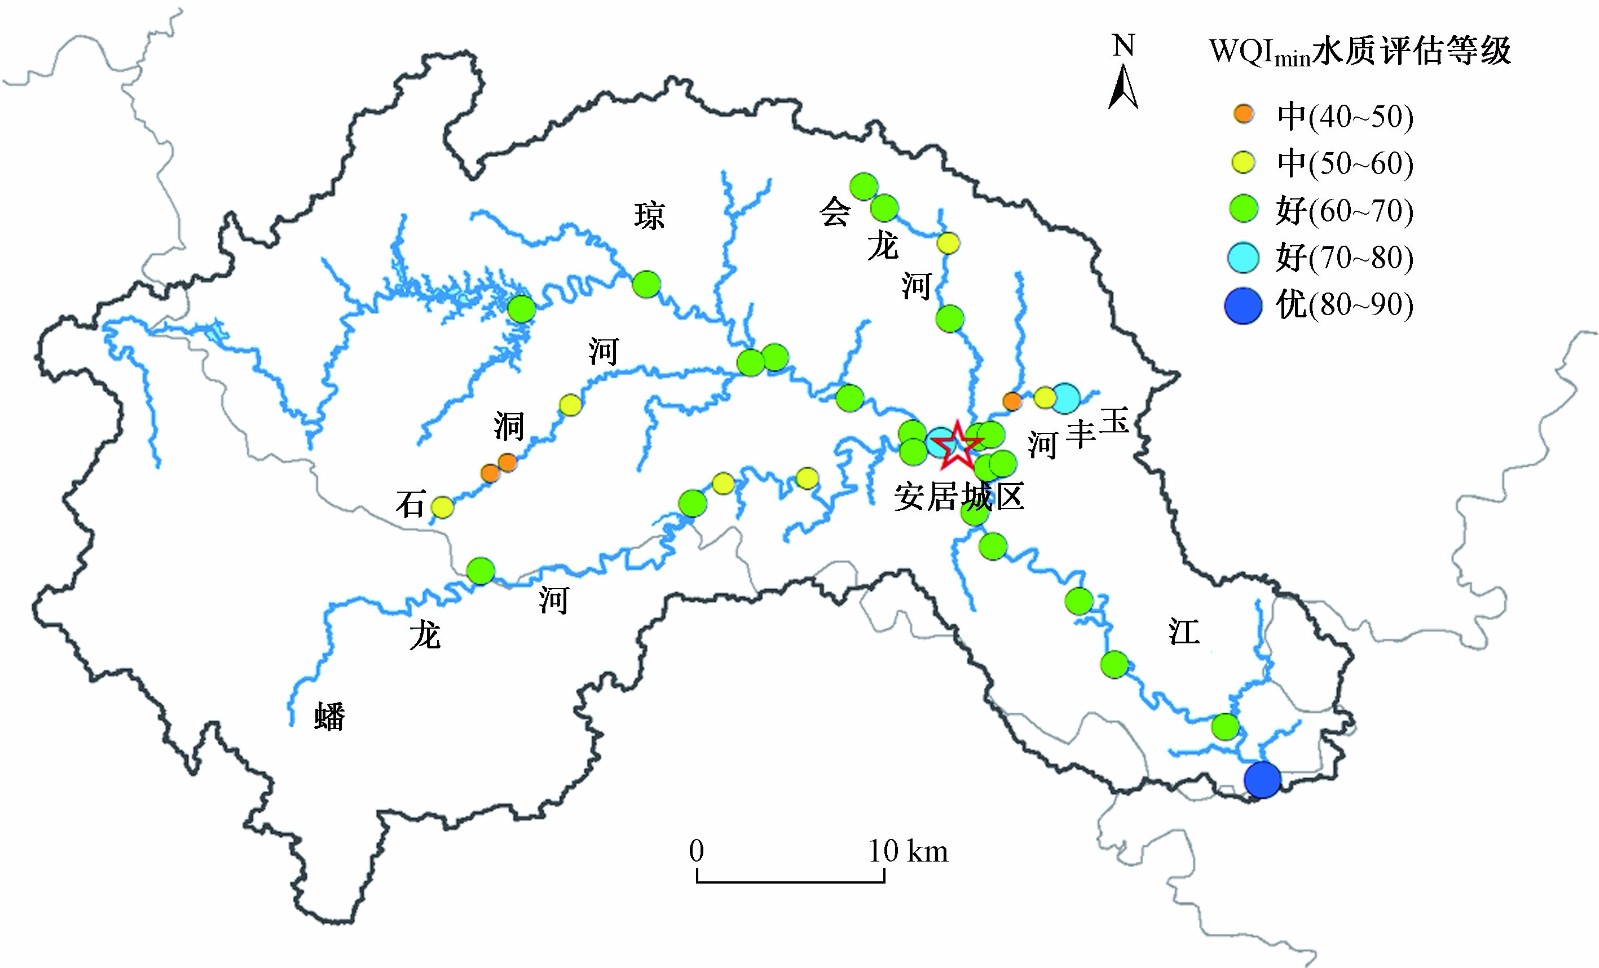
图 2 琼江流域上游段WQImin的空间分布
Figure 2. Spatial distribution of WQImin values in the upper reaches of Qiongjiang River Basin
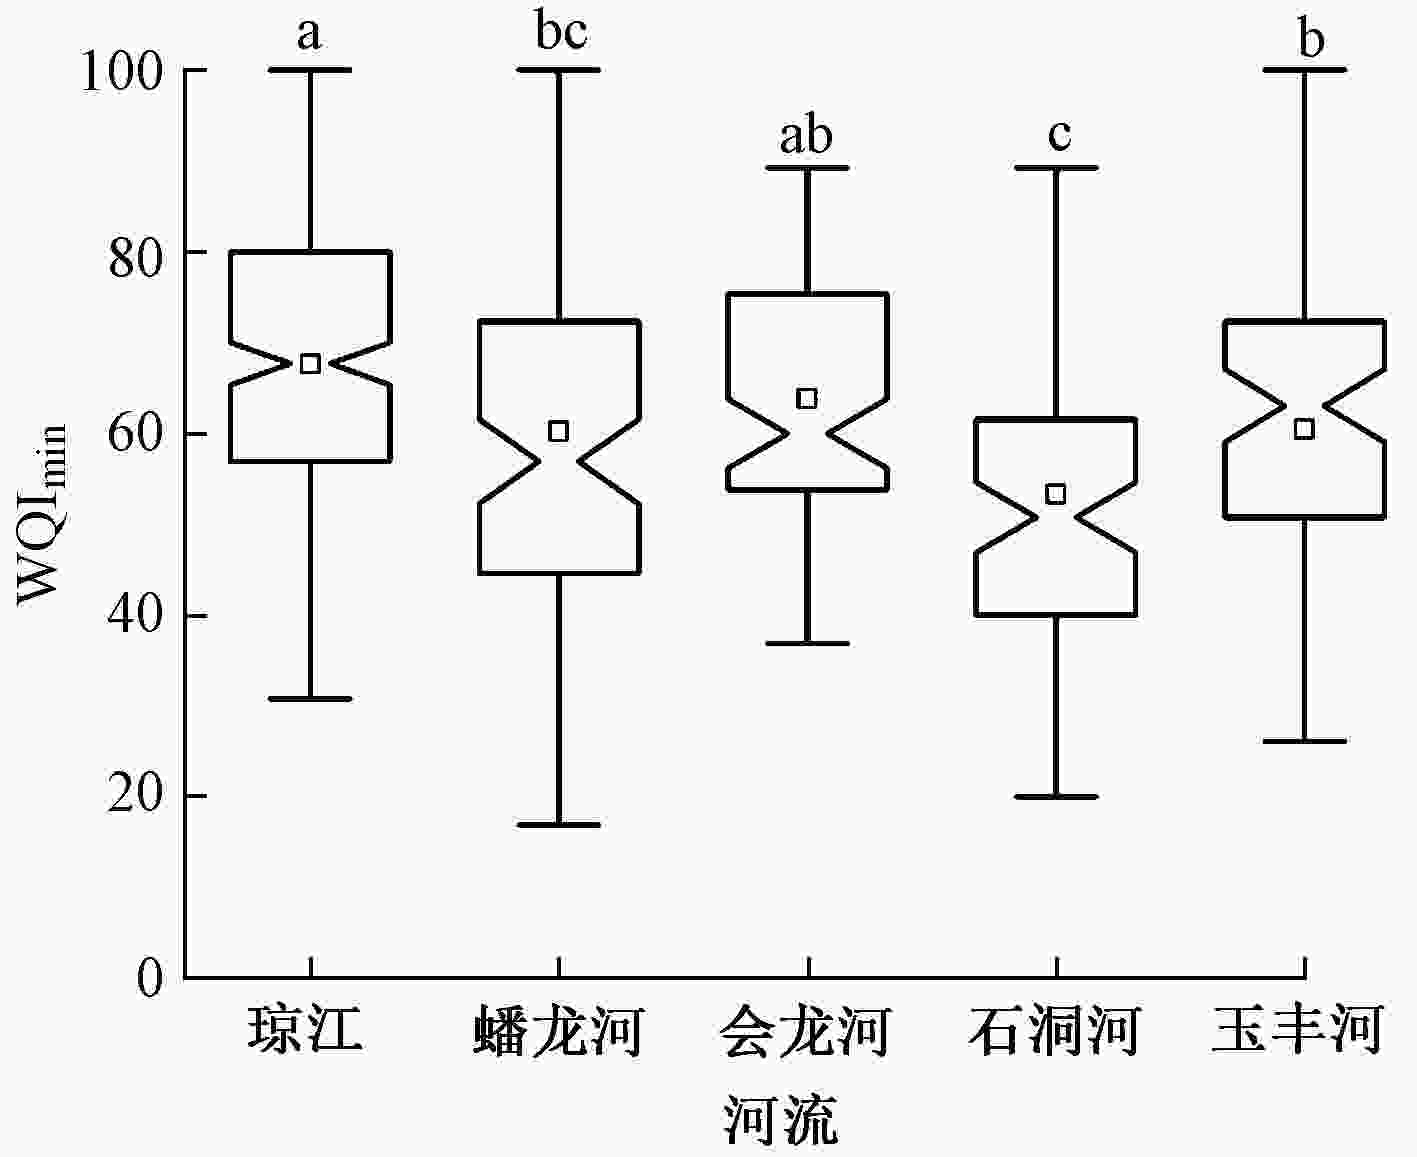
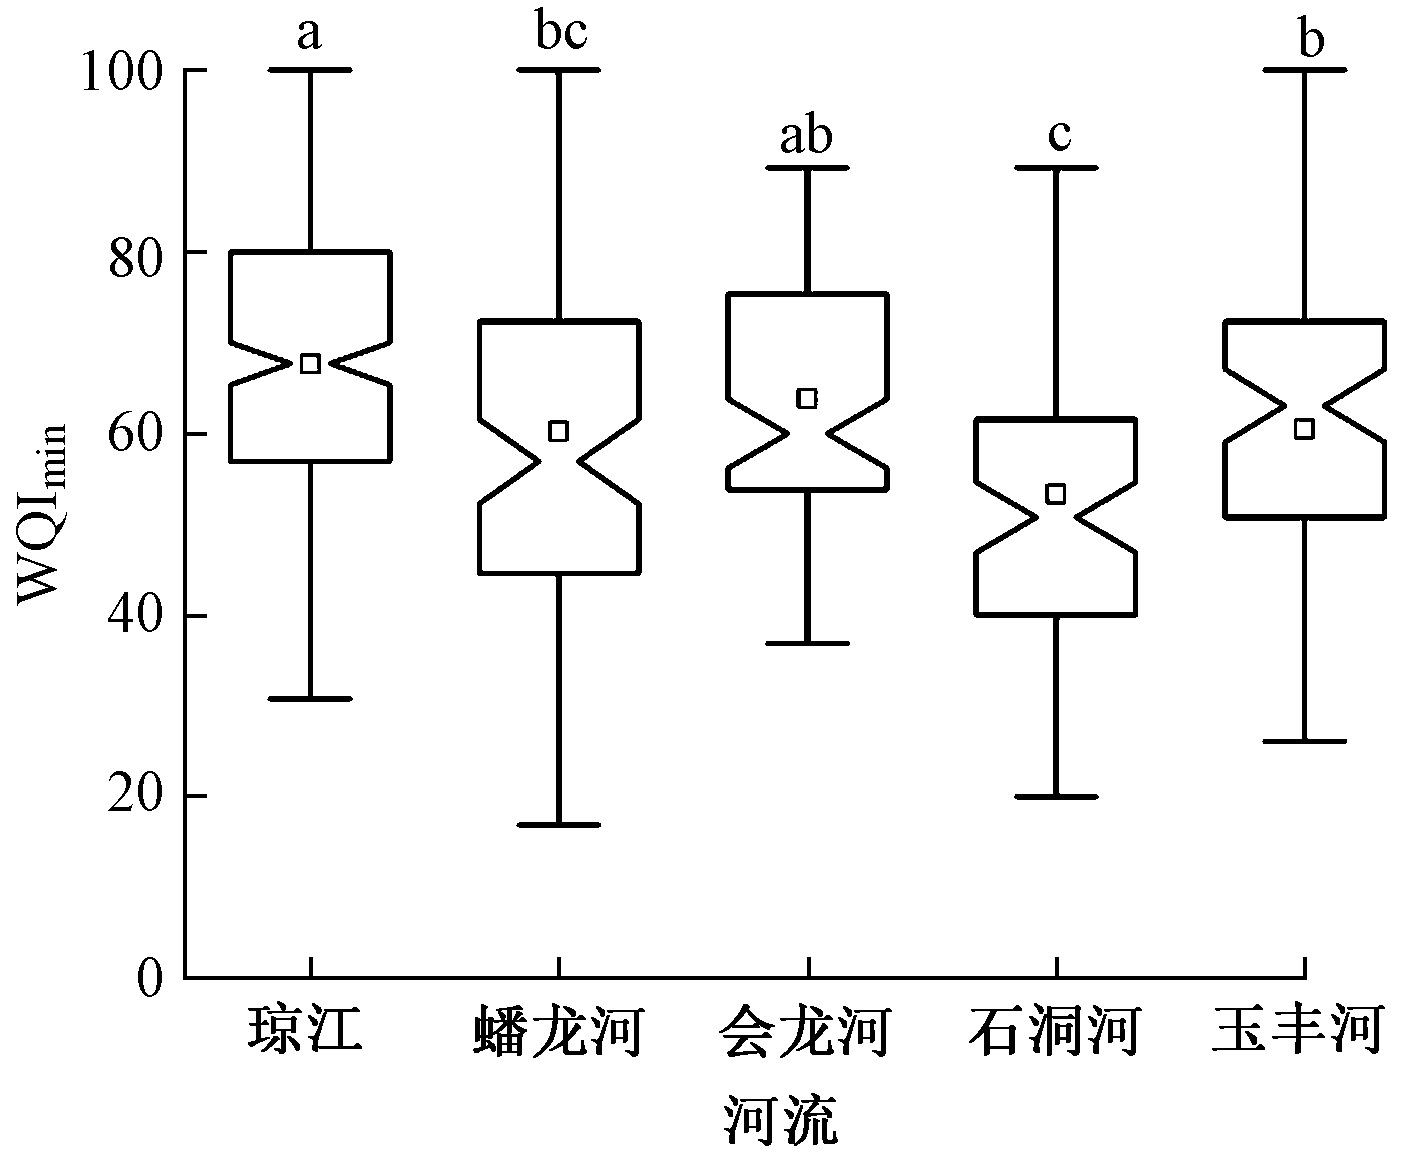
图 3 干流与4条支流WQImin的空间分布差异性
注:字母不同表示存在显著差异(P<0.05)。
Figure 3. Distribution difference of WQImin values between mainstream and four tributaries
表 1 水质监测断面详细信息
Table 1. Details of water quality monitoring sections
涉及断面 数据年份 水质指标 数据来源 大安省控断面、
跑马滩国控断面2018-01—2019-12 T、pH、DO、CODMn、五日生化需氧量(BOD5)、NH3-N、CODCr、挥发酚、氰化物、砷、汞、六价铬、铅、镉、石油类、TP、总氮(TN)、铜、锌、氟化物、硒、阴离子表面活性剂、硫化物、粪大肠菌群数、电导率共25项 遂宁市生态环境局 31个常规监测断面 2018-03—2019-10 DO、CODMn、BOD5、NH3-N、CODCr、TP共6项 遂宁市安居生态环境局  下载: 导出CSV
表 2 水质指标的归一化值和权重
Table 2. Normalized values and weights of water quality parameters
水质指标 权重(Pi)[2,8,10] 归一化值(Ci) 100 80 60 40 20 T/℃ 1 15~22 12~15, 22~26 5~12, 26~30 −2~5, 30~36 −6~−2, 36~45 pH 1 7~8 8~9 6~7, 9.0~9.5 4~6, 9.5~11 2~4, 11~12 DO/(mg/L) 4 7.5 6 5 3 2 CODMn/(mg/L) 3 2 4 8 12 15 BOD5/(mg/L) 3 3 3 4 6 10 NH3-N/(mg/L) 3 0.15 0.5 1 1.5 2 CODCr/(mg/L) 3 15 15 20 30 40 挥发酚/(µg/L) 3 2 2 5 10 100 氰化物/(µg/L) 4 5 5 200 200 20 砷/(µg/L) 4 50 50 50 100 100 汞/(µg/L) 4 0.05 0.05 0.1 1 1 六价铬/(µg/L) 4 10 50 200 200 200 铅/(µg/L) 4 10 10 50 50 100 镉/(µg/L) 4 1 5 5 5 10 石油类/(µg/L) 2 50 50 50 500 1 000 TP/(mg/L) 4 0.02 0.1 0.2 0.3 0.4 铜/(µg/L) 2 10 1 000 1 000 1 000 1 000 锌/(µg/L) 2 50 1 000 1 000 2 000 2 000 氟化物/(mg/L) 2 1 1 1 1.5 1.5 硒/(µg/L) 4 10 10 10 20 20 阴离子表面活性剂/(mg/L) 4 0.2 0.2 0.2 0.3 0.3 硫化物/(µg/L) 2 50 100 200 500 1 000 粪大肠菌群数/(个/L) 3 200 2 000 10 000 20 000 40 000 电导率/(mS/m) 1 1 000 1 500 2 500 5 000 12 000
下载: 导出CSV
表 3 大安与跑马滩断面水质指标平均值和标准差
Table 3. Average values and standard deviations of water quality indexes at sections of Da'an and Paomatan
水质指标 平均值±方差 H P 大安断面 跑马滩断面 T/℃ 20.3±7.31 21.27±7.52 0.283 0.595 pH 8.14±0.33 7.98±0.50 1.432 0.232 DO/(mg/L) 9.28±3.46 8.41±4.91 0.409 0.523 CODMn/(mg/L) 5.09±0.67 5.25±0.86 0.052 0.820 BOD5/(mg/L) 2.31±1.14 2.86±1.04 4.393 0.036 NH3-N/(mg/L) 0.28±0.15 0.31±0.47 8.401 0.004 CODCr/(mg/L) 17.96±2.97 20.83±3.60 7.659 0.006 挥发酚/(μg/L) 0.32±0.10 0.29±0.17 5.906 0.015 氰化物/(μg/L) 4.00±0.00 3.33±0.96 9.400 0.002 砷/(μg/L) 1.34±0.63 1.34±0.89 0.522 0.470 汞/(μg/L) 0.04±0.00 0.03±0.01 9.400 0.002 六价铬/(μg/L) 4.00±0.00 3.33±0.96 9.400 0.002 铅/(μg/L) 1.92±0.28 1.50±0.65 7.172 0.007 镉/(μg/L) 0.10±0.00 0.08±0.03 9.340 0.002 石油类/(μg/L) 12.5±6.76 12.08±6.24 0.204 0.652 TP/(mg/L) 0.13±0.04 0.12±0.14 8.078 0.004 铜/(μg/L) 1.00±0.00 1.04±0.64 2.335 0.126 锌/(mg/L) 0.05±0.01 0.04±0.02 7.484 0.006 氟化物/(mg/L) 0.36±0.08 0.39±0.07 3.145 0.076 硒/(μg/L) 0.40±0.02 0.34±0.10 7.207 0.007 阴离子表面活性剂/(mg/L) 0.06±0.01 0.05±0.02 1.082 0.298 硫化物/(μg/L) 5.00±0.00 4.15±1.24 9.366 0.002 粪大肠菌群数/(个/L) 2 638±1 510 1 228±810 18.312 0.000 电导率/(mS/m) 497.63±97.64 402.33±51.74 15.171 0.000
下载: 导出CSV
表 4 WQI与水质指标的多元线性逐步回归分析
Table 4. Multiple linear stepwise regression analysis of WQI and water quality
$\mathrm{lg}\left(\mathrm{W}\mathrm{Q}\mathrm{I}+1\right)$ R2 F P ${1.838}^{***}+{0.067}^{***}\mathrm{l}\mathrm{g}\;{C}_{ {\mathrm{N}\mathrm{H} }_{3}-\mathrm{N} }$ 0.59 53.19 <0.001 ${1.777}^{***}+{0.066}^{***}\mathrm{l}\mathrm{g}\;{C}_{ {\mathrm{N}\mathrm{H} }_{3}-\mathrm{N} }+ {0.036}^{***}\mathrm{l}\mathrm{g}\; {C}_{ {\mathrm{C}\mathrm{O}\mathrm{D} } _ {\rm{Cr} } }$ 0.70 44.25 <0.001 ${1.751}^{***}+{0.065}^{***}\mathrm{l}\mathrm{g}\;{C}_{ {\mathrm{N}\mathrm{H} }_{3}-\mathrm{N} }+{0.028}^{**}\mathrm{l}\mathrm{g}\;{C}_{ {\mathrm{C}\mathrm{O}\mathrm{D} } _{ {\rm{Cr} } } }+{0.022}^{**}\mathrm{l}\mathrm{g}\;{C}_{\mathrm{B}\mathrm{O}\mathrm{D_{5} } }$ 0.75 38.98 <0.001 ${1.758}^{***}+{0.050}^{***}\mathrm{l}\mathrm{g}\;{C}_{ {\mathrm{N}\mathrm{H} }_{3}-\mathrm{N} }+{0.024}^{**}\mathrm{l}\mathrm{g}\;{C}_{ {\mathrm{C}\mathrm{O}\mathrm{D} }_{{\rm{Cr}}} }+{0.029}^{***}\mathrm{l}\mathrm{g}\;{C}_{\mathrm{B}\mathrm{O}\mathrm{D_{5} } }+{0.008}^{**}\mathrm{l}\mathrm{g}\;{C}_{\mathrm{D}\mathrm{O} }$ 0.81 39.96 <0.001 ${1.668}^{***}+{0.049}^{***}\mathrm{l}\mathrm{g}\;{C}_{ {\mathrm{N}\mathrm{H} }_{3}-\mathrm{N} }+{0.025}^{**}\mathrm{l}\mathrm{g}\;{C}_{\mathrm{C}\mathrm{O}\mathrm{D_{{\rm{Cr}}}} }+{0.033}^{***}\mathrm{l}\mathrm{g}\;{C}_{\mathrm{B}\mathrm{O}\mathrm{D_{5} } }+{0.010}^{***}\mathrm{l}\mathrm{g}\;{C}_{\mathrm{D}\mathrm{O} }+{0.043}^{**}\mathrm{l}\mathrm{g}\;{C}_{\mathrm{F}.\mathrm{c}\mathrm{o}\mathrm{l}\mathrm{i} }$ 0.85 43.59 <0.001 注:*表示模型中各自变量指标对因变量lg(WQI+1)的显著性,**表示P<0.01,***表示P<0.001;CF.coli表示粪大肠菌群数。
下载: 导出CSV
表 5 WQImin模型的参数率定结果
Table 5. Parameter calibration results of the WQImin model
模型 包含指标 R2 P PE/% WQImin-a NH3-N、CODCr、BOD5 0.47 <0.001 23.2 WQImin-b NH3-N、CODCr、BOD5、DO 0.92 <0.001 17.4 WQImin-c NH3-N、CODCr、BOD5、粪大肠菌群数 0.52 <0.001 30.7 WQImin-d NH3-N、CODCr、BOD5、DO、粪大肠菌群数 0.93 <0.001 18.9
下载: 导出CSV
表 6 WQImin模型的参数验证结果
Table 6. Verification results of the WQImin model
模型 包含指标 R2 P PE/% WQImin-b NH3-N、CODCr、BOD5、DO 0.78 0.012 11.9 WQImin-d NH3-N、CODCr、BOD5、DO、
粪大肠菌群数0.82 0.008 17.9
下载: 导出CSV
-
[1] 国家环境保护总局. 地表水环境质量标准: GB 3838—2002[S]. 北京: 中国环境科学出版社, 2002. [2] PESCE S F, WUNDERLIN D A. Use of water quality indices to verify the impact of Córdoba City (Argentina) on Suquı́a River[J]. Water Research,2000,34(11):2915-2926. doi: 10.1016/S0043-1354(00)00036-1 [3] WU Z S, WANG X L, CHEN Y W, et al. Assessing river water quality using water quality index in Lake Taihu Basin, China[J]. Science of the Total Environment,2018,612:914-922. doi: 10.1016/j.scitotenv.2017.08.293 [4] SUN W, XIA C Y, XU M Y, et al. Application of modified water quality indices as indicators to assess the spatial and temporal trends of water quality in the Dongjiang River[J]. Ecological Indicators,2016,66:306-312. doi: 10.1016/j.ecolind.2016.01.054 [5] HOU W, SUN S H, WANG M Q, et al. Assessing water quality of five typical reservoirs in lower reaches of Yellow River, China: using a water quality index method[J]. Ecological Indicators,2016,61:309-316. doi: 10.1016/j.ecolind.2015.09.030 [6] HOSEINZADEH E, KHORSANDI H, WEI C A, et al. Evaluation of aydughmush river water quality using the national sanitation foundation water quality index (NSFWQI), river pollution index (RPI), and forestry water quality index (FWQI)[J]. Desalination and Water Treatment,2015,54(11):2994-3002. doi: 10.1080/19443994.2014.913206 [7] AKKOYUNLU A, AKINER M E. Pollution evaluation in streams using water quality indices: a case study from Turkey's Sapanca Lake Basin[J]. Ecological Indicators,2012,18:501-511. doi: 10.1016/j.ecolind.2011.12.018 [8] KANNEL P R, LEE S, LEE Y S, et al. Application of water quality indices and dissolved oxygen as indicators for river water classification and urban impact assessment[J]. Environmental Monitoring and Assessment,2007,132(1/2/3):93-110. [9] WU Z S, LAI X J, LI K Y. Water quality assessment of rivers in Lake Chaohu Basin (China) using water quality index[J]. Ecological Indicators,2021,121:107021. doi: 10.1016/j.ecolind.2020.107021 [10] NONG X Z, SHAO D G, ZHONG H, et al. Evaluation of water quality in the South-to-North Water Diversion Project of China using the water quality index (WQI) method[J]. Water Research,2020,178:115781. doi: 10.1016/j.watres.2020.115781 [11] ZHAO P, TANG X Y, TANG J L, et al. Assessing water quality of Three Gorges Reservoir, China, over a five-year period from 2006 to 2011[J]. Water Resources Management,2013,27(13):4545-4558. doi: 10.1007/s11269-013-0425-x [12] AVIGLIANO E, SCHENONE N. Water quality in Atlantic rainforest mountain rivers (South America): quality indices assessment, nutrients distribution, and consumption effect[J]. Environmental Science and Pollution Research,2016,23(15):15063-15075. doi: 10.1007/s11356-016-6646-9 [13] 刘臣炜, 陈梅, 苏良湖. 琼江上游流域水质改善方案研究[C]//2018中国环境科学学会科学技术年会论文集(第二卷). 北京: 中国环境科学学会, 2018: 635-640. [14] 纪丁愈. 川中丘陵区饮用水源地农村面源污染特征分析[D]. 成都: 西南交通大学, 2011. [15] 四川省生态环境厅. 2018年四川省生态环境状况公报[A/OL]. (2019-06-05)[2021-04-14]. http://sthjt.sc.gov.cn/. [16] 四川省生态环境厅. 2017年四川省生态环境状况公报[A/OL]. (2018-06-04)[2021-04-14]. http://sthjt.sc.gov.cn/. [17] 尹真真, 赵丽, 彭昱, 等.三峡库区重庆段总磷污染来源解析及控制对策[J]. 环境工程技术学报,2018,8(1):51-57.YIN Z Z, ZHAO L, PENG Y, et al. Pollution source apportionment and control countermeasure of total phosphorus in Chongqing segment of the Three Gorges Reservoir Area[J]. Journal of Environmental Engineering Technology,2018,8(1):51-57. [18] 许肖云, 张凯, 杨永安, 等.浅析涪江流域遂宁段氨氮和总氮的相关性[J]. 四川环境,2017,36(1):64-67. doi: 10.3969/j.issn.1001-3644.2017.01.012XU X Y, ZHANG K, YANG Y A, et al. Correlation analysis on ammonia nitrogen and total nitrogen in Suining section of Fujiang River[J]. Sichuan Environment,2017,36(1):64-67. doi: 10.3969/j.issn.1001-3644.2017.01.012 [19] 杨耿, 秦延文, 马迎群, 等.沱江流域磷石膏的磷形态组成及潜在释放特征[J]. 环境工程技术学报,2018,8(6):610-616. doi: 10.3969/j.issn.1674-991X.2018.06.081YANG G, QIN Y W, MA Y Q, et al. Phosphorus forms and potential release characteristics of phosphogypsum in Tuojiang River Basin[J]. Journal of Environmental Engineering Technology,2018,8(6):610-616. doi: 10.3969/j.issn.1674-991X.2018.06.081 [20] 刘凌雪, 敖天其, 胡正, 等.琼江流域(安居段)水质及面源污染综合评价[J]. 水土保持研究,2019,26(6):372-376.LIU L X, AO T Q, HU Z, et al. Comprehensive evaluation of water quality and non-point source pollution in Anju section of Qiongjiang River Basin[J]. Research of Soil and Water Conservation,2019,26(6):372-376. [21] 王朕, 梁川, 赵鹏, 等.川中丘陵区地表干湿长程相关性及影响因素研究[J]. 四川大学学报(工程科学版),2016,48(增刊1):61-68.WANG Z, LIANG C, ZHAO P, et al. Long-range correlation of surface dry/wet condition and its influential factors in hilly area of central Sichuan[J]. Journal of Sichuan University (Engineering Science Edition),2016,48(Suppl 1):61-68. [22] 陈剑科. 川中丘陵区土系划分研究[D]. 雅安: 四川农业大学, 2019. [23] 国家统计局农村社会经济调查司. 中国县域统计年鉴[M]. 北京: 中国统计出版社, 2019. [24] Jr CANFIELD D E, BACHMANN R W. Prediction of total phosphorus concentrations, chlorophyll a, and secchi depths in natural and artificial lakes[J]. Canadian Journal of Fisheries and Aquatic Sciences,1981,38(4):414-423. doi: 10.1139/f81-058 [25] SIMÕES F D S, MOREIRA A B, BISINOTI M C, et al. Water quality index as a simple indicator of aquaculture effects on aquatic bodies[J]. Ecological Indicators,2008,8(5):476-484. doi: 10.1016/j.ecolind.2007.05.002 [26] CHAUDHARY M, MISHRA S, KUMAR A. Estimation of water pollution and probability of health risk due to imbalanced nutrients in River Ganga, India[J]. International Journal of River Basin Management,2017,15(1):53-60. doi: 10.1080/15715124.2016.1205078 [27] NOBLE R T, MOORE D F, LEECASTER M K, et al. Comparison of total coliform, fecal coliform, and Enterococcus bacterial indicator response for ocean recreational water quality testing[J]. Water Research,2003,37(7):1637-1643. doi: 10.1016/S0043-1354(02)00496-7 [28] 徐祖信.我国河流综合水质标识指数评价方法研究[J]. 同济大学学报(自然科学版),2005,33(4):482-488. doi: 10.3321/j.issn:0253-374X.2005.04.012XU Z X. Comprehensive water quality identification index for environmentalquality assessment of surface water[J]. Journal of Tongji University,2005,33(4):482-488. doi: 10.3321/j.issn:0253-374X.2005.04.012 [29] 刘琰, 郑丙辉, 付青, 等.水污染指数法在河流水质评价中的应用研究[J]. 中国环境监测,2013,29(3):49-55. doi: 10.3969/j.issn.1002-6002.2013.03.010LIU Y, ZHENG B H, FU Q, et al. Application of water pollution index in water quality assessment of rivers[J]. Environmental Monitoring in China,2013,29(3):49-55. ◇ doi: 10.3969/j.issn.1002-6002.2013.03.010 -

 下载:
下载:

 点击查看大图
计量
- 文章访问数: 275
- HTML全文浏览量: 415
- PDF下载量: 54
- 被引次数: 0