

Analysis of energy consumption and carbon emissions in Anhui Province based on scenario analysis
-
摘要:
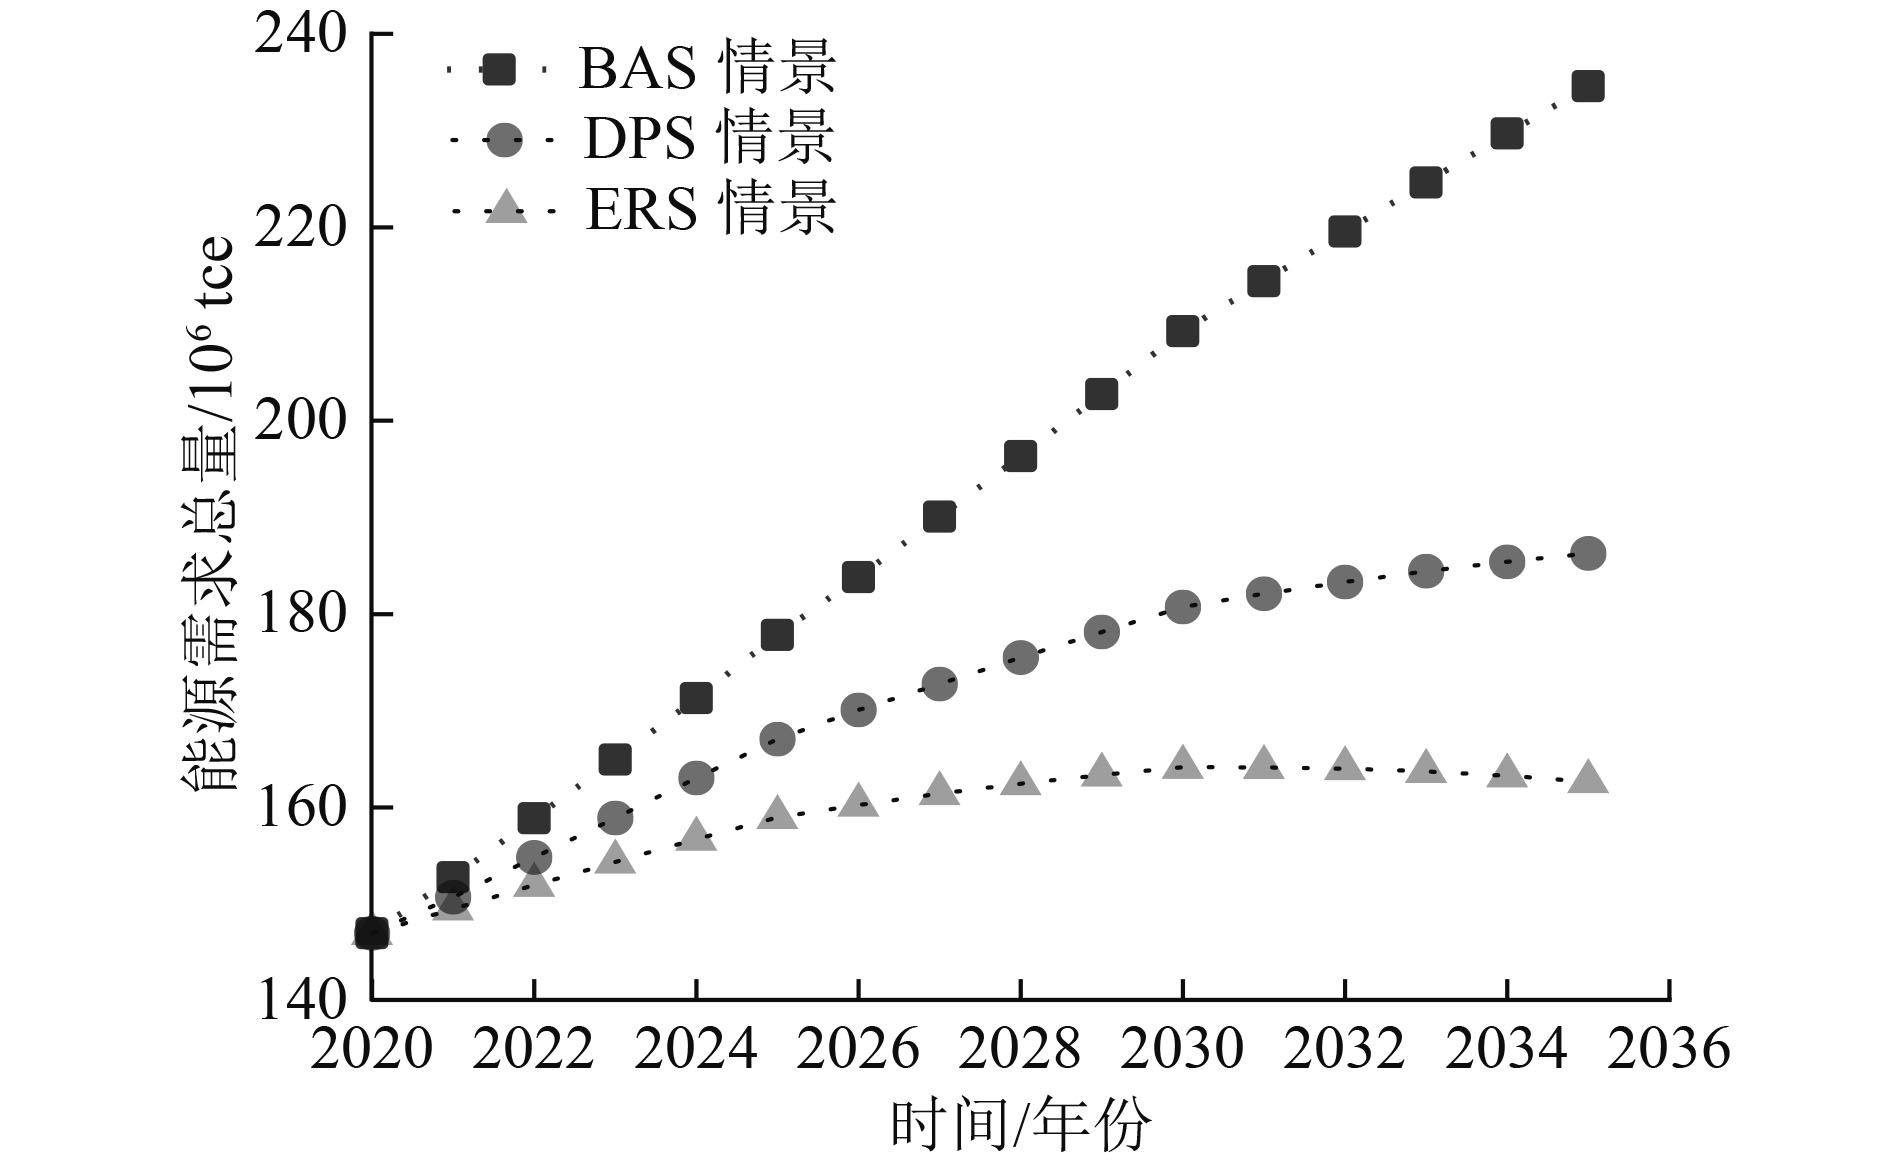
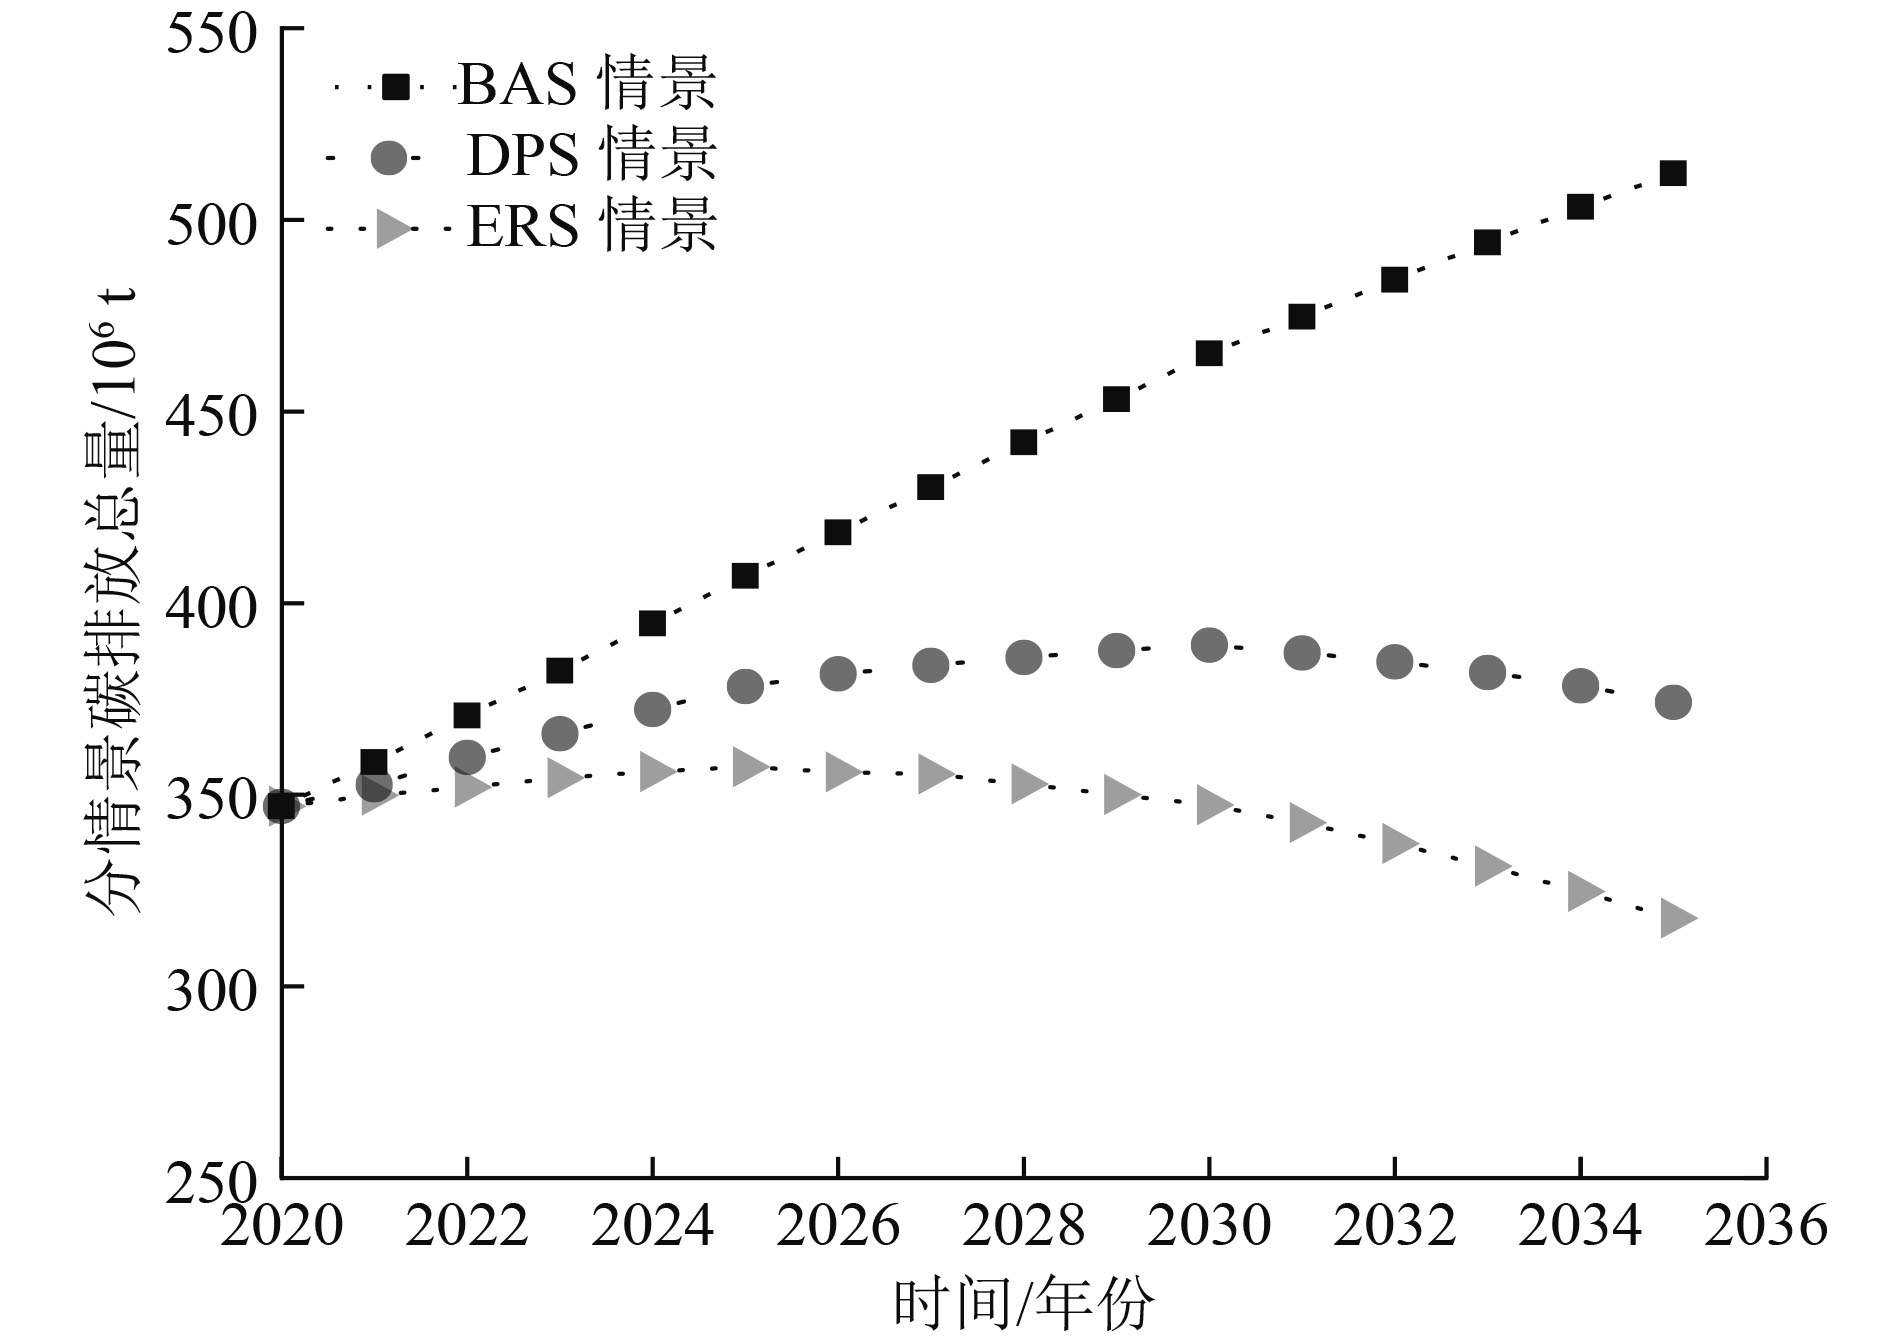
为了从区域层面开展能源消耗和碳排放量预测分析,以安徽省能源消耗和碳排放量为研究对象,通过构建LEAP-Anhui预测模型,设计了基准情景(BAS)、发展规划情景(DPS)、节能减排情景(ERS)3种情景,预测了安徽省未来3种不同的发展路径。结果显示:到2035年,BAS情景下能源消耗总量达到23 459×104 tce,相比BAS情景,DPS与ERS情景能源消耗总量分别下降了20.6%、30.7%,其中ERS情景的能源消耗总量于2030年实现达峰,峰值为16 416×104 tce;BAS情景下,安徽省碳排放总量到2035年已达到512.2×10⁶ t,年均增长率为2.6%。DPS与ERS情景下,碳排放总量分别于2030年(389.1×10⁶ t)、2025年(357.2×10⁶ t)达到峰值,均能够完成我国提出的争取在2030年前实现碳达峰的目标承诺。基于碳约束目标对于安徽省能源结构进行了优化分析,在约束路径下,分配给三大系统清洁能源的比例分别为:第三产业39.3%、居民生活23.3%、第二产业37.4%,最小清洁能源需求量为107×1016 J,在能源需求总量中的占比为20.6%。
Abstract:In order to conduct energy consumption and carbon emission prediction analysis at the regional level, energy consumption and carbon emissions in Anhui Province were taken as the research object. By constructing a LEAP Anhui prediction model, three scenarios including baseline scenario (BAS), development planning scenario (DPS), and energy conservation and emission reduction scenario (ERS), were designed to predict three different development paths in Anhui Province. The prediction results show that by 2035, the total energy consumption under BAS scenario will reach 2.3459×10⁸tce, and compared to BAS scenario, the total energy consumption under DPS and ERS scenarios will decrease by 20.6% and 30.7%, respectively. The total energy consumption under ERS scenario will reach its peak in 2030, with a peak of 1.6416 × 10⁸ tce. Under BAS scenario, the total carbon emissions in Anhui Province will reach 5.122×108t by 2035, with an average annual growth rate of 2.6%. Under DPS and ERS scenarios, the total carbon emissions will peak in 2030 and 2025, with 3.891×10⁸t and 3.572×10⁸t, respectively, both of which were able to fulfill China's commitment to achieve carbon peak before 2030. Based on the carbon constraint target, an optimization analysis was conducted on the energy structure of Anhui Province. Under the constraint path, the proportion of clean energy allocated to the three major systems is 39.3% for the tertiary industry, 23.3% for residential living, and 37.4% for the secondary industry. The minimum demand for clean energy is 1.07 × 10¹⁸J, accounting for 20.6% of the total energy demand.
-

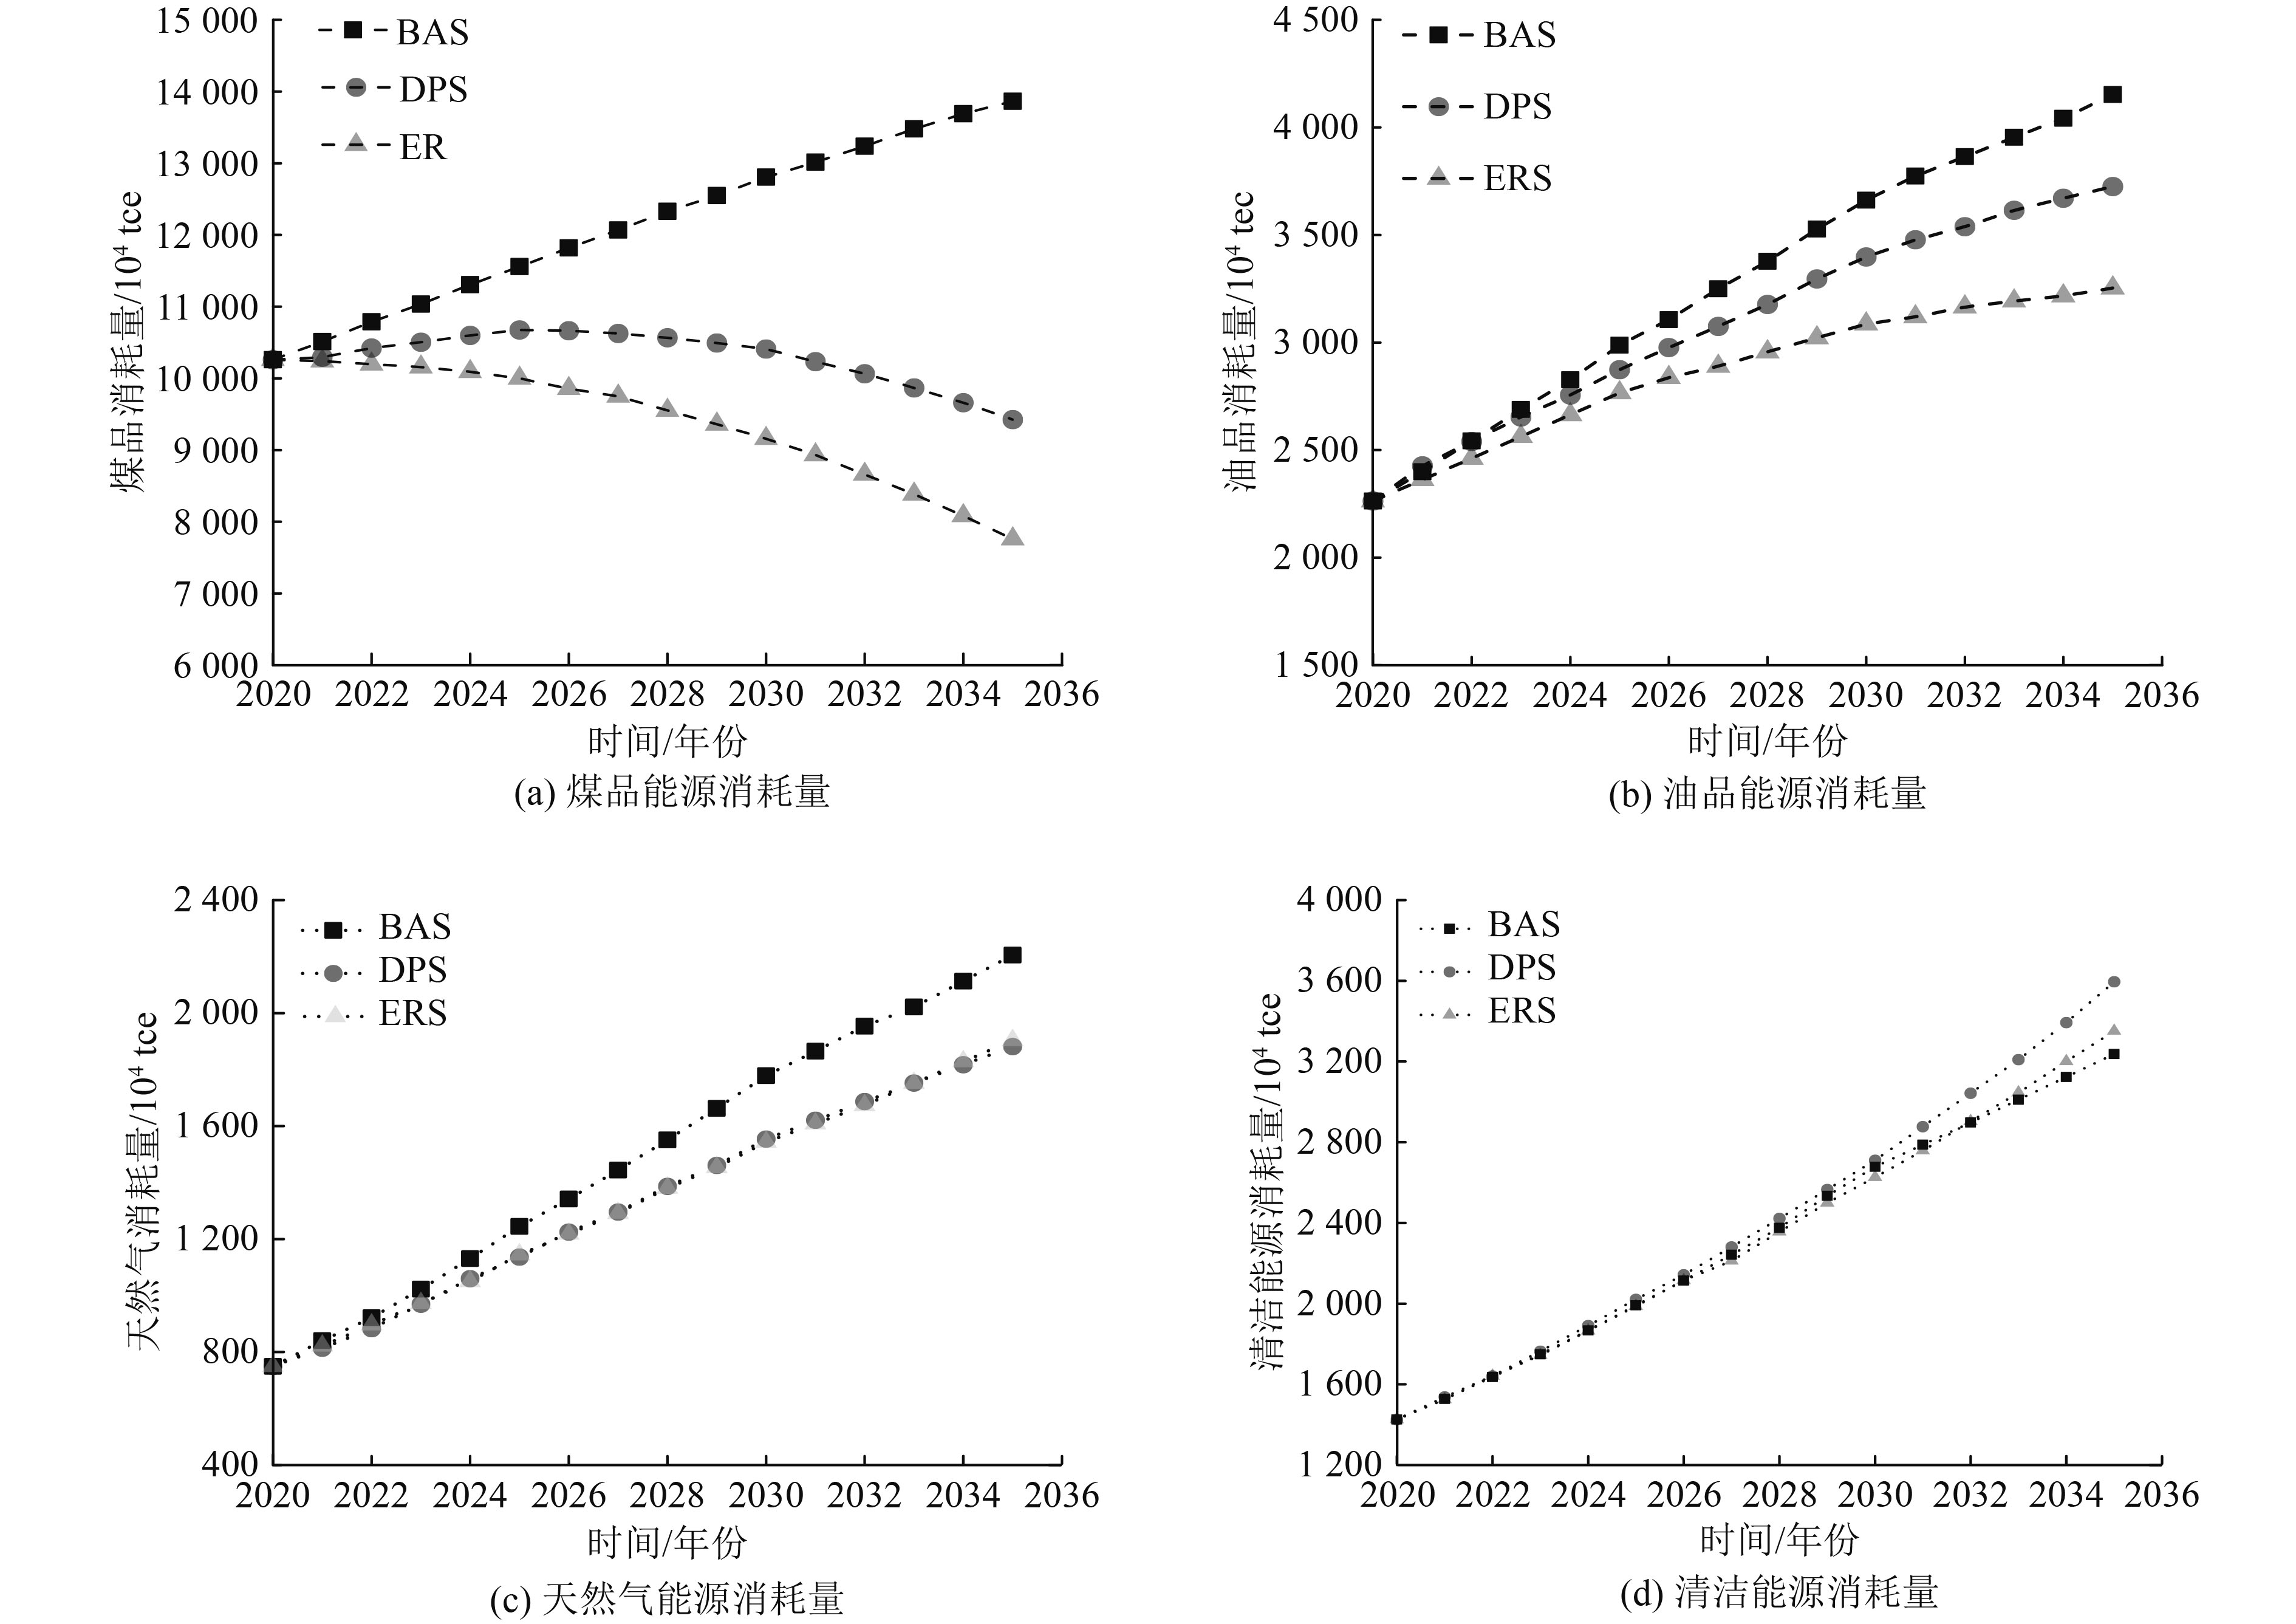
图 2 三种情景下安徽省能源消耗总量
Figure 2. Total energy consumption of Anhui Province under three scenarios
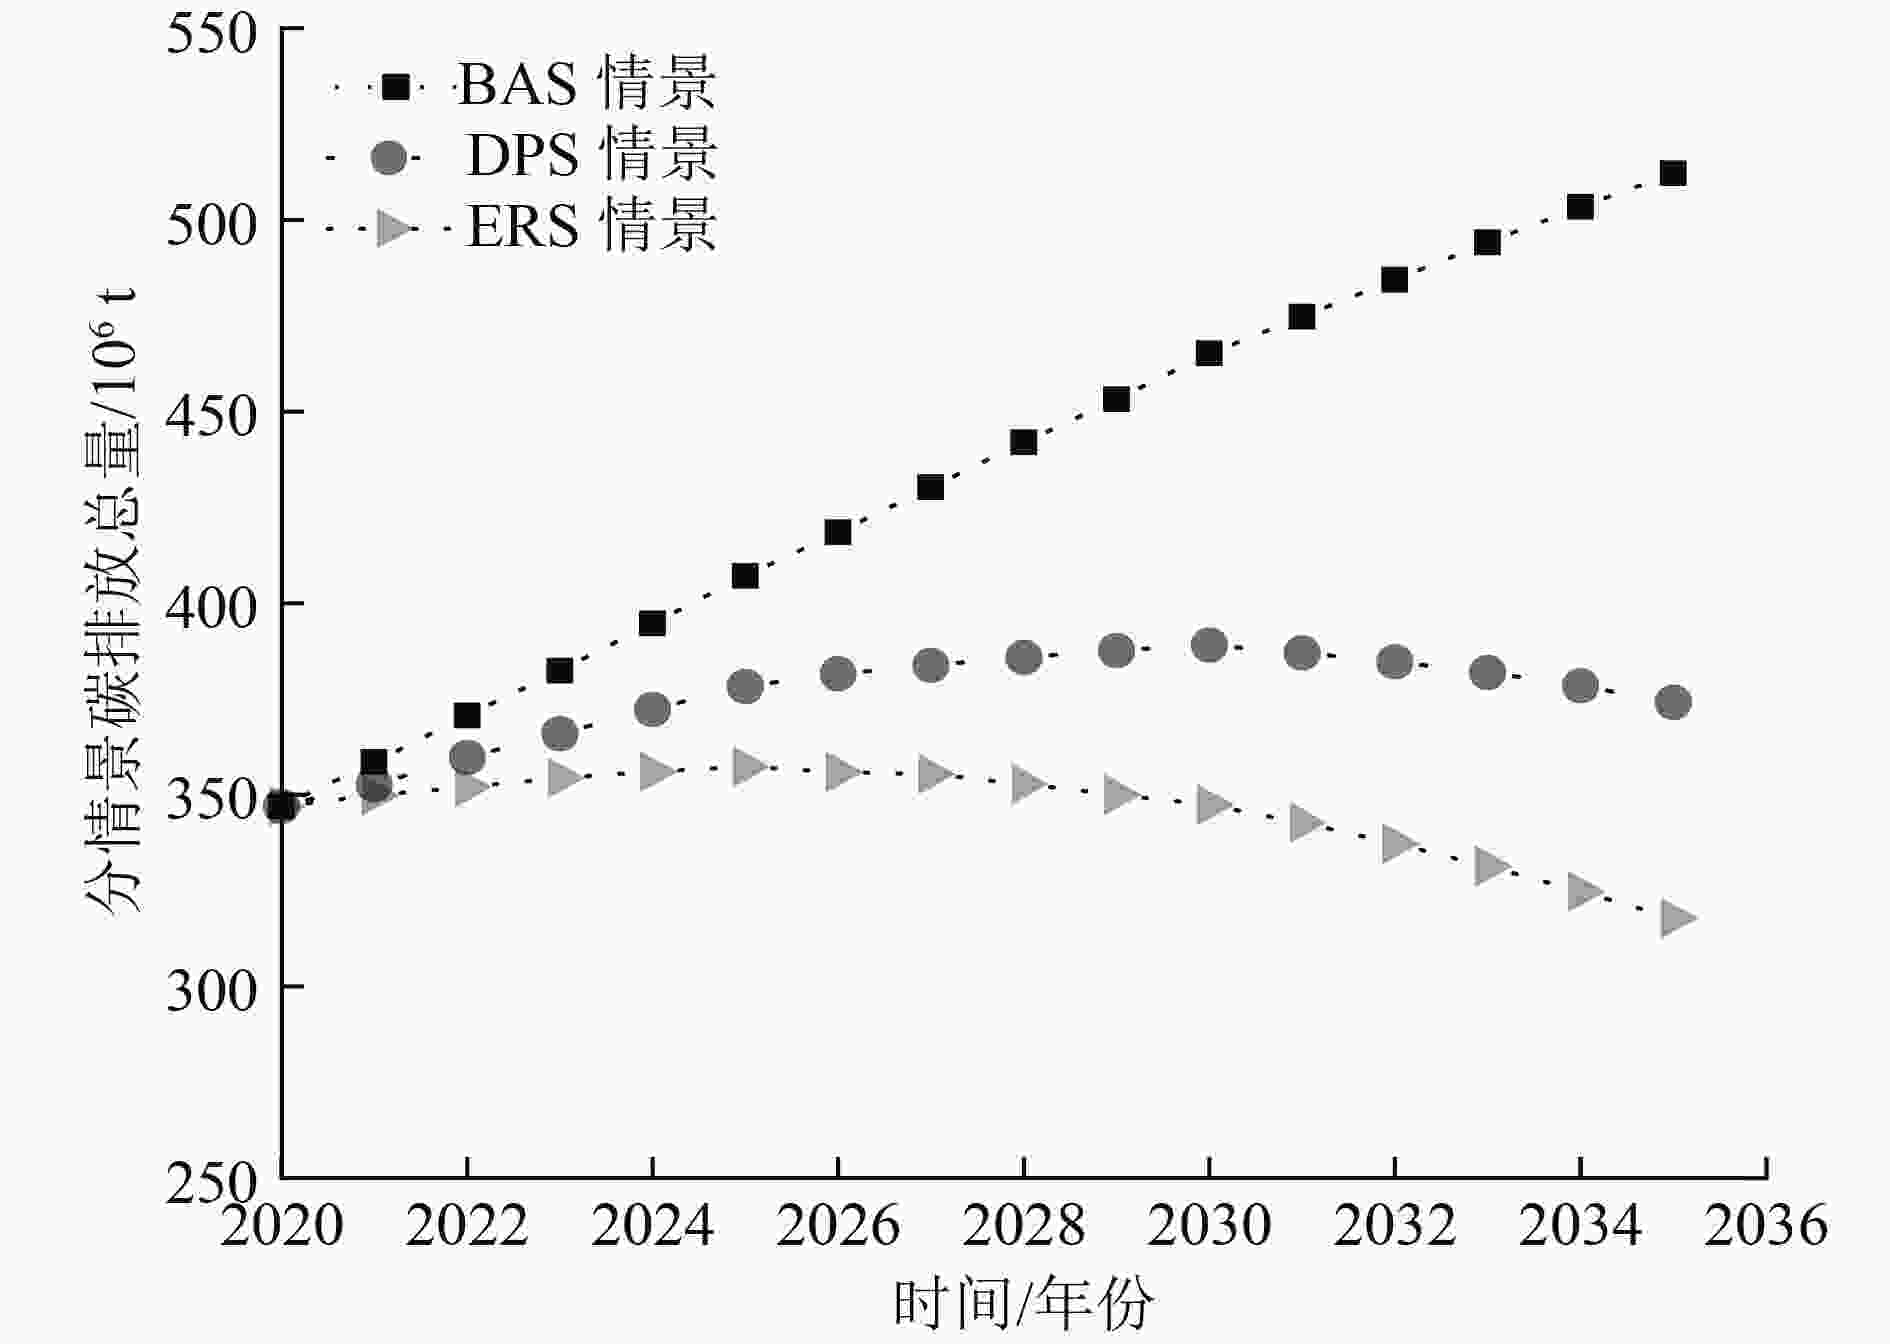
图 3 三种情景下安徽省碳排放总量
Figure 3. Total carbon emission of Anhui Province under three scenarios

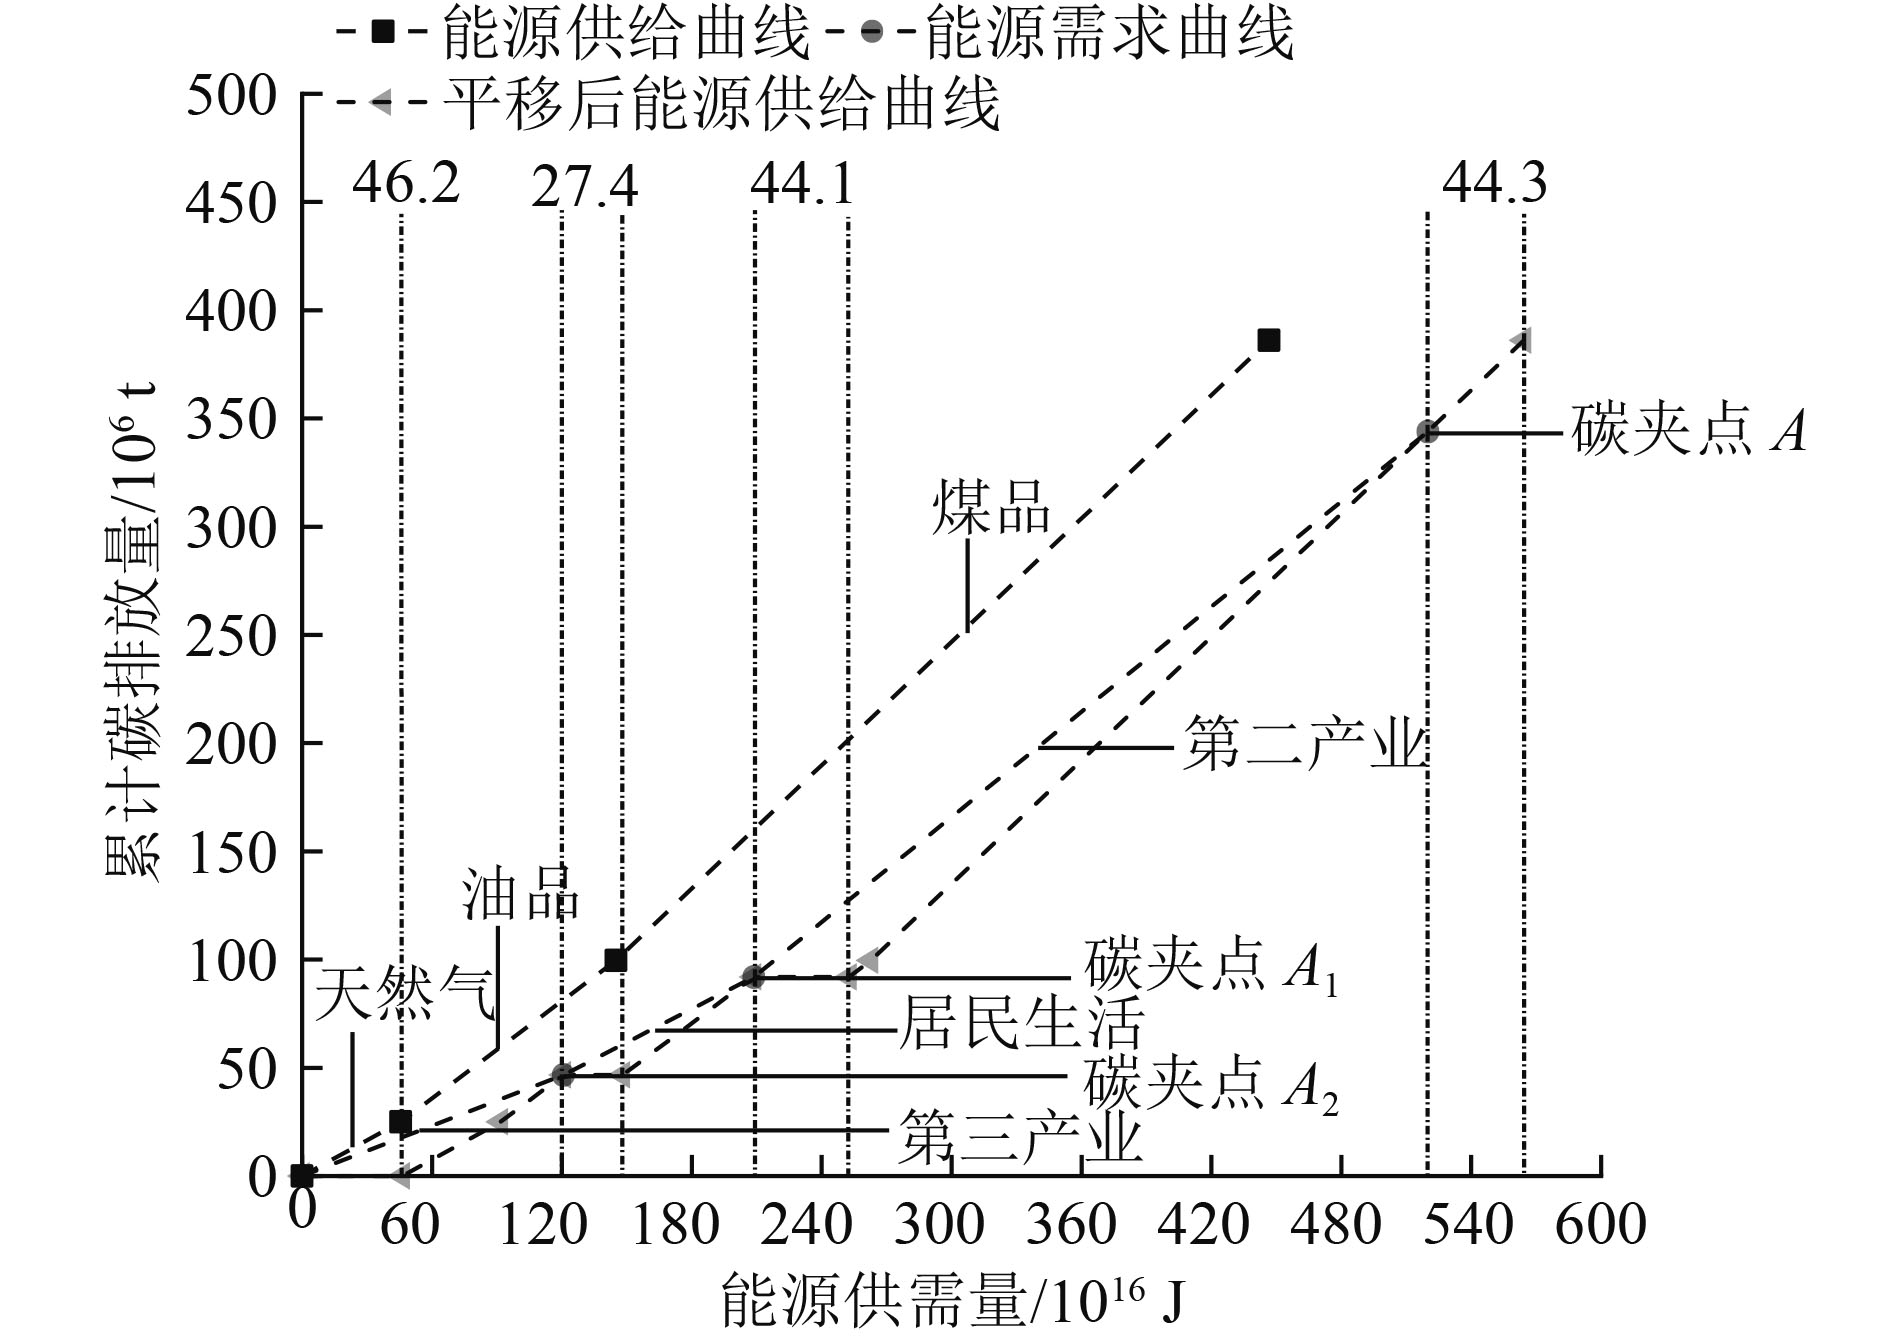
图 7 需求系统碳约束下的累计碳排放曲线
Figure 7. Cumulative carbon emission curve under the carbon constraint of demand system
表 1 安徽省2010—2021年各品种能源消耗总量
Table 1. Total energy consumption of various varieties in Anhui Province from 2010 to 2021
106 tce 年份 煤品 油品 天然气 清洁能源 消耗总量 年份 煤品 油品 天然气 清洁能源 消耗总量 2010 83.67 10.00 1.75 1.65 97.07 2016 95.10 20.77 5.19 5.57 126.63 2011 86.89 12.26 2.64 3.91 105.70 2017 94.39 22.65 5.86 7.29 130.19 2012 88.78 14.10 3.19 4.07 110.15 2018 94.26 22.33 7.05 9.31 132.95 2013 92.17 16.61 3.63 4.56 116.96 2019 97.37 23.02 7.91 10.40 138.70 2014 93.57 18.86 4.56 3.12 120.11 2020 102.59 22.63 7.50 14.26 146.98 2015 94.84 19.68 4.67 3.82 123.01 2021 107.37 24.55 7.01 14.53 153.46  下载: 导出CSV
表 2 安徽省2010—2021年各品种能源产生的碳排放量
Table 2. Carbon emissions generated by various types of energy sources in Anhui Province from 2010 to 2021
106 t 年份 煤品 油品 天然气 碳排放量 年份 煤品 油品 天然气 碳排放量 2010 232.7 21.9 2.8 257.4 2016 264.4 45.6 8.4 318.4 2011 241.6 26.9 4.3 272.8 2017 262.5 49.7 9.4 321.6 2012 246.9 31.0 5.1 283.0 2018 262.1 49 11.3 322.5 2013 256.3 36.5 5.8 298.6 2019 270.7 50.5 12.7 334.0 2014 260.2 41.4 7.3 308.9 2020 285.3 49.7 12.1 347.0 2015 263.7 43.2 7.5 314.5 2021 297.6 53.91 11.3 368.8
下载: 导出CSV
表 3 三种情景的基础参数指标
Table 3. Basic parameter indexes of three scenarios
参数指标 BAS情景 DPS情景 ERS情景
人口数2025年6 166万人
2030年6 228万人
2035年6 291万人2025年6 259万人
2030年6 513万人
2035年6 677万人
同BAS情景
城镇化率2025年63.7%
2030年69.6%
2035年76.1%
2035年71.8%
同DPS情景
GDP2025年57 363亿元
2030年81 209亿元
2035年109 705亿元2025年54 252亿元
2030年74 330亿元
2035年99 470亿元2025年52 996亿元
2030年70 920亿元
2035年92 690亿元产业结构 2035年三大产业结构占比为5.1∶31.9∶63 2035年三大产业结构占比为5.1∶28.7∶66.2 2035年三大产业结构占比为5.1∶27.1∶67.8
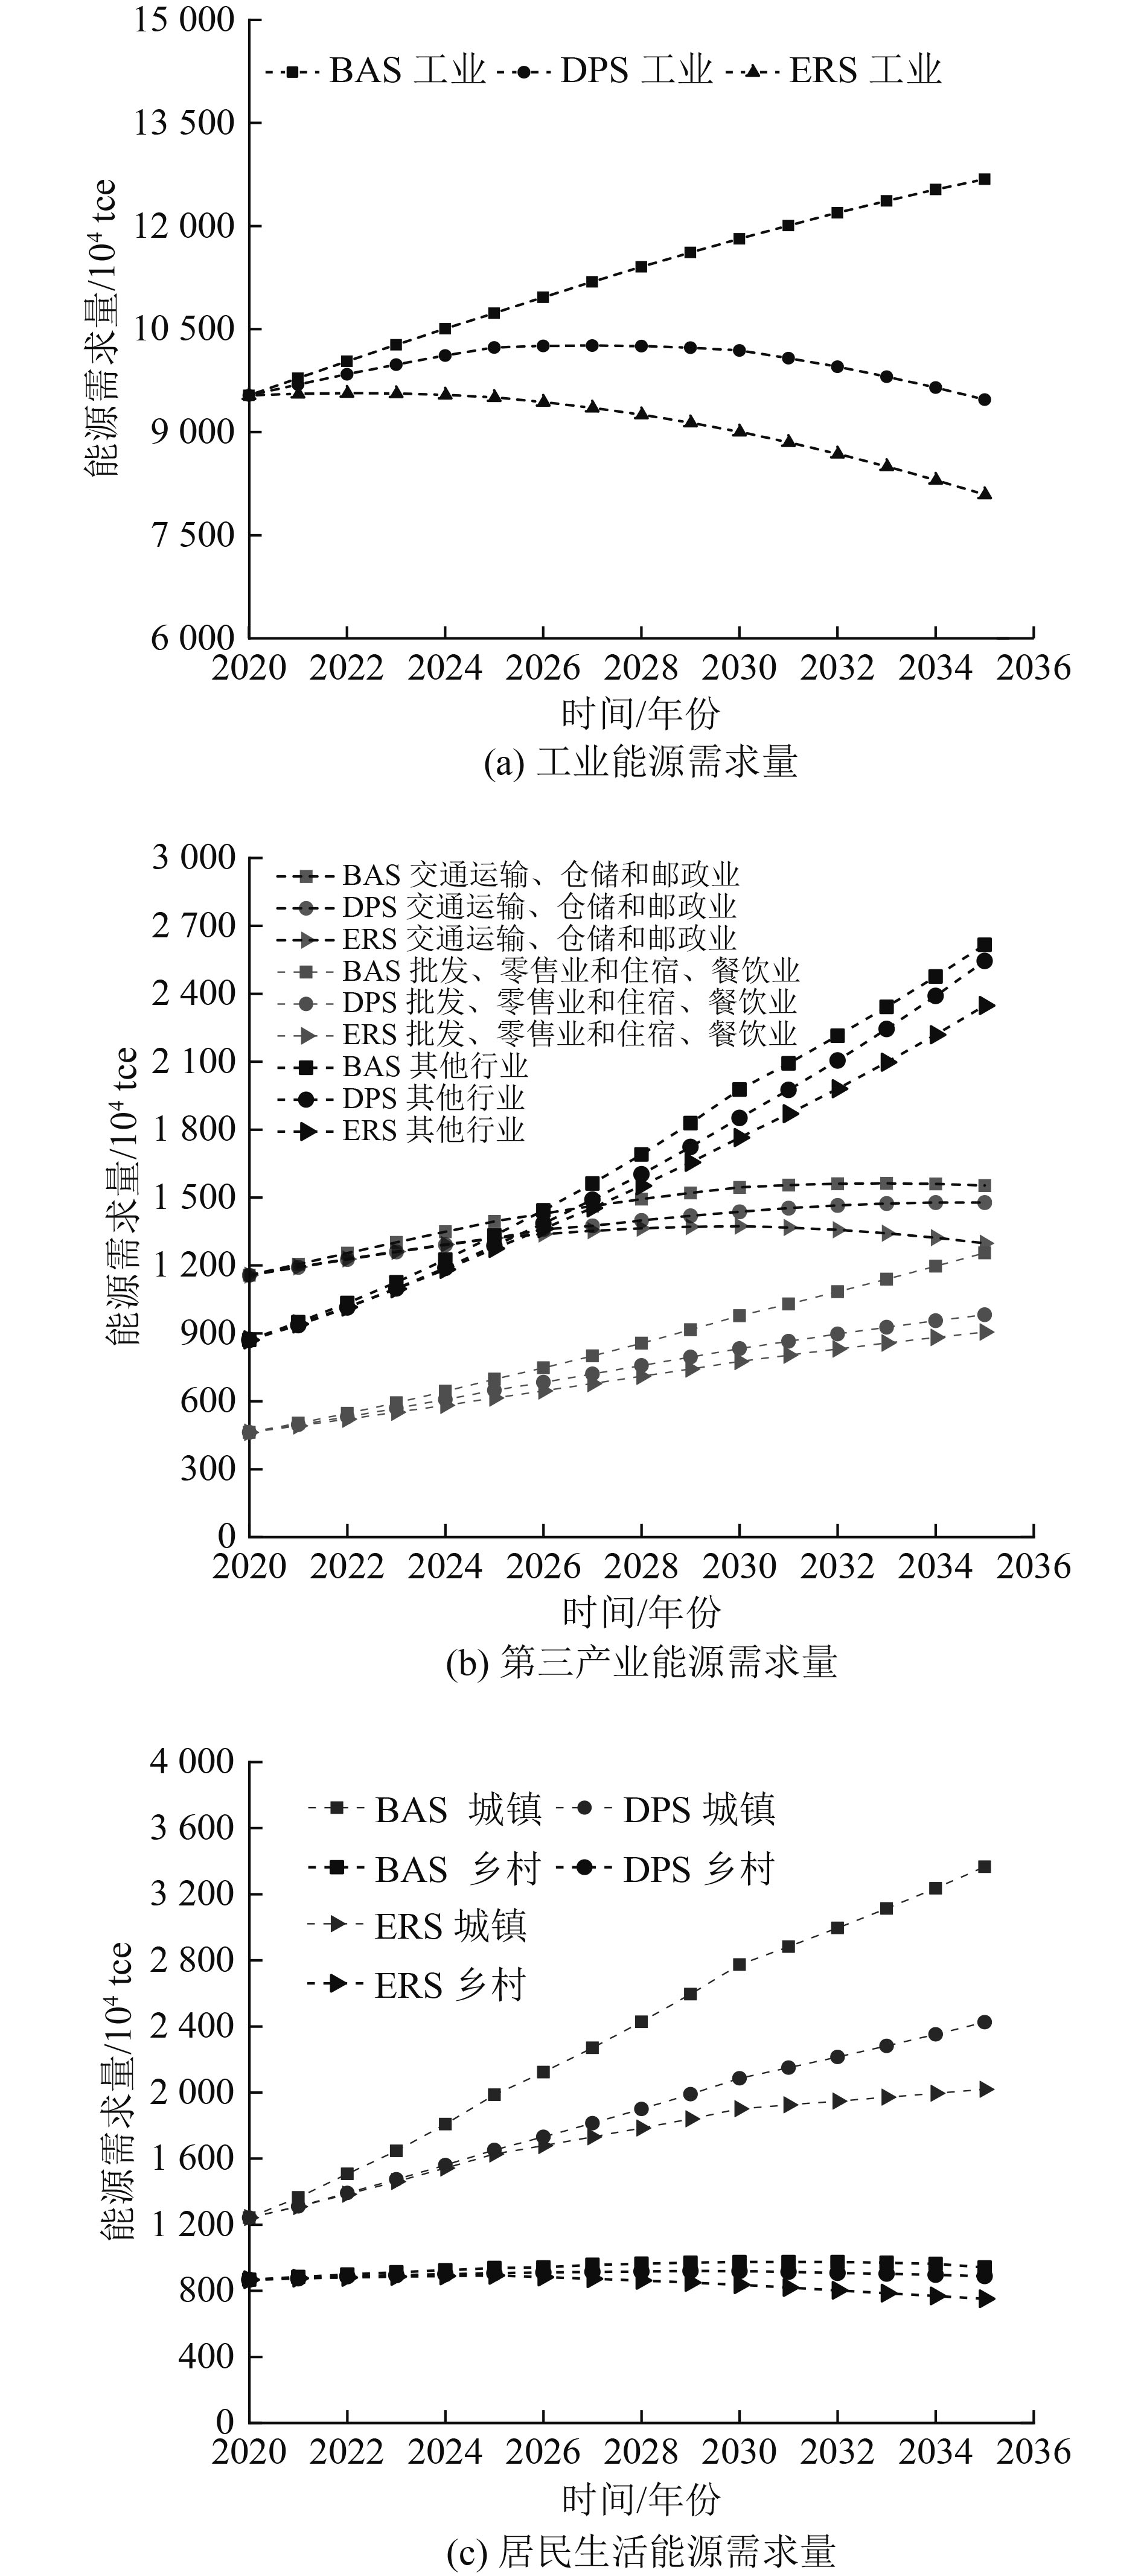
行业结构2035年第二产业下属两个行业占比69.9∶30.1;第三产业下属三个行业占比6.1∶24.5∶69.4 2035年第二产业下属两个行业占比65.7∶34.3;第三产业下属行业占比同BAS情景 2035年第二产业下属行业占比同DPS情景;第三产业下属行业占比同BAS情景 工业 2021—2035年间平均下降率为3.2%;
2035年为0.502 tce/万元同BAS情景 2035年能源强度为0.479 tce/万元 居民生活 2035年城镇能源强度0.703 tce/人;
乡村0.632 tce/人2035年城镇能源强度0.506 tce/人;
乡村0.472 tce/人2030年城镇与乡村能源强度分别为
0.447 tce/人、0.424 tce/人
下载: 导出CSV
表 4 安徽省2030年能源供给侧基础数据
Table 4. Basic data of energy supply side of Anhui Province in 2030
能源种类 碳排放系数/(10-12 t/J) 能源数量/1016 J 实际碳排放量/106 t 清洁能源 0 73.4 0 天然气 55 45.5 25.0 油品 75 99.5 74.6 煤品 95 301.6 286.5
下载: 导出CSV
表 5 安徽省2030年能源需求侧基础数据
Table 5. Basic data of energy demand side of Anhui Province in 2030
部门 碳排放系数/(10-12 t/J) 能源数量/1016J 碳约束目标/106t 第三产业 39 120.6 46.7 居民生活 51 88.0 45.2 第二产业 81 311.4 252.1
下载: 导出CSV
表 6 需求系统碳约束下的能源结构
Table 6. Energy structure under carbon constraint of demand system
/1016J 系统 煤品 油品 天然气 清洁能源 合计 第三产业 0 28.9 45.5 46.2 120.6 居民生活 0 60.6 0 27.4 88.0 第二产业 257.3 10.0 0 44.1 311.4
下载: 导出CSV
-
[1] LIU C, LI Q. Air Pollution, Global Warming and Difficulties to Replace Fossil Fuel with Renewable Energy[J]. Atmospheric and Climate Sciences,2023,13(4):526-538. doi: 10.4236/acs.2023.134030 [2] 中华人民共和国国务院新闻办公室. 中国应对气候变化的政策与行动[M]. 北京, 2021. [3] 国务院. 2030年前碳达峰行动方案[M]. 北京, 2021. [4] TANG B J, HU Y J, YANG Y. The initial allocation of carbon emission quotas in China based on the industry perspective[J]. Emerging Markets Finance and Trade,2021,57(4):931-948. doi: 10.1080/1540496X.2019.1645006 [5] WANG Q, LI S Y, LI R R. Forecasting energy demand in China and India: using single-linear, hybrid-linear, and non-linear time series forecast techniques[J]. Energy,2018,161:821-831. doi: 10.1016/j.energy.2018.07.168 [6] WEI Y G, WANG Z C, WANG H W, et al. Compositional data techniques for forecasting dynamic change in China’s energy consumption structure by 2020 and 2030[J]. Journal of Cleaner Production,2021,284:124702. doi: 10.1016/j.jclepro.2020.124702 [7] KAZEMZADEH M R, AMJADIAN A, AMRAEE T. A hybrid data mining driven algorithm for long term electric peak load and energy demand forecasting[J]. Energy,2020,204:117948. doi: 10.1016/j.energy.2020.117948 [8] NI H X, YAN S H, LUO C Y, et al. Energy data analysis and prediction based on time series ARIMA model[J]. New Generation of Information Technology,2019,2(12):501-507. [9] JI L. Energy consumption prediction in Hebei Province based on ARIMA model[J]. Business,2016(29):296. [10] DRAXLER F, VESCHGINI K, SALMHOFER M, et al. Essentially no barriers in neural network energy landscape[C]//International conference on machine learning. PMLR, 2018: 1309-1318. [11] HU Y C. Energy demand forecasting using a novel remnant GM (1, 1) model[J]. Soft Computing,2020,24(18):13903-13912. doi: 10.1007/s00500-020-04765-3 [12] LIU M H, ZHAI H X, LIU S N, et al. Comparative analysis of carbon emissions in Tianjin based on LMDI method and STIRPAT model[J]. Journal of Environmental Engineering Technology,2023,13(1):63-70. [13] WANG S, WANG Y X, ZHOU C X, et al. Projections in various scenarios and the impact of economy, population, and technology for regional emission peak and carbon neutrality in China[J]. International Journal of Environmental Research and Public Health,2022,19(19):12126. doi: 10.3390/ijerph191912126 [14] ZHANG Z X, JIA J S, GUO Y L, et al. Scenario of carbon dioxide (CO2) emission peaking and reduction path implication in five northwestern provinces of China by the low emissions analysis platform (LEAP) model[J]. Frontiers in Energy Research,2022,10:983751. doi: 10.3389/fenrg.2022.983751 [15] YU M C, XU Z J, YU J. Influencing factors of CO2 emission and scenario analysis in Shanxi Province[J]. Research of Environmental Sciences,2018,31(8):1357-1365. [16] ZHANG J, LIU J Y, DONG L, et al. Influencing factors and scenario analysis of China’s CO2 emission of energy consumption[J]. Journal of Environmental Engineering Technology,2023,13(1):71-78. [17] TAN R R, FOO D C Y. Pinch analysis approach to carbon-constrained energy sector planning[J]. Energy,2007,32(8):1422-1429. doi: 10.1016/j.energy.2006.09.018 [18] CRILLY D, ZHELEV T. Further emissions and energy targeting: an application of CO2 emissions pinch analysis to the Irish electricity generation sector[J]. Clean Technologies and Environmental Policy,2010,12(2):177-189. doi: 10.1007/s10098-009-0245-0 [19] YAO M, WANG C X. Pinch analysis for regional energy allocation with carbon emission constraints[J]. Journal of Shanghai Maritime University,2012,33(3):58-63. [20] COSSUTTA M, FOO D C Y, TAN R R. Carbon emission pinch analysis (CEPA) for planning the decarbonization of the UK power sector[J]. Sustainable Production and Consumption,2021,25:259-270. doi: 10.1016/j.spc.2020.08.013 [21] XI L, GAO P, WANG H L, et al. Optimization of energy structure in Zhuzhou city based on carbon pinch technology[J]. Energy and Energy Conservation,2023(11):49-52. [22] TANG J R, LIAO X B. Optimization of energy consumption structure in Jiangsu based on carbon pinch technology[J]. Resources Science,2014,36(12):2560-2568. [23] LIANG L L, LU Q C. Optimization of China’s energy structure based on carbon pinch analysis[J]. Resources Science,2015,37(2):291-298. [24] KROEZE C, MOSIER A, NEVISON C, et al. Revised 1996 IPCC guidelines for national greenhouse gas inventories: chapter 4. Agriculture[M]. Bracknell: UK Meteorological Office, 1997. [25] ZHANG C Q, LUO H X. Research on carbon emission peak prediction and path of China’s public buildings: scenario analysis based on LEAP model[J]. Energy and Buildings,2023,289:113053. doi: 10.1016/j.enbuild.2023.113053 [26] 安徽省发展和改革委员会. 《安徽省国民经济和社会发展第十四个五年规划和2035年远景目标纲要》[M]. 合肥, 2021. [27] 安徽省政府办公厅和安徽省能源局. 《安徽省“十四五”能源发展规划》[M]. 合肥, 2022. [28] 国务院新闻办公室. 《中国应对气候变化的政策与行动》[M]. 北京: 国务院新闻办公室, 2021. [29] 安徽省人民政府. 《安徽省碳达峰实施方案》[M]. 合肥: 安徽省人民政府, 2022. [30] 安徽省发展改革委员会. 《安徽省工业领域碳达峰实施方案》[M]. 合肥: 安徽省发展改革委员会, 2022. ⊕ -

 下载:
下载:


 点击查看大图
计量
- 文章访问数: 30
- HTML全文浏览量: 8
- PDF下载量: 1
- 被引次数: 0