

Analysis of temperature characteristics and influencing factors of the stormwater runoff in typical catchment in Beijing
-
摘要:
城市化发展导致不透水地表面积率大幅攀升,由此带来的一系列问题逐渐受到人们关注,夏季城市汇水区域地表产生高温径流后汇入下游受纳水体所造成的雨水径流热污染,对水生态、水环境造成不良影响的风险尤为突出。选取北京市典型汇水区域,对2021—2022年多场降雨径流出流温度进行监测与分析,并对气象因素、下垫面温度及管道内径流热量等数据进行同步采集,运用皮尔逊相关系数法分析其影响因素。结果表明:研究区域夏季降雨常出现雨水径流温度升高现象,降水量小于12.5 mm、降雨历时短于250 min的降雨场次更易于升温,升温幅度最高可达4.1 ℃;径流温度升高往往出现在径流过程初期,温度达峰平均时间为38 min;径流是否升温与降雨强度峰值位置之间没有明显关系;气温、不透水地表初始时刻温度、降雨历时及降水量是雨水径流温度的极显著影响因素(P<0.01);降雨期间气温、降雨历时、不透水地表初始时刻温度和管道内壁温度4个指标,可以基本解释研究区域96.7%的径流温度输出情况。
Abstract:With the development of urbanization, the rate of impervious surface area has increased greatly, and a series of problems have attracted more and more attention. The risk of adverse impacts on the water ecology and water environment has become more and more prominent in the summer when the surface of the urban catchment produces high temperature runoff and then sinks into the downstream receiving water bodies caused by the thermal pollution of stormwater runoff. A typical catchment in Beijing was selected to monitor and analyze the runoff temperature of several rainfall events from 2021 to 2022. The data of meteorological factors, underlying surface temperature and pipeline runoff heat were collected simultaneously, and the Pearson correlation coefficient method was applied to analyze the influencing factors. The results showed that the temperature of stormwater runoff often increased in summer rainfall in the study area, and rainfall events with precipitation less than 12.5 mm and durations shorter than 250 min were more prone to warming, with a maximum warming of 4.1 ℃. Runoff temperature increases tended to occur at the beginning of the runoff process, with an average time to peak of 38 min, and there was no obvious relationship between the temperature rise and the peak location of rainfall intensity. The highly significant (P<0.01) influencing factors of stormwater runoff temperature included air temperature, precipitation, rainfall duration, and the impervious surface temperature at the initial moment of rainfall. The four indicators of air temperature during rainfall, rainfall duration, impervious surface temperature, and pipe wall temperature at the initial moment could explain 96.7% of the runoff temperature output in the study area.
-
Key words:
- stormwater runoff /
- monitoring /
- runoff temperature /
- correlation analysis /
- multiple linear regression
-

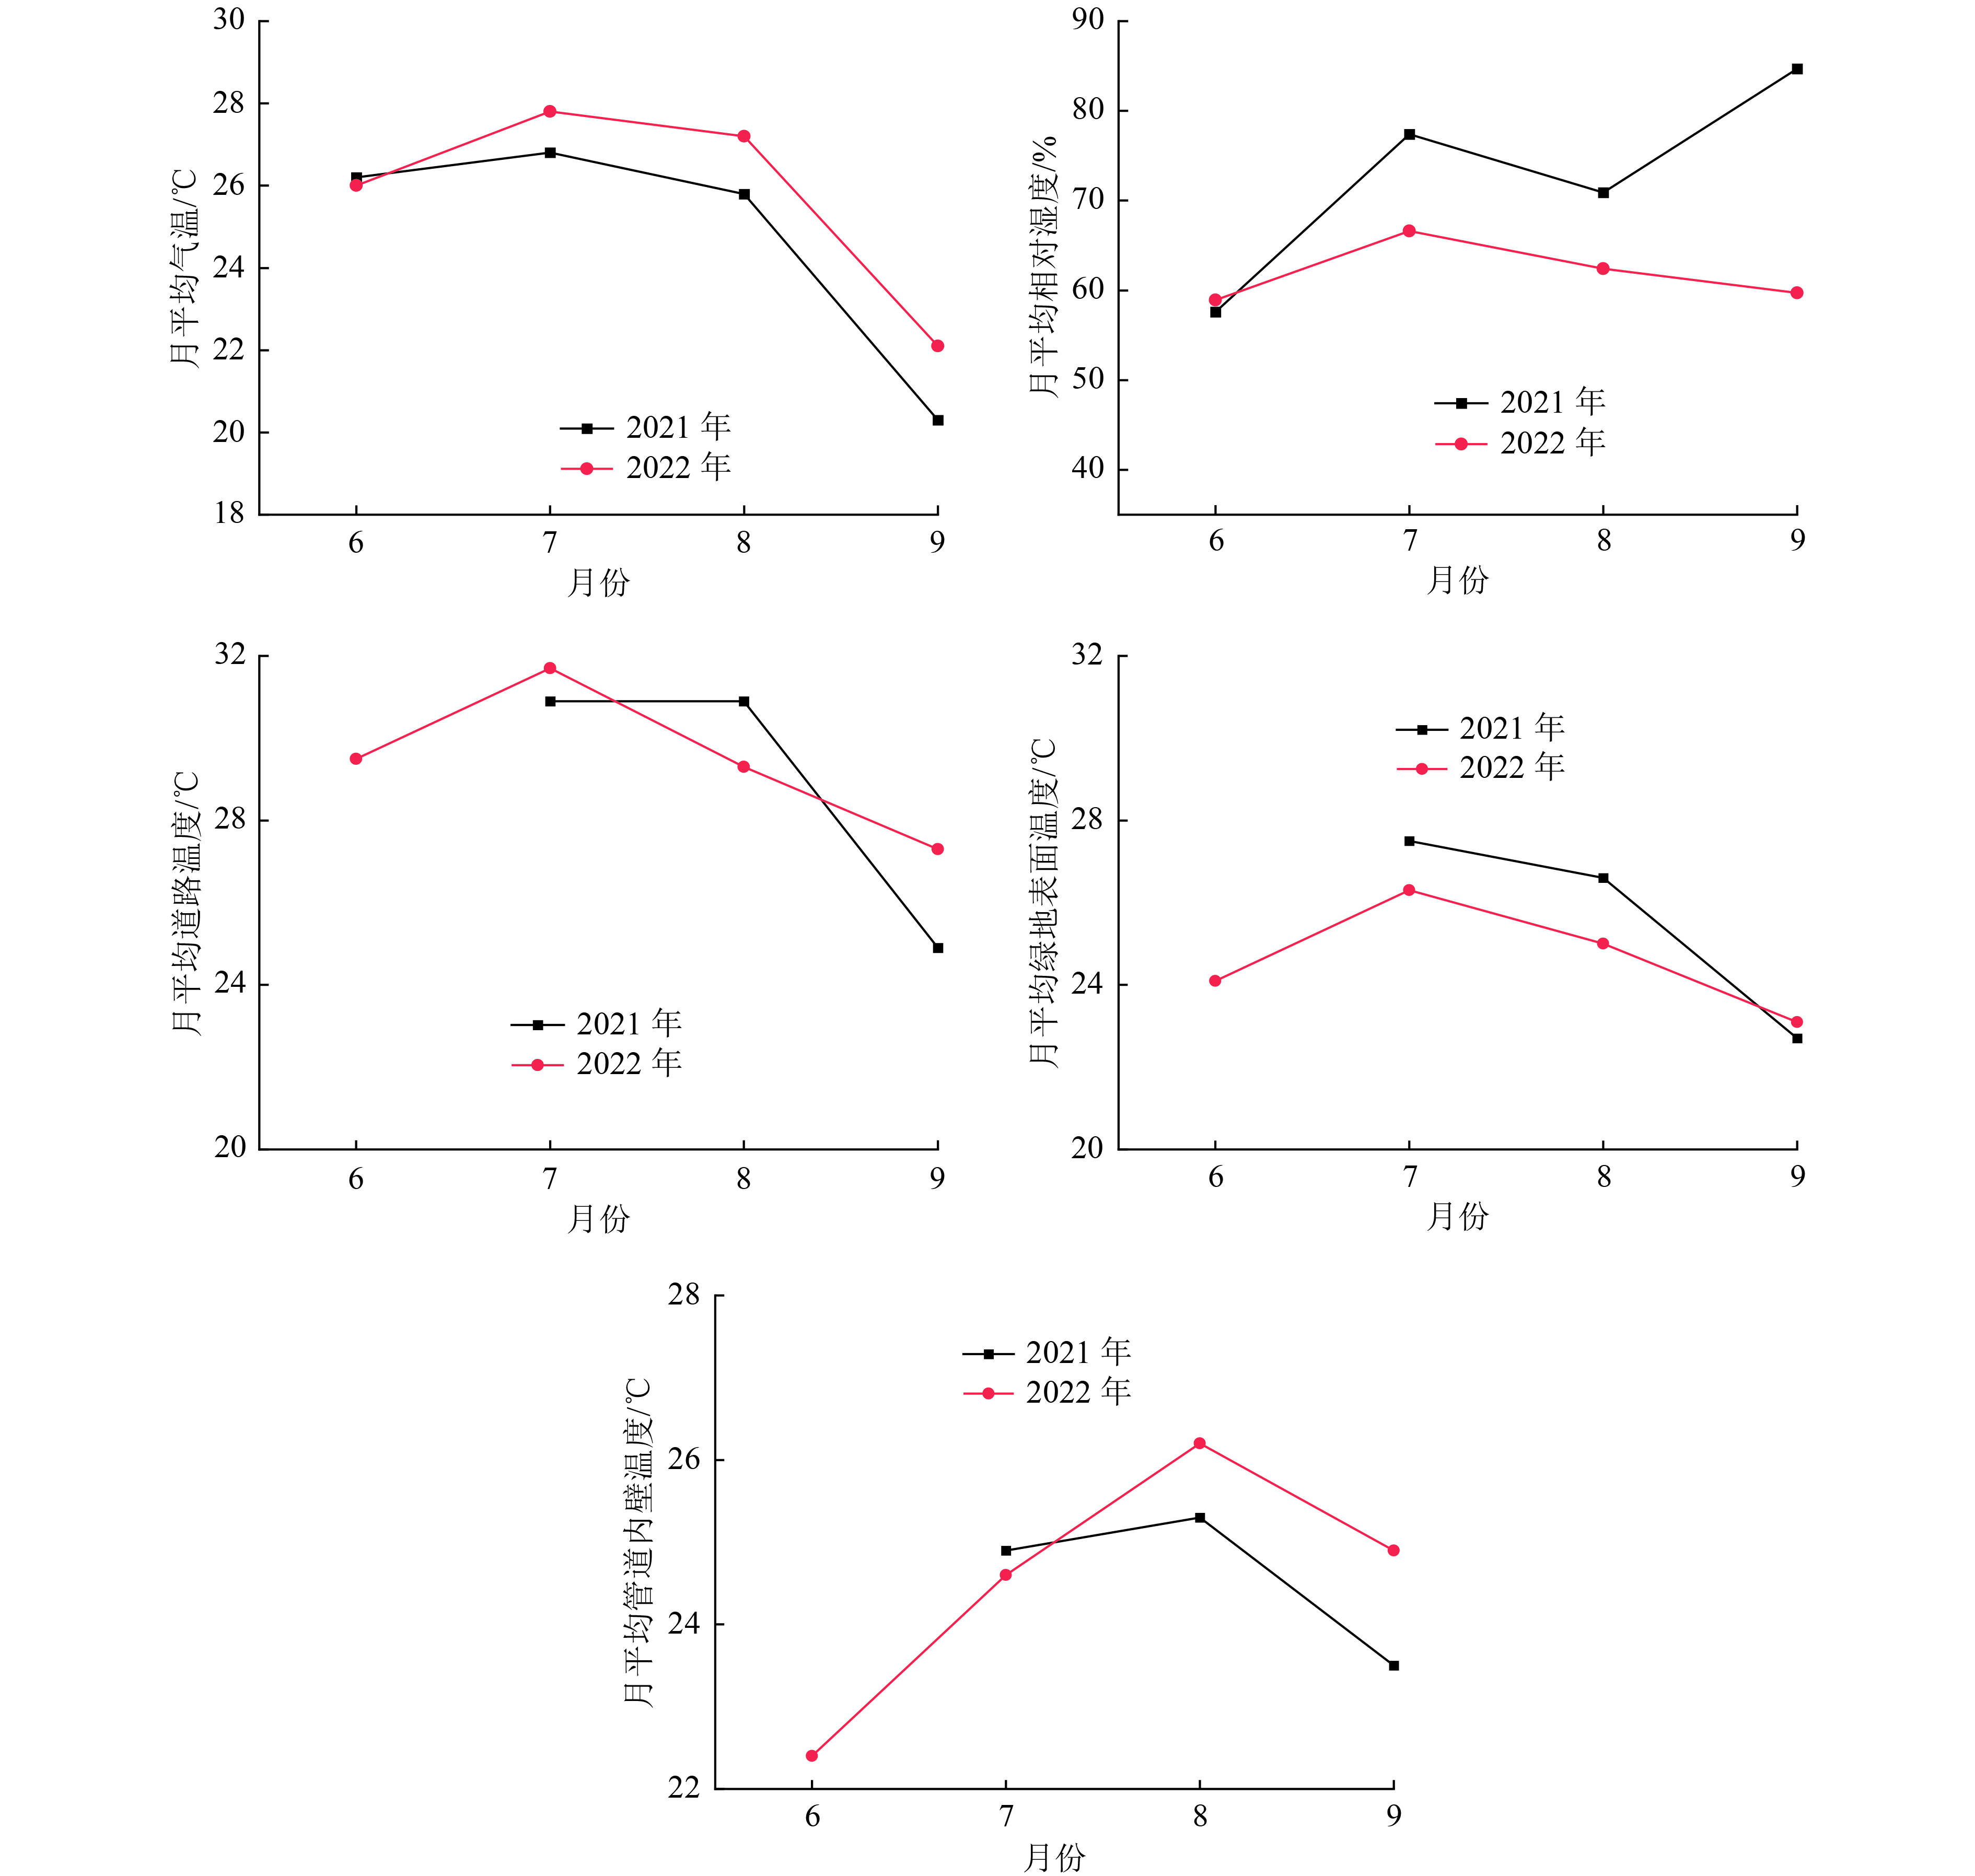
图 2 2021—2022年监测期间研究区域月平均气温、湿度以及绿地表面和管道内壁温度对比
Figure 2. Comparison of monthly mean air temperature, humidity, green surface temperature and pipe wall temperature in the study area for the monitoring period of 2021-2022

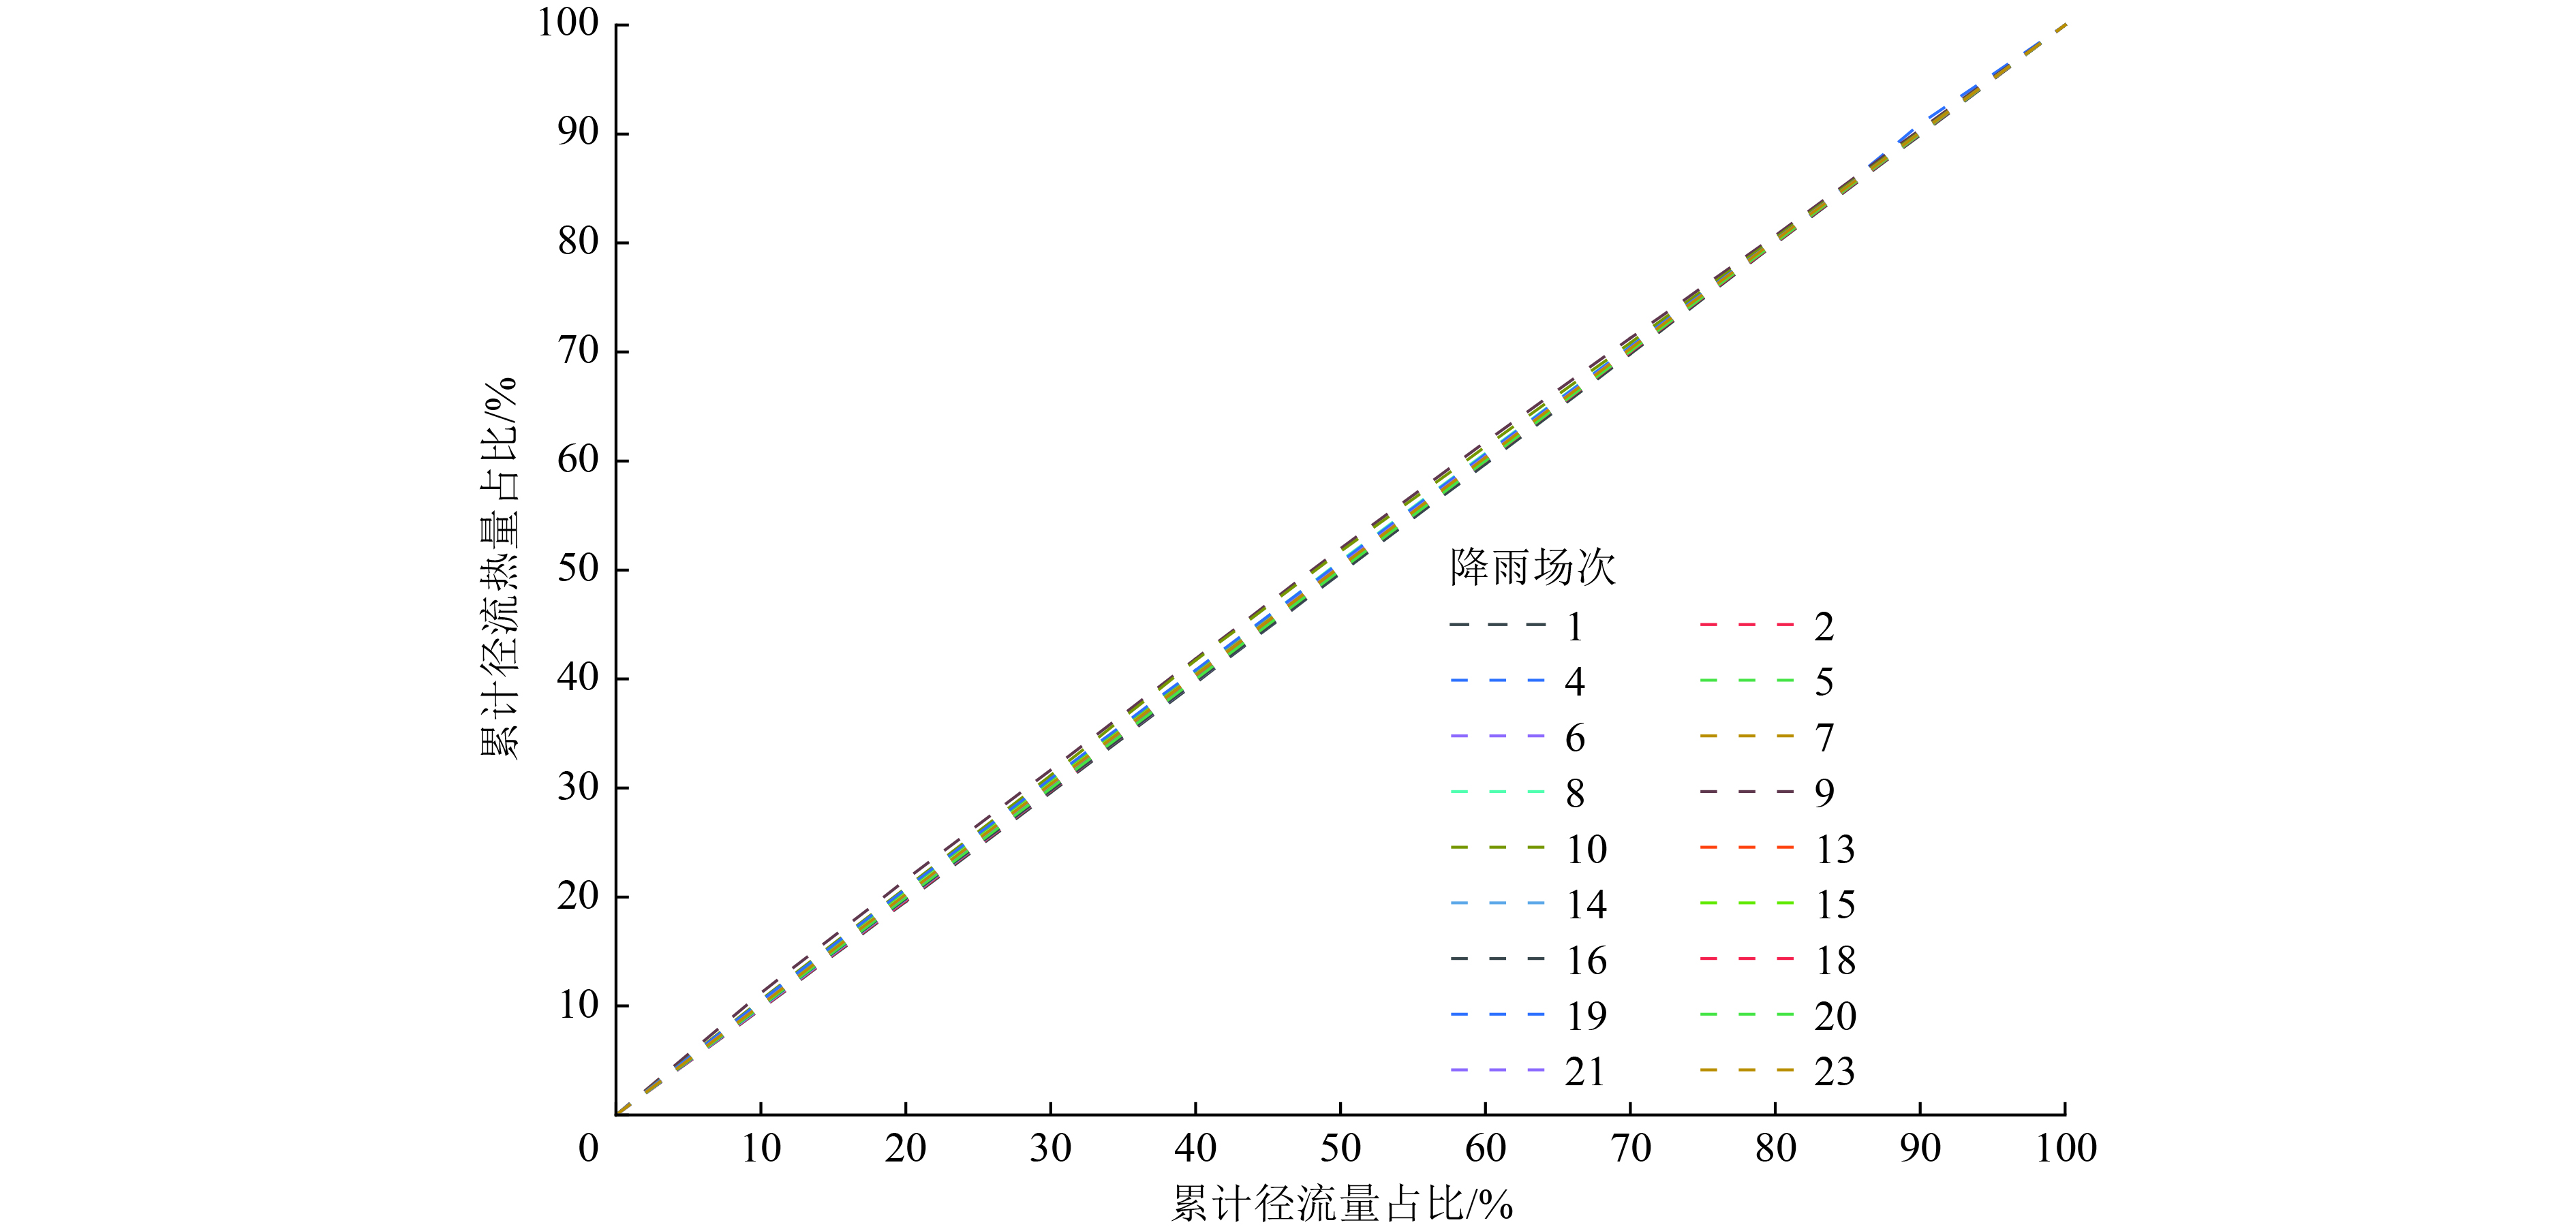
图 3 汇水区域单场降雨累计径流热量占比随累计径流量占比的变化
Figure 3. Schematic diagram of variation of cumulative runoff heat with cumulative runoff for single rainfall event in the catchment

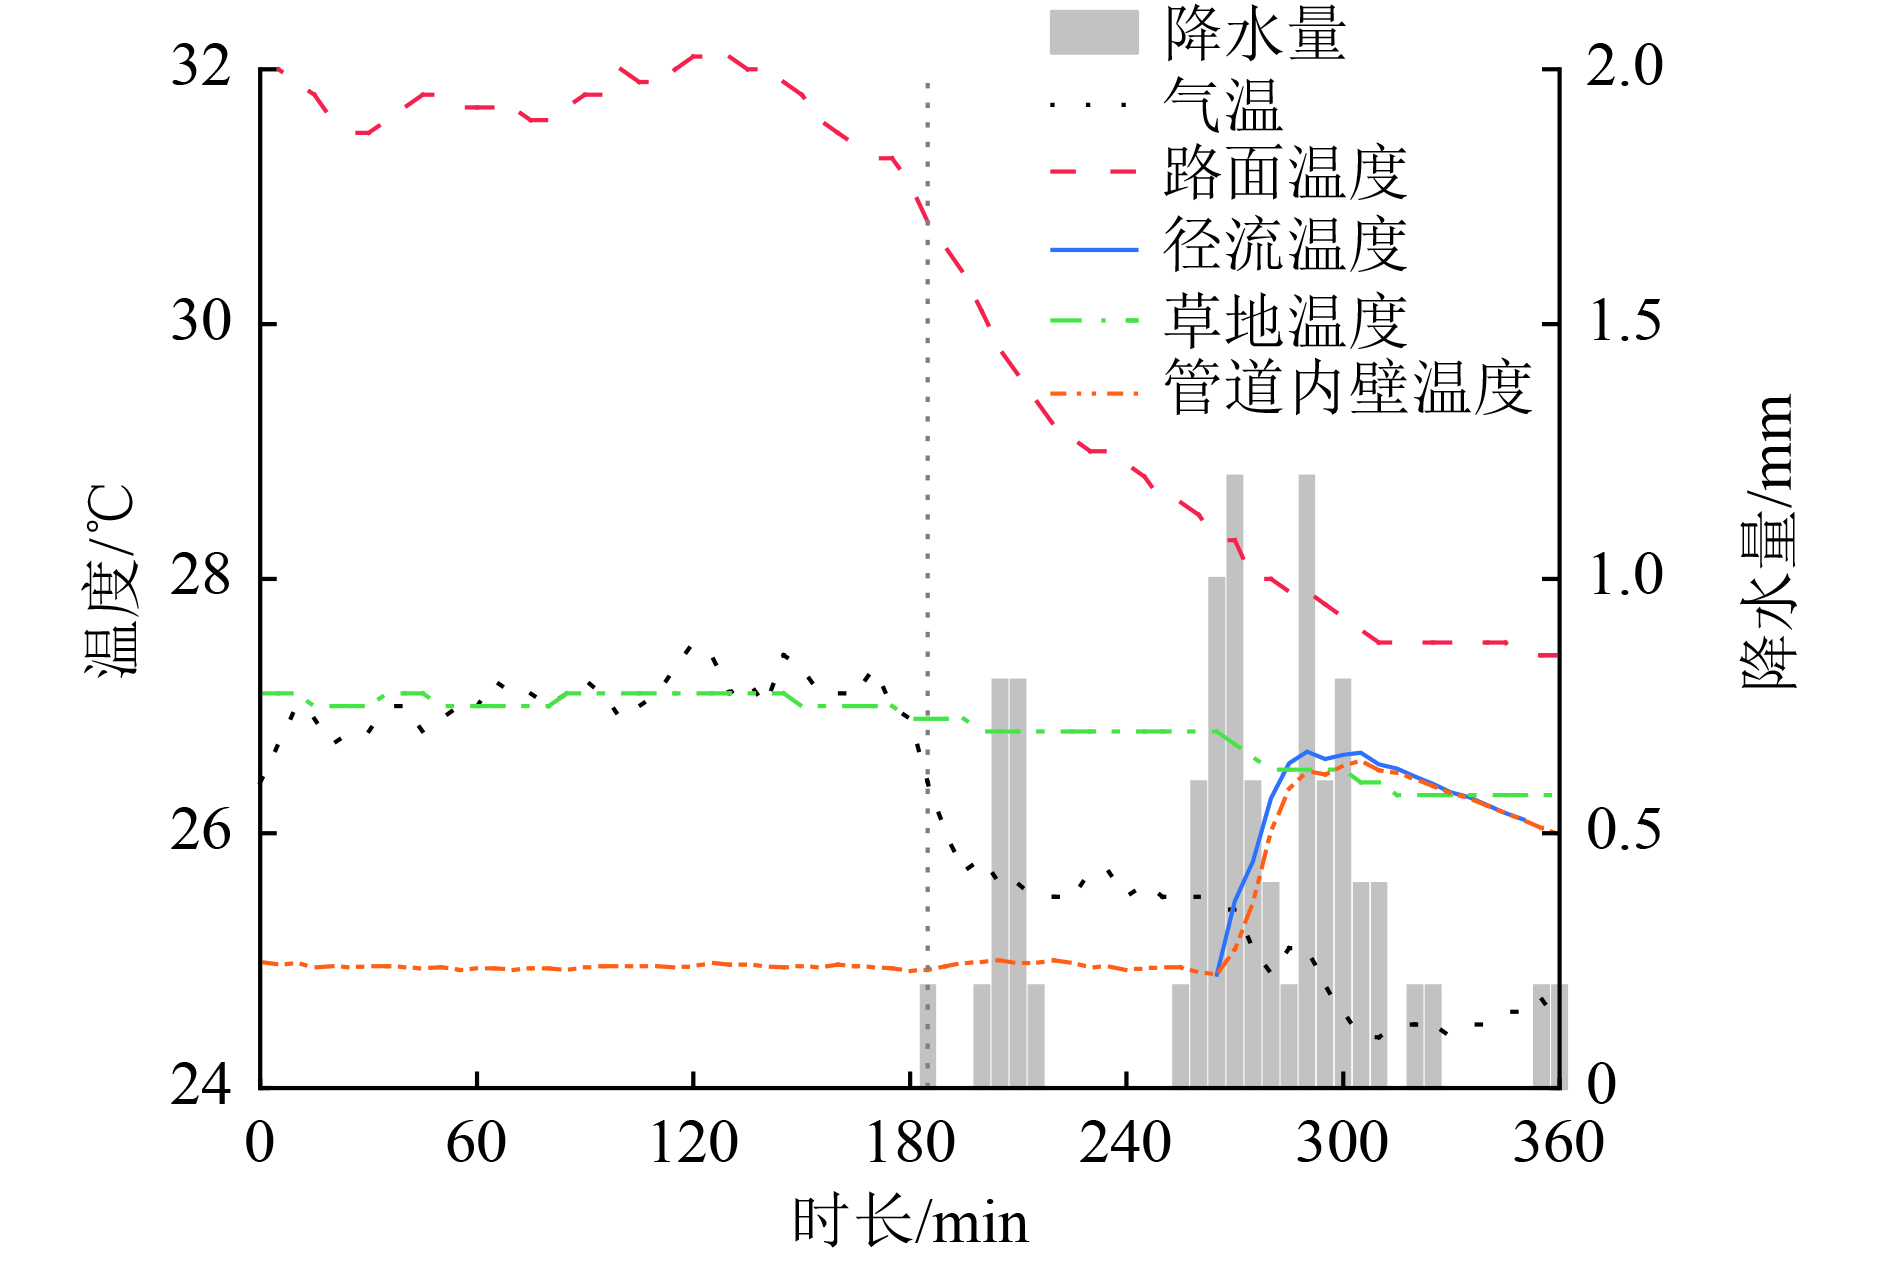
图 4 降雨前不透水地表温度快速下降示例(第2场次)
注:垂直虚线表示降雨开始。
Figure 4. Example of rapid decrease of impervious surface temperature before rainfall (event 2)

图 5 EMT的监测值与模型一、模型二计算值对比
Figure 5. Comparison of EMT monitoring values, model 1 calculated values and model 2 calculated values
表 1 2021—2022年23场有效降雨的特征及降雨过程中气象指标
Table 1. Characteristics of 23 effective rainfall events and meteorological indicators during rainfall from 2021-2022
日期 场次 降水量/
mm开始
时刻降雨历时/
min最大瞬时降雨
强度/(mm/h)雨中平均
气温/℃雨中平均
相对湿度/%雨中平均露点
温度/℃雨中平均
风速/m雨中平均太阳
辐射强度/(W/m2)2021-07-27 1 7.6 02:10 45 24.0 25.7 92.9 24.4 1.8 0.0 2 10.8 17:15 240 14.4 24.9 92.2 23.3 1.6 9.8 2021-08-04 3 4.6 03:40 205 4.8 23.9 93.2 22.3 1.5 0.0 2021-08-09 4 16.6 19:25 75 115.2 19.5 88.0 17.1 4.5 0.0 2021-08-14 5 6.2 06:45 80 31.2 22.5 88.7 20.2 1.6 57.0 6 5.4 15:45 125 36.0 26.1 78.4 21.7 1.4 115.1 7 11.4 20:10 80 57.6 22.2 89.1 20.0 1.4 0.0 2021-08-19 8 38.4 06:25 745 9.6 20.2 92.2 18.6 0.7 63.7 2021-09-19 9 58.0 12:00 1 490 9.6 17.0 97.1 16.4 2.8 29.8 2021-09-24 10 23.6 23:15 755 26.4 19.3 98.2 18.9 1.7 27.3 2022-06-12 11 2.4 22:15 70 14.4 20.0 86.0 17.2 3.3 0.0 2022-06-22 12 3.0 09:35 90 4.8 24.2 86.1 21.4 1.4 169.1 2022-06-27 13 6.6 01:55 90 16.8 22.6 88.5 19.1 1.3 0.0 2022-06-28 14 8.6 00:30 150 9.6 23.2 90.8 21.3 1.6 0.0 15 53.6 22:35 615 33.6 21.1 91.2 19.4 1.1 42.3 2022-07-03 16 10.4 15:15 565 9.6 23.8 93.4 22.5 1.6 39.2 2022-07-05 17 4.2 15:20 40 14.4 24.9 83.9 21.7 3.9 49.3 2022-07-06 18 7.2 04:30 150 7.2 23.0 87.7 20.4 2.0 7.9 2022-07-10 19 32.4 00:55 465 28.8 20.4 89.0 18.2 1.2 22.1 2022-07-12 20 10.0 00:15 250 16.8 21.7 91.2 20.4 2.8 0.0 2022-07-22 21 7.6 22:00 200 7.2 22.3 85.7 19.4 2.3 0.0 2022-07-27 22 3.6 14:15 105 7.2 24.3 90.3 22.4 2.0 190.4 2022-08-21 23 12.2 20:35 205 28.8 24.8 90.4 22.9 2.1 0.0 注:日期后有2场或3场的,表示按降雨场次划分标准同一天发生了多场降雨。  下载: 导出CSV
表 2 2021—2022年23场有效降雨的雨水管道内径流温度和地表温度
Table 2. Pipe runoff temperature and surface temperature for 23 effective rainfall events from 2021-2022
日期 场次 场降雨平
均温度/℃径流最大
升温
幅度/℃温度达峰
时间/min初始时刻 降雨过程中 降雨开始前 地表温度/℃ 雨水管道
内壁温度/℃道路平均
温度/℃绿地
平均温度/℃3 h道路平
均温度/℃1 h道路平
均温度/℃0.5 h道路平
均温度/℃2021-07-27 1 27.3 2.6 20 29.2 24.9 28.4 27.4 30.5 29.8 29.5 2 26.4 1.7 35 30.6 24.9 28.4 26.6 31.7 31.6 31.2 2021-08-04 3 26.0 1.1 45 28.6 25.1 27.6 26.3 30.2 29.6 29.3 2021-08-09 4 24.2 — 34.1 25.6 29.5 25.1 37.5 35.2 34.9 2021-08-14 5 25.7 0.1 5 27.8 25.8 27.2 24.8 27.8 27.8 27.7 6 27.5 1.8 20 32.8 26.0 30.8 28.0 33.7 33.5 33.4 7 25.6 — 27.6 26.0 27.1 25.9 29.0 28.4 28.1 2021-08-19 8 23.6 — 25.8 25.7 24.1 23.4 26.6 26.2 26.1 2021-09-19 9 19.1 — 20.6 24.3 19.3 19.1 20.6 20.5 20.6 2021-09-24 10 21.2 — 24.2 23.8 21.7 20.9 25.2 24.6 24.4 2022-06-12 11 22.1 0.5 20 24.7 21.9 22.8 21.1 25.4 24.8 24.8 2022-06-22 12 24.4 2.4 30 26.1 22.4 25.7 24.5 27.1 26.9 26.3 2022.06.27 13 24.0 0.9 60 24.8 23.0 24.3 23.7 25.2 25.2 25.2 2022-06-28 14 24.8 1.7 95 27.3 23.3 25.8 24.5 27.8 27.5 27.4 15 23.3 1.1 20 26.3 23.3 23.2 21.2 26.8 26.4 26.4 2022-07-03 16 24.4 0.4 110 25.1 24.0 24.3 23.4 25.0 25.1 25.1 2022-07-05 17 27.7 4.3 35 43.4 24.4 41.2 29.8 44.2 45.5 44.9 2022-07-06 18 24.4 — 24.2 24.1 24.0 23.2 24.6 24.2 24.2 2022-07-10 19 23.4 0.9 20 27.5 24.1 24.4 22.9 29.4 28.2 28.1 2022-07-12 20 24.4 0.4 15 25.2 24.2 23.4 22.7 25.7 25.3 25.2 2022-07-22 21 25.3 1.0 10 28.5 25.0 25.9 24.7 31.1 29.4 29.0 2022-07-27 22 26.3 0.9 55 28.1 25.6 27.3 25.8 27.4 27.9 28.1 2022-08-21 23 26.7 0.7 55 28.3 26.6 26.9 24.9 30.4 28.7 28.5 注:—表示该场次为未升温场次,即雨水管道内径流自降雨开始时持续降温场次,同时该场降雨不存在径流温度达峰时间。
下载: 导出CSV
表 3 所有场次、升温场次、升温大于1.0 ℃场次中EMT及各影响因素的平均值对比
Table 3. Comparison of mean values of EMT and each influencing factor in all events, warming events, and events with warming greater than 1.0 ℃
场次 平均降
水量/mm平均降雨
历时/min平均
EMT/℃初始时刻不透水
地表平均
温度/℃雨中平均
气温/℃所有场次 15.0 297 24.7 27.9 22.5 升温场次 11.1 208 25.3 28.5 23.4 升温大于
1.0 ℃场次11.7 190 25.9 30.3 24.0
下载: 导出CSV
表 4 EMT与下垫面因素、管道因素的相关系数(r)
Table 4. Correlation coefficient of EMT with subsurface factor and pipe factor
降雨前3 h道路
平均温度降雨前1 h道路
平均温度降雨前0.5 h道路
平均温度道路初始时刻
温度降雨期间道路
平均温度降雨期间绿地
平均温度管道内壁初始
时刻温度0.676** 0.690** 0.690** 0.702** 0.785** 0.940** 0.505* 注:*表示P<0.05,显著相关;**表示P<0.01,极显著相关。全文同。
下载: 导出CSV
表 5 EMT与气象因素的相关系数(r)
Table 5. Correlation coefficient (r)of EMT and meteorological factors
平均气温 平均
相对湿度平均
露点温度平均
风速平均
太阳辐射降水量 降雨
历时平均
降雨强度最大
降雨强度0.896** −0.496* 0.789** −0.066 0.162 −0.641** −0.739** 0.230 0.045
下载: 导出CSV
表 6 逐步多元线性回归结果
Table 6. Stepwise multiple linear regression results
序号 多元线性回归模型 R2 F检验 显著性 1 $ \mathrm{EMT}=6.973^{\mathrm{*}}+0.787X_1^{\mathrm{*}\mathrm{*}} $ 0.794 85.8 <0.001 2 $ \mathrm{EMT}_{\mathrm{ }}=5.844^{\mathrm{*}\mathrm{*}}+0.638X_1^{\mathrm{*}\mathrm{*}}+0.161X_2^{\mathrm{*}\mathrm{*}} $ 0.888 88.1 <0.001 3 $ \mathrm{EMT}_{\mathrm{ }}=-2.422+0.614X_1^{\mathrm{*}\mathrm{*}}+0.131X_2^{\mathrm{*}\mathrm{*}}+0.393X_3^{\mathrm{*}\mathrm{*}} $ 0.938 112.3 <0.001 4 $ \mathrm{EMT_{\mathrm{ }}}=-0.097+0.501X_1^{\mathrm{*}\mathrm{*}}+0.101X_2^{\mathrm{*}\mathrm{*}}+0.453X_3^{\mathrm{*}\mathrm{*}}-0.001X_4^{\mathrm{*}\mathrm{*}} $ 0.967 160.9 <0.001 注:X1为平均气温,℃;$ {X}_{2} $为不透水地表初始时刻温度,℃;$ {X}_{3} $为管道内壁初始时刻温度,℃;$ {X}_{4} $为降雨历时,min。
下载: 导出CSV
-
[1] 李小静, 李俊奇, 戚海军, 等. 城市雨水径流热污染及其缓解措施研究进展[J]. 水利水电科技进展,2013,33(1):89-94.LI X J, LI J Q, QI H J, et al. Advance in thermal pollution of urban rainfall runoff and its mitigation measures[J]. Advances in Science and Technology of Water Resources,2013,33(1):89-94. [2] LI J Q, GONG Y, LI X J, et al. Urban stormwater runoff thermal characteristics and mitigation effect of low impact development measures[J]. Journal of Water and Climate Change,2019,10:53-62. doi: 10.2166/wcc.2018.145 [3] HERB W R, JANKE B, MOHSENI O, et al. Thermal pollution of streams by runoff from paved surfaces[J]. Hydrological Processes,2008,22(7):987-999. doi: 10.1002/hyp.6986 [4] 龙华. 温度对鱼类生存的影响[J]. 中山大学学报(自然科学版),2005,44(增刊1):254-257.LONG H. The effect of temperature on fish survival[J]. Acta Scientiarum Naturalium Universitatis Sunyatseni,2005,44(Suppl 1):254-257. [5] 孙艳涛, 王惠民, 吴修锋. 温排水对水体生态环境影响的分析及处理[J]. 水资源保护,2008,24(2):70-72.SUN Y T, WANG H M, WU X F. Impacts of thermal discharge on aquatic ecological environment and the countermeasures[J]. Water Resources Protection,2008,24(2):70-72. [6] MATTHEWS K R, BERG N H. Rainbow trout responses to water temperature and dissolved oxygen stress in two southern California stream pools[J]. Journal of Fish Biology,1997,50(1):50-67. doi: 10.1111/j.1095-8649.1997.tb01339.x [7] 王锦旗, 宋玉芝, 黄进. 水温升高对水体性质及水生生物的影响研究进展[J]. 水生态学杂志,2020,41(1):100-109.WANG J Q, SONG Y Z, HUANG J. Effects of increasing water temperature on water properties and aquatic organisms: a critical review[J]. Journal of Hydroecology,2020,41(1):100-109. [8] GRIGORYEVA I L, KOMISSAROV A B, KUZOVLEV V V, et al. Influence of thermal pollution on the ecological conditions in cooling reservoirs[J]. Water Resources,2019,46(1):S101-S109. [9] 黄群芳, 国超旋, 李娜, 等. 富春江库区高温热浪变化特征及对藻类水华潜在影响研究[J]. 环境科学研究,2022,35(2):530-539.HUANG Q F, GUO C X, LI N, et al. Characteristics of summer heat waves and potential effect on algal blooms in Fuchunjiang Reservoir[J]. Research of Environmental Sciences,2022,35(2):530-539. [10] 张欢, 张佳磊, 刘德富, 等. 三峡水库水温对浮游植物群落演替和多样性的影响[J]. 环境工程技术学报,2017,7(2):134-139.ZHANG H, ZHANG J L, LIU D F, et al. Influence of water temperature in Three Gorges Reservoir on succession and diversity of phytoplankton community[J]. Journal of Environmental Engineering Technology,2017,7(2):134-139. [11] LI J Q, LI J, LI X J, et al. Analysis of thermal pollution reduction efficiency of bioretention in stormwater runoff under different rainfall conditions[J]. Water,2022,14(21):3546. doi: 10.3390/w14213546 [12] JONES M P, HUNT W F, WINSTON R J. Effect of urban catchment composition on runoff temperature[J]. Journal of Environmental Engineering,2012,138(12):1231-1236. doi: 10.1061/(ASCE)EE.1943-7870.0000577 [13] HATHAWAY J M, WINSTON R J, BROWN R A, et al. Temperature dynamics of stormwater runoff in Australia and the USA[J]. Science of the Total Environment,2016,559:141-150. doi: 10.1016/j.scitotenv.2016.03.155 [14] THOMPSON A M, KIM K, VANDERMUSS A J. Thermal characteristics of stormwater runoff from asphalt and sod surfaces1[J]. Journal of the American Water Resources Association,2008,44(5):1325-1336. doi: 10.1111/j.1752-1688.2008.00226.x [15] SABOURI F, GHARABAGHI B, MAHBOUBI A A, et al. Impervious surfaces and sewer pipe effects on stormwater runoff temperature[J]. Journal of Hydrology,2013,502:10-17. doi: 10.1016/j.jhydrol.2013.08.016 [16] NELSON K C, PALMER M A. Stream temperature surges under urbanization and climate change: data, models, and responses1[J]. Journal of the American Water Resources Association,2007,43(2):440-452. doi: 10.1111/j.1752-1688.2007.00034.x [17] JANKE B D, HERB W R, MOHSENI O, et al. Simulation of heat export by rainfall-runoff from a paved surface[J]. Journal of Hydrology,2009,365(3/4):195-212. [18] THOMPSON A M, WILSON T, NORMAN J M, et al. Modeling the effect of summertime heating on urban runoff temperature1[J]. Journal of the American Water Resources Association,2008,44(6):1548-1563. doi: 10.1111/j.1752-1688.2008.00259.x [19] HERB W R, JANKE B, MOHSENI O, et al. Runoff temperature model for paved surfaces[J]. Journal of Hydrologic Engineering,2009,14(10):1146-1155. doi: 10.1061/(ASCE)HE.1943-5584.0000108 [20] OMIDVAR H, SONG J Y, YANG J C, et al. Rapid modification of urban land surface temperature during rainfall[J]. Water Resources Research,2018,54(7):4245-4264. doi: 10.1029/2017WR022241 [21] 骆其金, 周昭阳, 黎京士, 等. 滤坝系统对城市初期雨水的净化效果[J]. 环境工程技术学报,2019,9(3):282-285.LUO Q J, ZHOU Z Y, LI J S, et al. The purification effects of infiltrative dams on urban initial rainwater[J]. Journal of Environmental Engineering Technology,2019,9(3):282-285. [22] 代丹, 于涛, 雷坤, 等. 北京市清河水体非点源污染特征[J]. 环境科学研究,2018,31(6):1068-1077.DAI D, YU T, LEI K, et al. Characteristics of non-point source pollution of Qinghe River in Beijing City[J]. Research of Environmental Sciences,2018,31(6):1068-1077. [23] 王书敏, 郭树刚, 何强, 等. 城市流域降雨径流水质特性及初期冲刷现象[J]. 环境科学研究,2015,28(4):532-539.WANG S M, GUO S G, HE Q, et al. Water quality characteristics of stormwater runoff and the first flush effect in urban regions[J]. Research of Environmental Sciences,2015,28(4):532-539. [24] DELETIC A. The first flush load of urban surface runoff[J]. Water Research,1998,32(8):2462-2470. doi: 10.1016/S0043-1354(97)00470-3 [25] 李俊奇, 孙梦琪, 李小静, 等. 生物滞留设施对雨水径流热污染控制效果试验[J]. 水资源保护,2022,38(4):6-12.LI J Q, SUN M Q, LI X J, et al. Experimental study on thermal pollution control of stormwater runoff by bioretention[J]. Water Resources Protection,2022,38(4):6-12. [26] 徐玮曈, 王建龙, 武彦杰, 等. 雨水花园对雨水径流热污染控制效果试验研究[J]. 水利水电技术,2020,51(9):162-167.XU W T, WANG J L, WU Y J, et al. Immigration of thermal pollution from stormwater runoff via rain garden[J]. Water Resources and Hydropower Engineering,2020,51(9):162-167. [27] 李俊奇, 张珊, 李小静, 等. 雨水径流热污染的危害及控制策略分析[J]. 环境工程,2020,38(4):32-38.LI J Q, ZHANG S, LI X J, et al. A study on the harm and control countermeasures of thermal pollution from stormwater runoff[J]. Environmental Engineering,2020,38(4):32-38. [28] JONES M P, HUNT W F. Bioretention impact on runoff temperature in trout sensitive waters[J]. Journal of Environmental Engineering,2009,135(8):577-585. doi: 10.1061/(ASCE)EE.1943-7870.0000022 [29] WANG J L, WANG X T, XU W T, et al. Characteristics of thermal pollution from stormwater runoff from impermeable/permeable pavement surfaces via a lab-scale experiment[J]. Journal of Environmental Management,2023,325:116484. doi: 10.1016/j.jenvman.2022.116484 [30] KINZER G D, GUNN R. The evaporation, temperature and thermal relaxation-time of freely falling waterdrops[J]. Journal of Meteorology,1951,8(2):71-83. doi: 10.1175/1520-0469(1951)008<0071:TETATR>2.0.CO;2 [31] KERTESZ R, SANSALONE J. Hydrologic transport of thermal energy from pavement[J]. Journal of Environmental Engineering,2014,140(8):04014028. doi: 10.1061/(ASCE)EE.1943-7870.0000831 [32] PICKSLEY W, DELETIC A. The thermal enrichment of storm runoff from paved areas: a statistical analysis[J/OL]. Journal of Water Management Modeling, 1999. doi: 10.14796/JWMM.R204-07. ◇ -

 下载:
下载:


 点击查看大图
计量
- 文章访问数: 86
- HTML全文浏览量: 27
- PDF下载量: 19
- 被引次数: 0