

Inventory and spatiotemporal distribution characteristics of greenhouse gas emissions from vehicles on expressways in Kunming City
-
摘要:
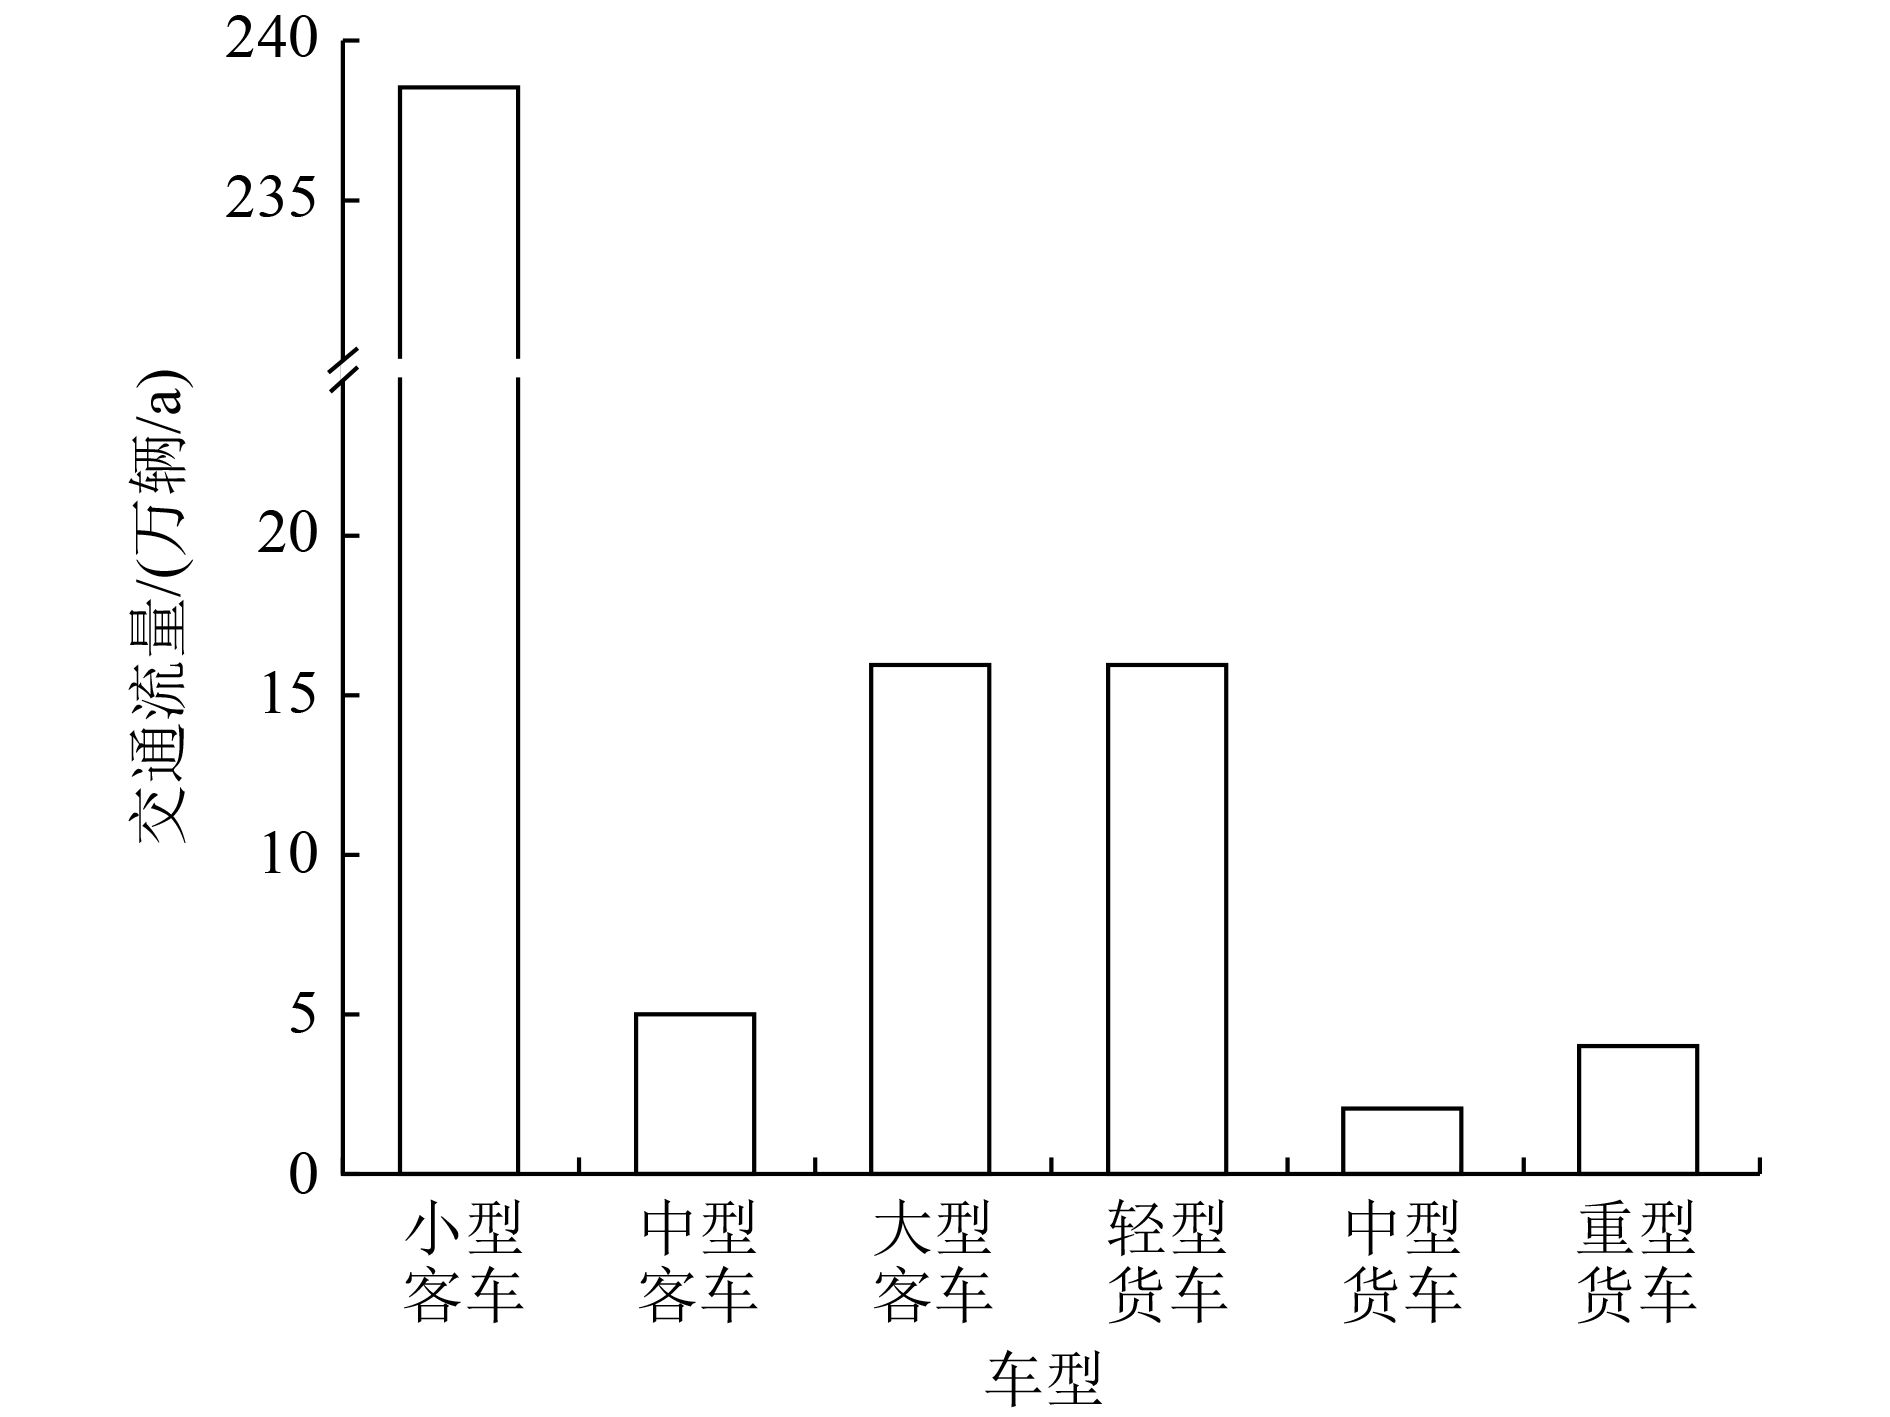
为研究昆明市高速公路机动车的CO、CO2、N2O、CH4温室气体排放清单,使用2021年昆明市高速公路客车交通流量数据、机动车GPS信息数据获得了高速公路网上的车型构成、车流量等基础数据,应用本土化修正后MOVES模型计算了昆明市高速公路的机动车CO、CO2、N2O、CH4排放因子。基于实际交通流量数据、温室气体排放因子和昆明市高速公路实际道路信息,构建了昆明市高速公路机动车温室气体排放清单,并对其排放特征以及空间分布特征进行分析。结果表明:昆明市2021年高速公路机动车CO、CO2、N2O和CH4的排放量分别为20 337.1、2 575 677.1、33.8和72.9 t,总计CO2当量为2 626 212.5 t。按排放标准划分,国Ⅳ排放标准的机动车是4种温室气体排放的主要贡献车型;按车辆类型划分,小型客车是CO、CO2、N2O排放的主要贡献车型,大型客车是CH4排放的主要贡献车型;按燃料类型划分,汽油车是CO、CO2、N2O的主要贡献车型,柴油车是CH4排放的主要贡献车型。昆明市高速公路机动车温室气体排放时间分布特征为排放强度与不同时间段的交通流量呈正相关,在24 h内呈现双高峰变化;空间分布特征为排放强度与路网密度和区域交通流量密切相关,路网密度较高和交通流量较高的区域排放强度较高。
Abstract:In order to study the emission inventory of greenhouse gases (GHGs) such as CO, CO2, N2O and CH4 from motor vehicles on expressways in Kunming City, the expressway passenger traffic flow data and vehicle GPS information data in Kunming City in 2021 were used to obtain the basic data such as vehicle type composition and vehicle flow on the expressway network. The localized modified MOVES model was applied to calculate the emission factors of CO, CO2, N2O and CH4 of vehicles on the expressways. Based on the actual traffic flow data, GHG emission factors and the actual road information of expressways, the GHG emission inventory of the expressways in Kunming City was constructed, and its emission characteristics and spatial distribution characteristics were analyzed. The results showed that the emissions of CO, CO2, N2O and CH4 from expressway vehicles in Kunming City in 2021 were 20 337.1, 2 575 677.1, 33.8 and 72.9 t, respectively, with a total CO2 equivalent of 2 626 212.5 t. According to emission standards, the vehicles with national stage Ⅳ emission standards were the main contributors to the four types of GHG emissions. According to vehicle types, passenger cars were the main contribution models to CO, CO2 and N2O emissions, while large buses were the main contribution models to CH4 emissions. Divided by fuel type, gasoline vehicles were the main contribution models of CO, CO2 and N2O, while diesel vehicles were the main contribution models of CH4 emission. The temporal distribution characteristics showed that the emission intensity had a positive correlation with the traffic flow in different time periods, and the GHG emission intensity of motor vehicles on expressways in Kunming City showed a "bimodal" change within 24 h. The spatial distribution of emission intensity was closely related to road network density and regional traffic flow. The region with higher road network density and higher traffic flow had higher emission intensity.
-

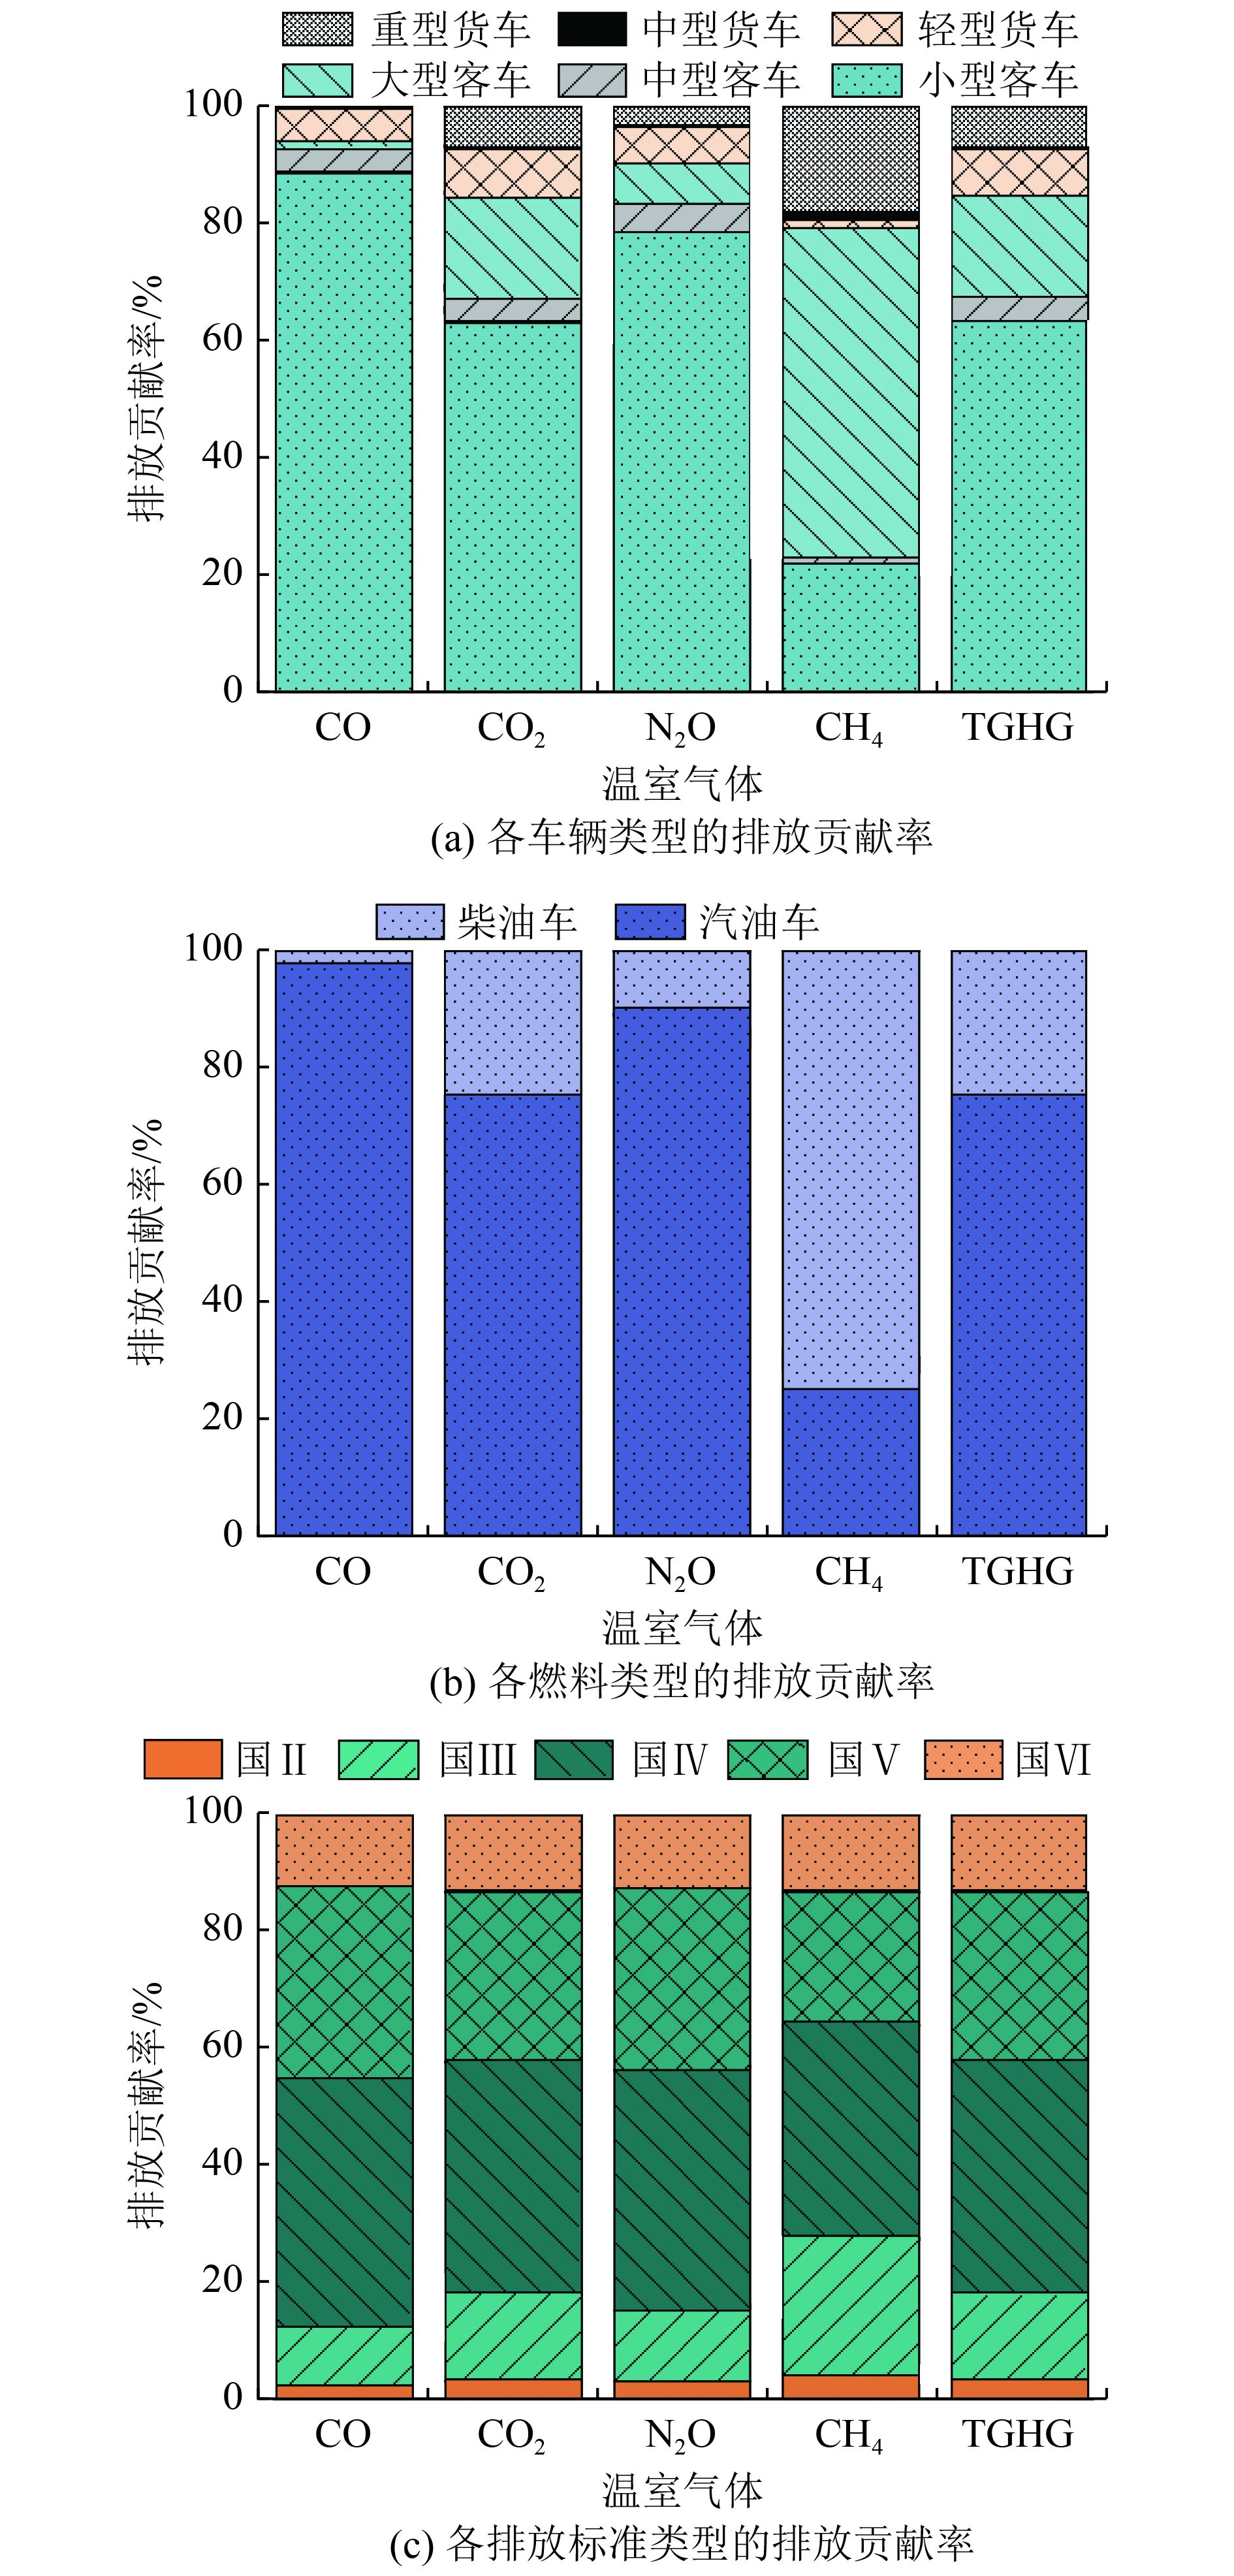
图 3 按3种类型划分的温室气体排放贡献率
注:TGHG为CO、CO2、N2O、CH4这4种温室气体的排放总量。
Figure 3. Contribution rate of greenhouse gas emission divided by three types

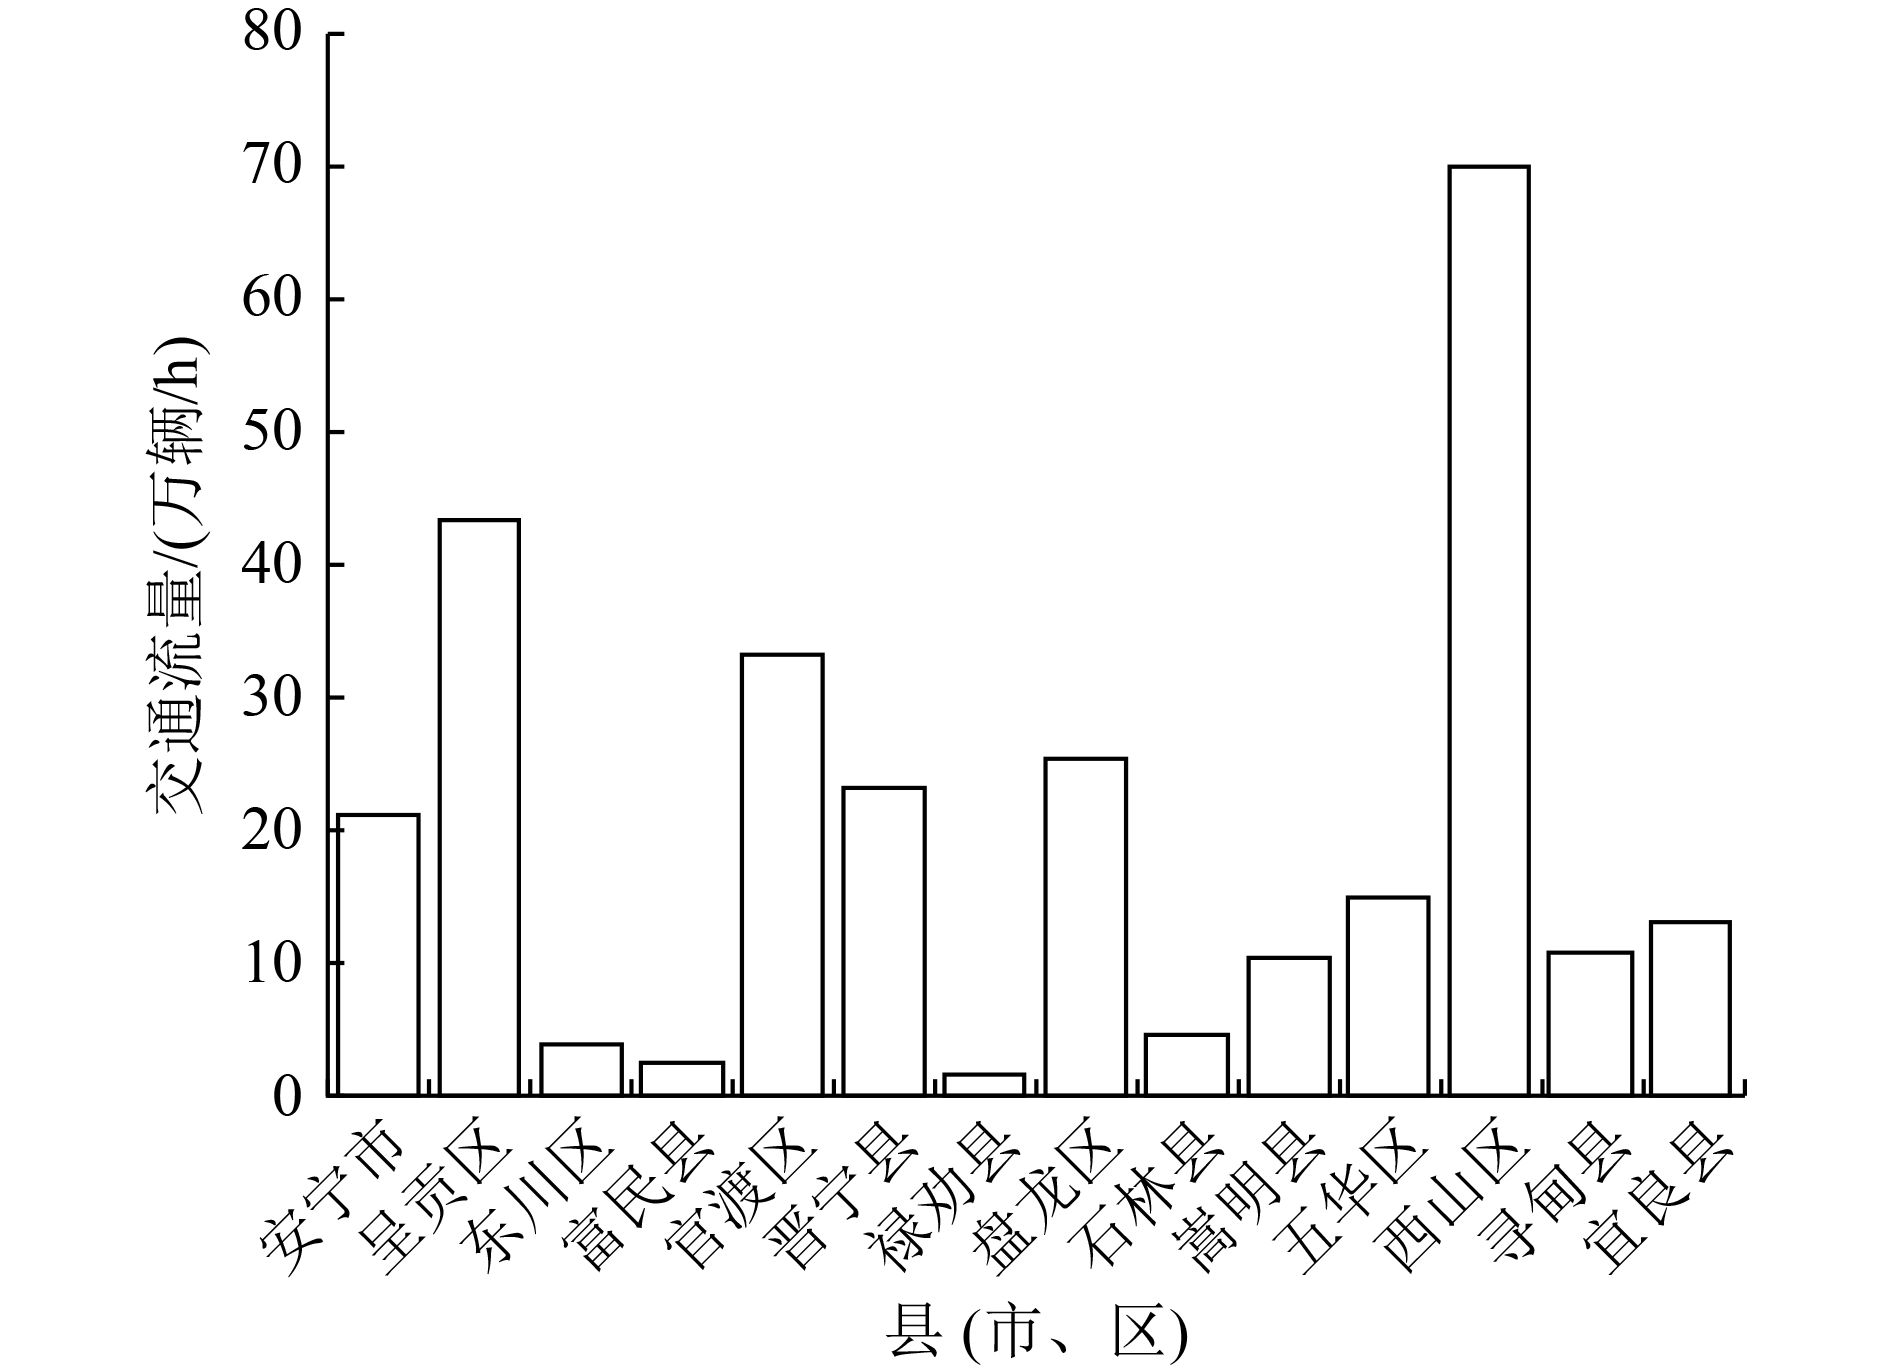
图 4 高速公路交通流量及温室气体排放总量时间层面分布特征
Figure 4. Distribution characteristics of total greenhouse gas emissions and expressway traffic flow at time level

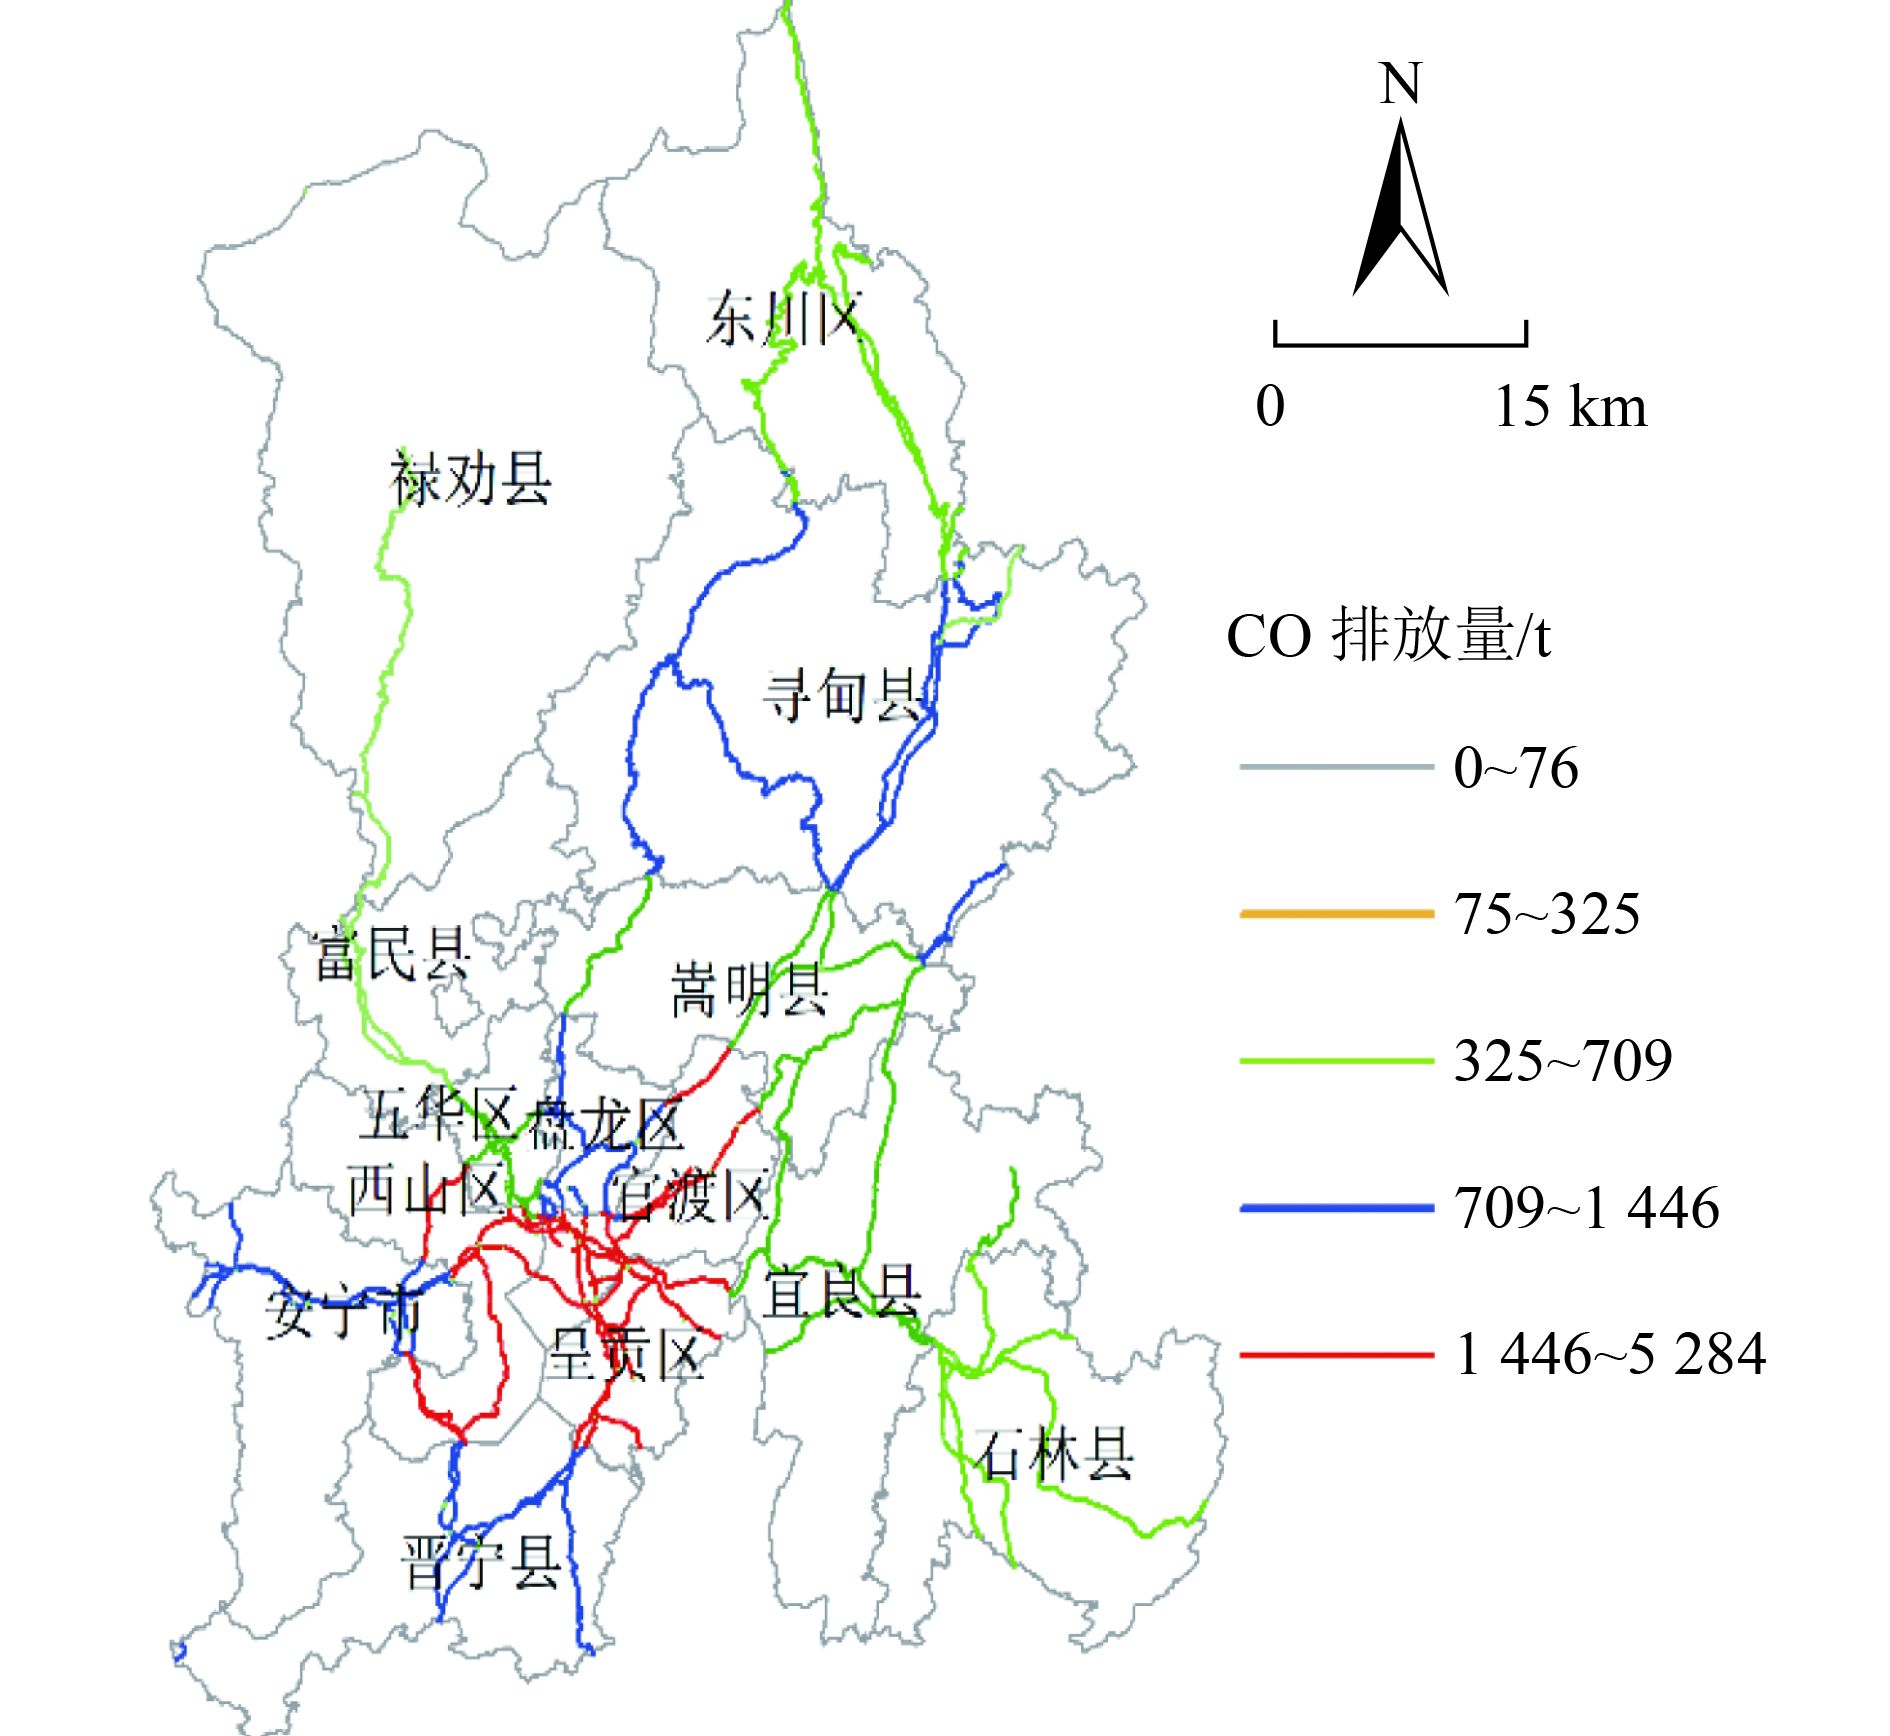
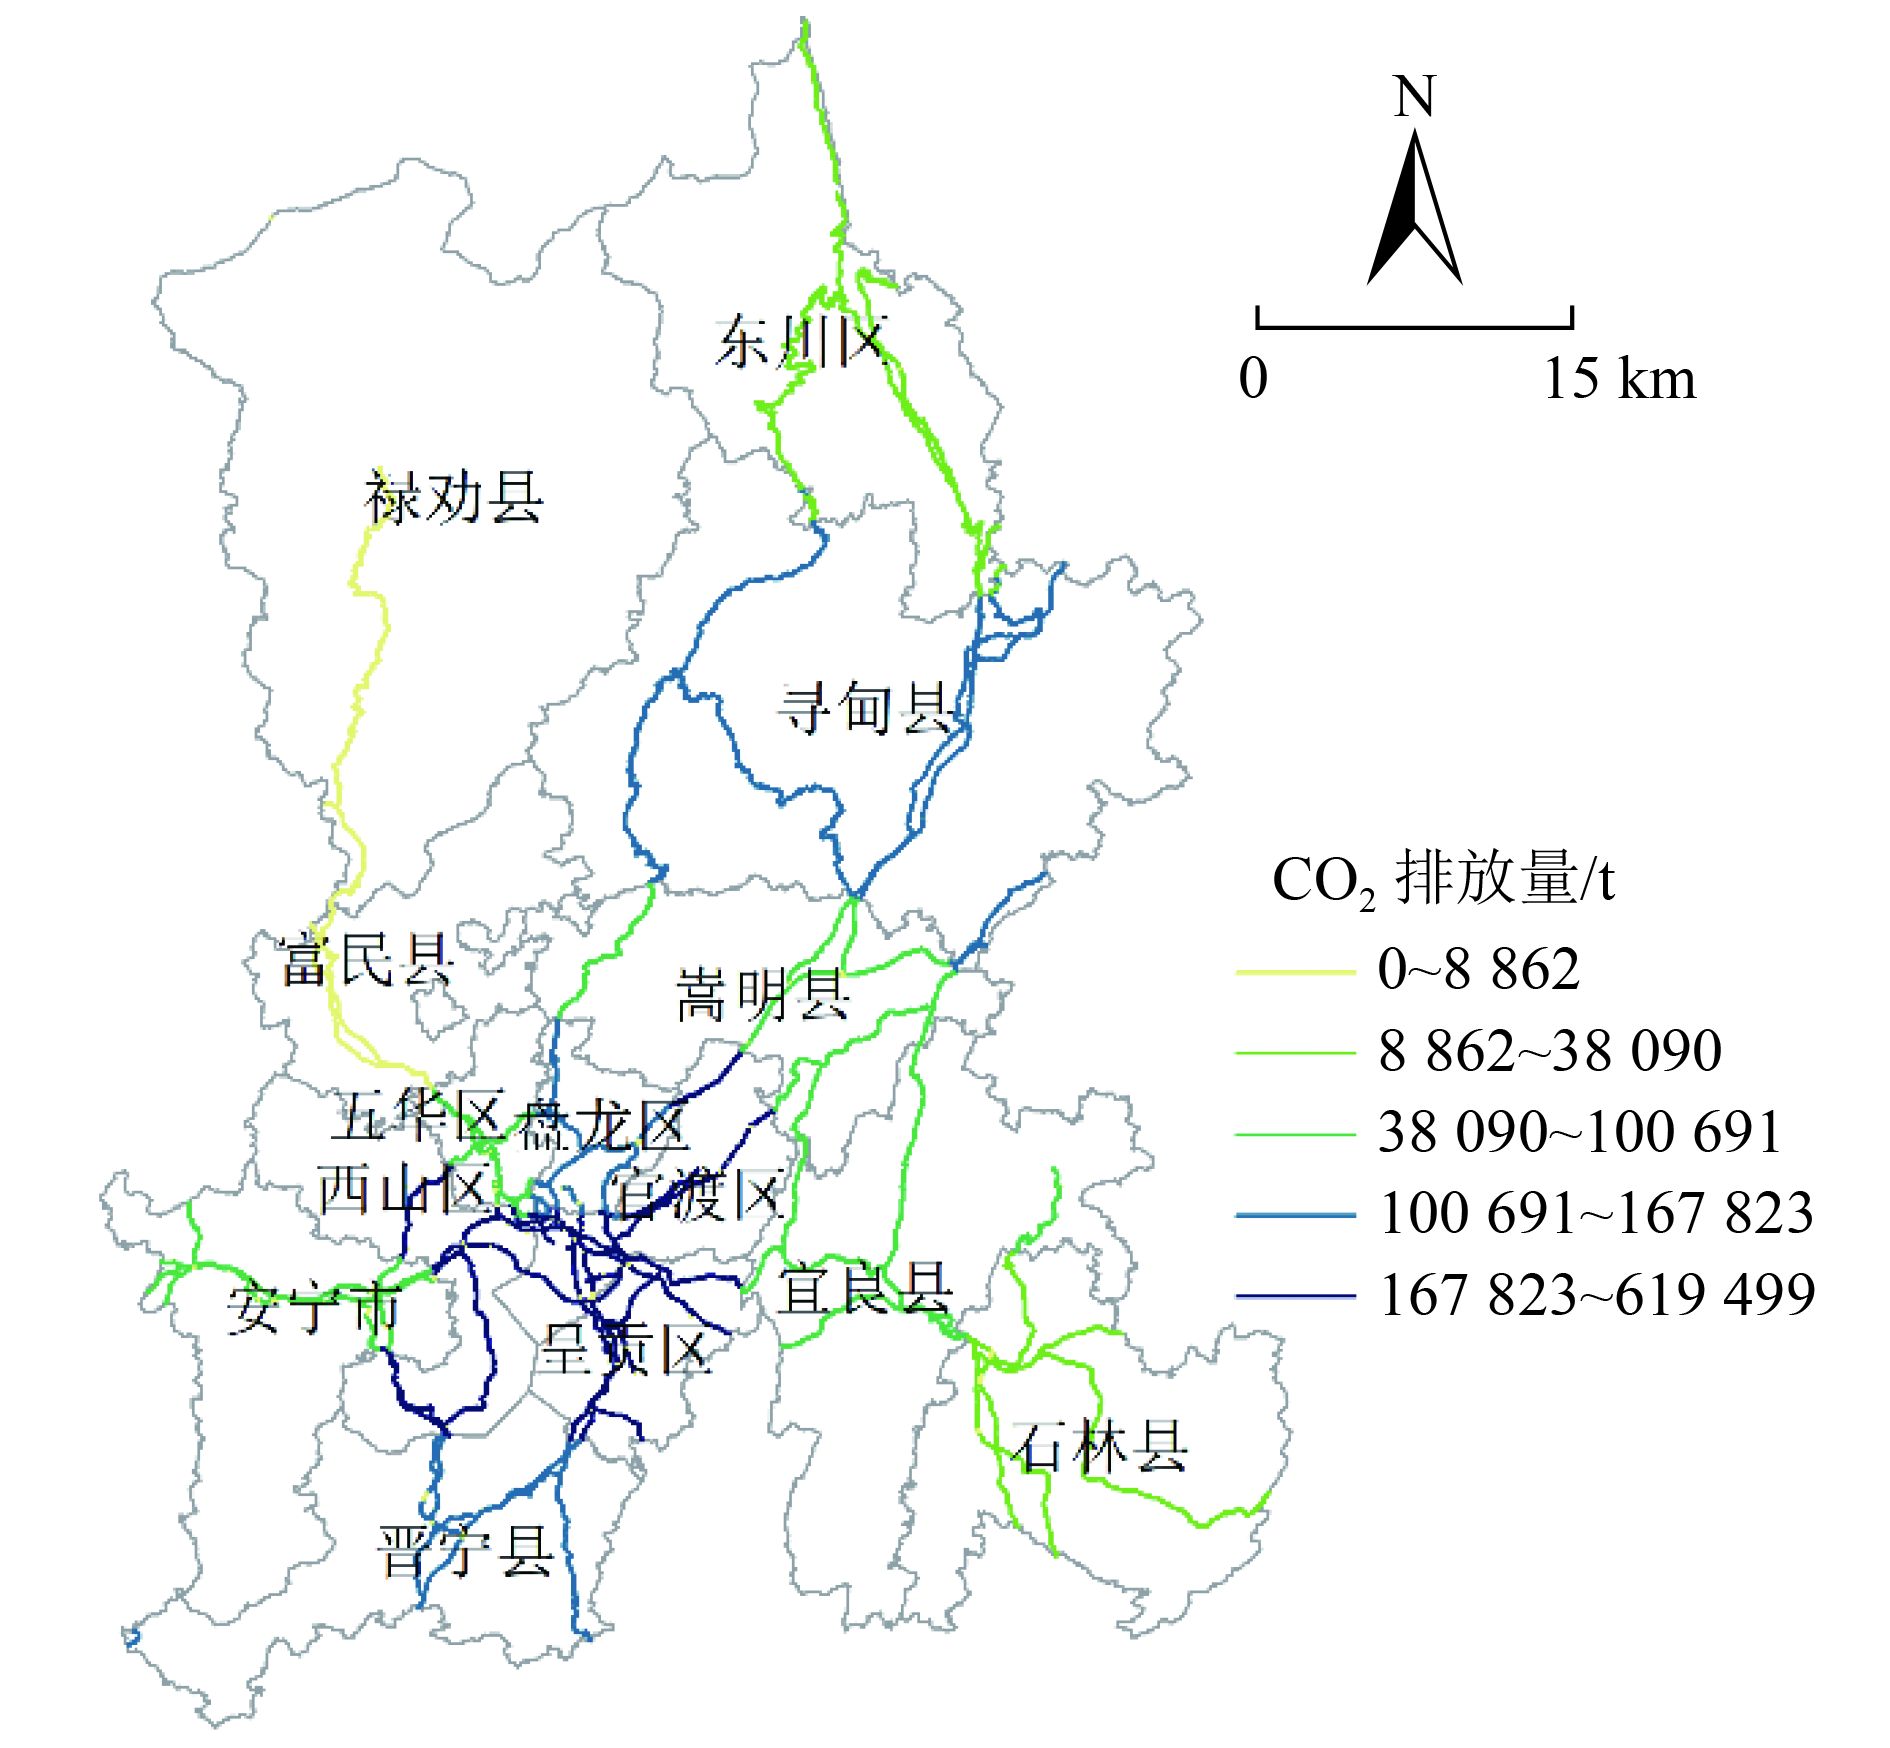
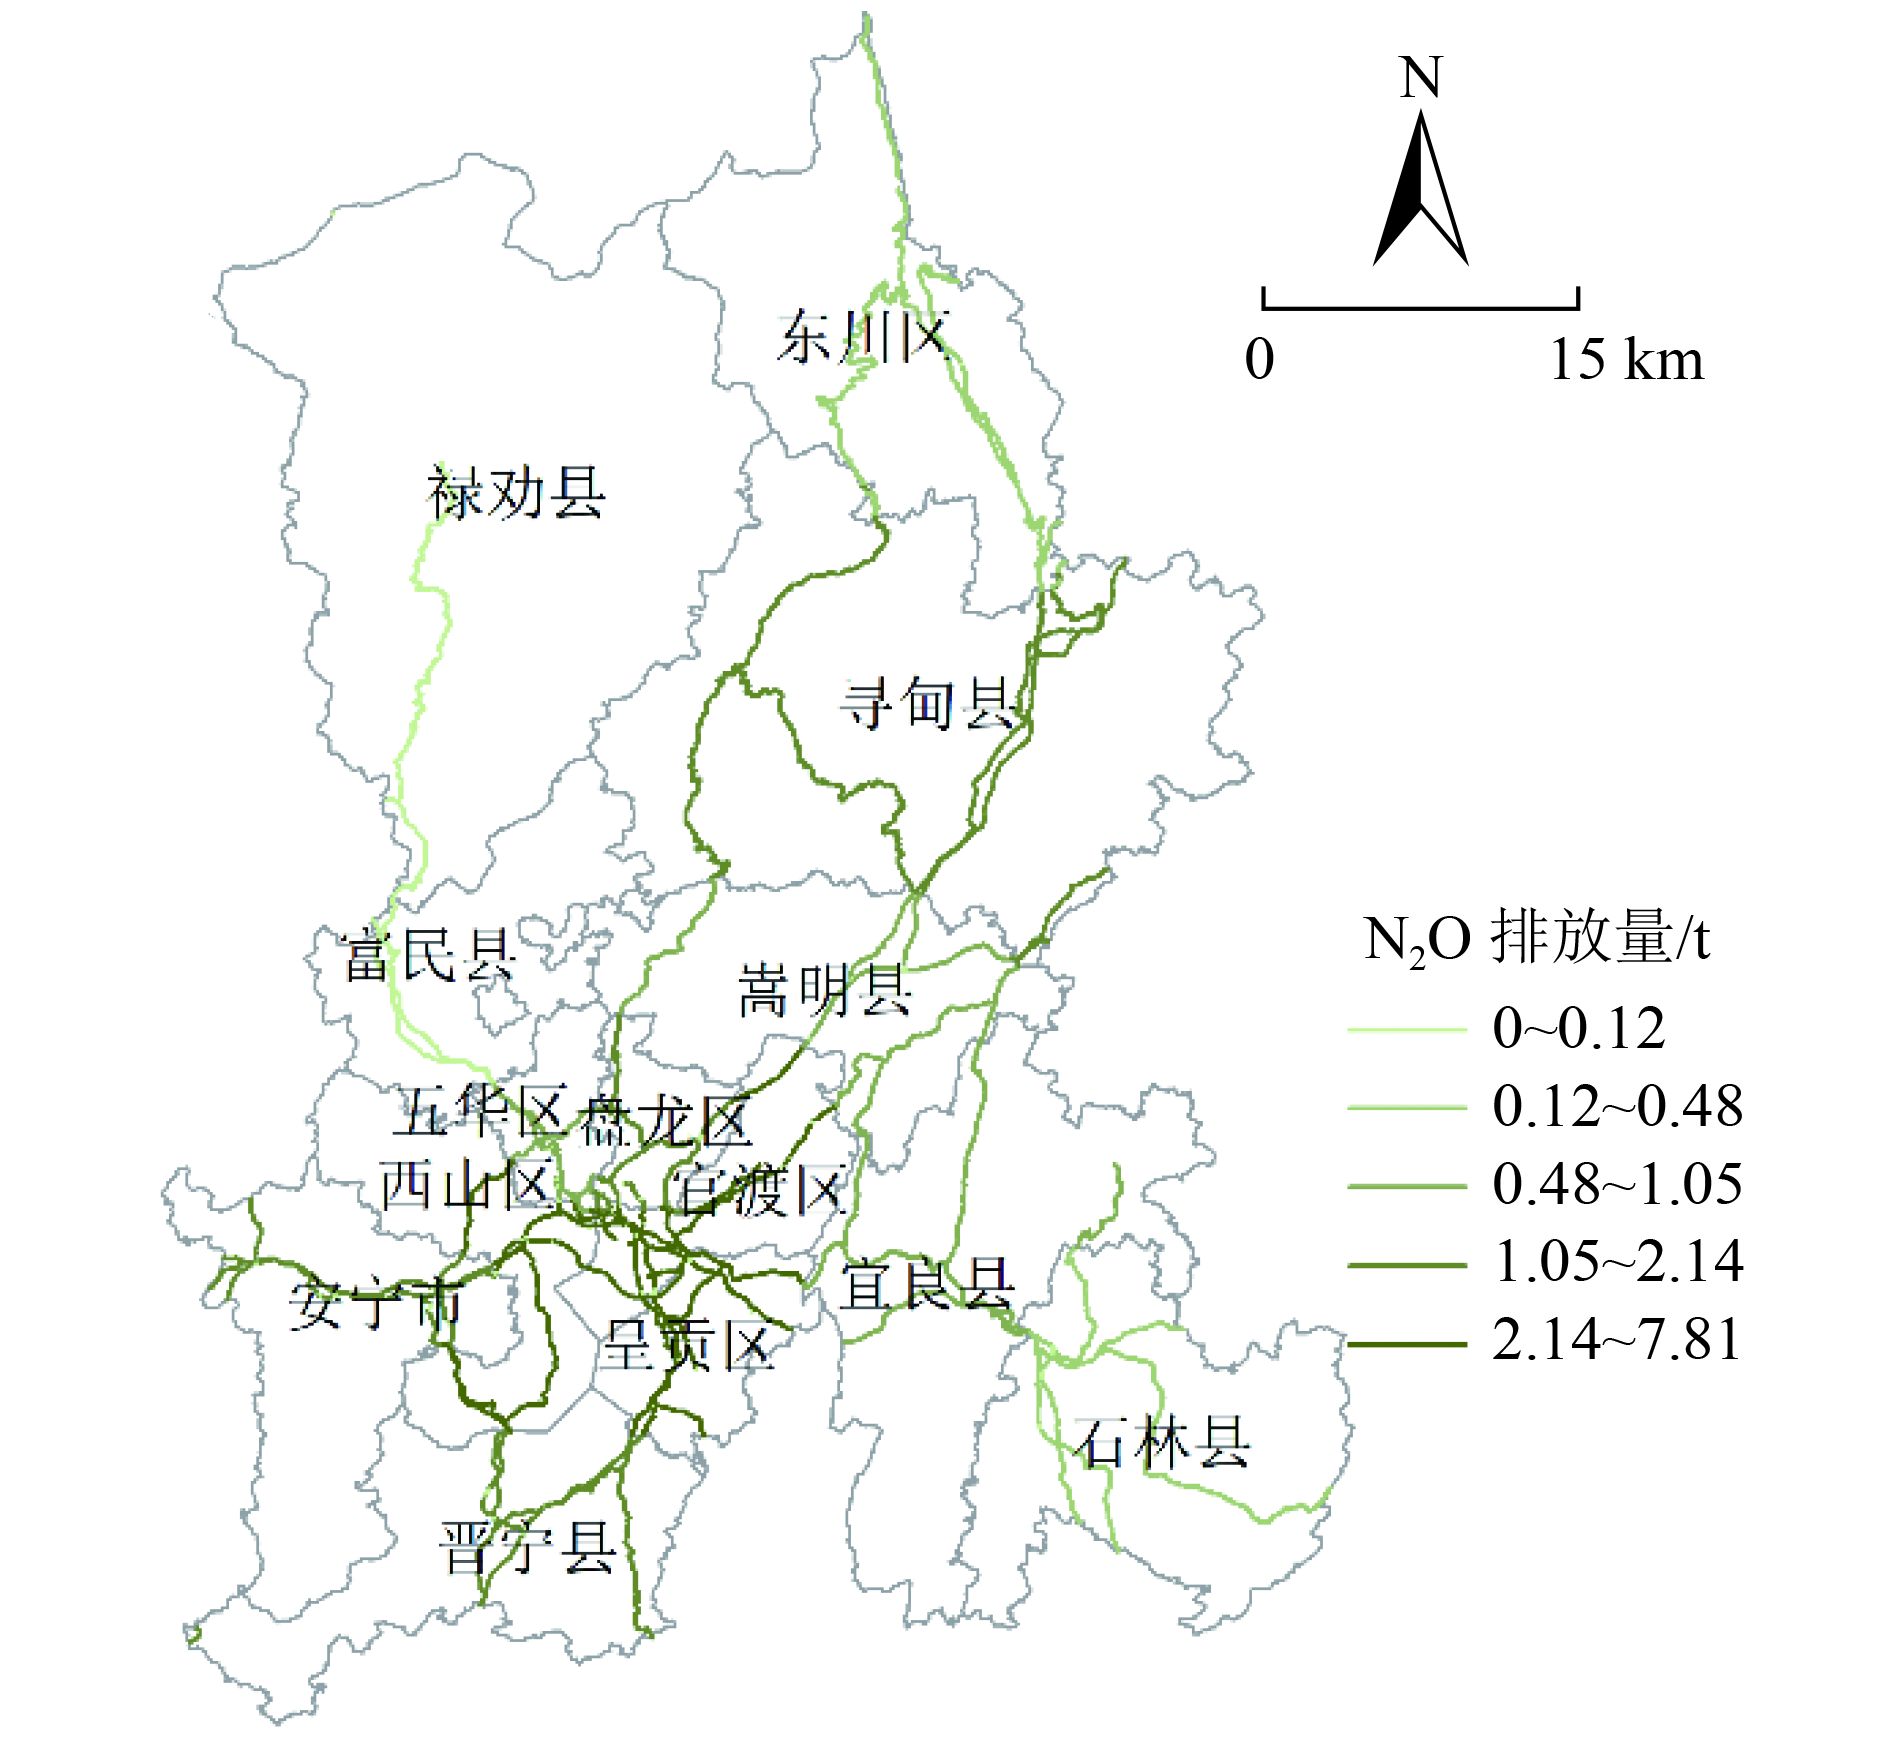
图 6 CO排放量空间分配
注:底图源自云南省地理信息公共服务平台(
https://yunnan.tianditu.gov.cn/MapResource )下载的《昆明市地图1∶87.5万》,审图号为云S(2021)63号。全文同。Figure 6. Spatial distribution map of total CO emissions
表 1 昆明市每月平均气温及相对湿度
Table 1. Monthly mean temperature and relative humidity in Kunming City
月份 平均气温/℃ 相对湿度/% 1 7.4 70.3 2 10.7 61.3 3 15.2 42.0 4 17.3 53.7 5 20.2 59.1 6 19.4 76.7 7 19.4 81.8 8 19.8 80.6 9 18.7 75.2 10 19.3 76.0 11 10.5 78.6 12 15.2 70.5  下载: 导出CSV
表 2 车型对照
Table 2. Vehicle comparison table
本研究车型 MOVES选取车型 客一(小型客车) passenger car 客二(中型客车) transit bus 客三、客四(大型客车) intercity bus 轻型货车 passenger truck 中型货车 light commercial truck 重型货车 combination long-haul truck
下载: 导出CSV
表 3 不同排放标准的机动车占比
Table 3. The proportion of motor vehicles according to emission standards
% 车型 燃料类型 车辆占比 国Ⅰ 国Ⅱ 国Ⅲ 国Ⅳ 国Ⅴ 国Ⅵ 小型客车 汽油 — 1.6 8.2 42.4 35.1 12.7 中型客车 汽油 — 14.2 32.4 53.4 — — 大型客车 柴油 — 3.5 26.0 38.3 21.9 10.3 轻型货车 汽油 — 6.9 14.4 37.6 20.2 20.9 中型货车 柴油 — 44.3 40.8 14.9 — — 重型货车 柴油 — 5.4 35.0 23.7 11.1 24.8 注:—表示无占有率。
下载: 导出CSV
表 4 燃料参数
Table 4. Fuel parameters
燃油
类别雷德蒸汽
压/kPa硫含量百
分比/%烃含量百
分比/%芳烃含量
百分比/%十六
烷值多环芳烃
含量百
分比/%汽油 64.8 10 18 35 0 0 柴油 0 10 0 0 46 7
下载: 导出CSV
表 5 昆明市及其他地区的机动车温室气体排放因子
Table 5. Greenhouse gas emission factors of motor vehicles in Kunming City and some cities
g/(km·辆) 城市 模型 年份 车型 平均排放因子 数据来源 CO CO2 N2O CH4 昆明市 MOVES 2021 小型客车 2.517 227.166 0.003 0.002 本研究 中型客车 6.583 814.881 0.012 0.006 大型客车 0.600 930.209 0.004 0.084 轻型货车 2.217 437.831 0.004 0.002 中型货车 1.249 599.602 0.004 0.042 重型货车 0.830 1669.190 0.006 0.122 渭南市 MOVES 2019 小型客车 2.799 318.741 0.008 0.010 文献[7] 中型客车 6.248 781.236 0.011 0.024 大型客车 1.892 961.717 0.015 0.568 轻型货车 2.799 468.552 0.009 0.021 中型货车 2.576 790.832 0.004 0.019 重型货车 2.307 1324.703 0.002 0.075 渭南市 MOVES 2018 小型客车 2.818 — — 0.041 文献[32] 中型客车 5.372 — — 0.019 大型客车 1.738 — — 0.112 轻型货车 3.646 — — 0.063 中型货车 2.900 — — 0.125 重型货车 2.026 — — 0.008 关中城市群 MOVES 2019 小型客车 — — 0.007 0.016 文献[33] 中型客车 — — 0.013 0.019 大型客车 — — 0.011 0.011 轻型货车 — — 0.009 0.018 中型货车 — — 0.009 0.015 重型货车 — — 0.005 0.018 注:—表示无数据。
下载: 导出CSV
表 6 昆明市高速公路温室气体排放清单
Table 6. Greenhouse gas emission inventory of expressways in Kunming City
t 车型 排放量 CO CO2 N2O CH4 CO2当量 小型客车 18 064.2 1 630 366.1 25.5 16.1 1 672 689.6 中型客车 809.3 100 180.2 2.2 1.2 102 403.5 大型客车 288.1 447 053.1 2.4 40.2 449 320.7 轻型货车 1 066.2 210 478.1 2.3 1.1 213 216.8 中型货车 20.2 9 588.2 0.1 1.2 9 686.4 重型货车 89.1 178 011.4 1.3 13.1 178 895.6 总计 20 337.1 2 575 677.1 33.8 72.9 2 626 212.5
下载: 导出CSV
-
[1] DEY S, CAULFIELD B, GHOSH B. Modelling uncertainty of vehicular emissions inventory: a case study of Ireland[J]. Journal of Cleaner Production,2019,213:1115-1126. doi: 10.1016/j.jclepro.2018.12.125 [2] YANG W, YU C Y, YUAN W, et al. High-resolution vehicle emission inventory and emission control policy scenario analysis, a case in the Beijing-Tianjin-Hebei (BTH) region, China[J]. Journal of Cleaner Production,2018,203:530-539. doi: 10.1016/j.jclepro.2018.08.256 [3] SUN S D, SUN L N, LIU G, et al. Developing a vehicle emission inventory with high temporal-spatial resolution in Tianjin, China[J]. Science of the Total Environment,2021,776:145873. doi: 10.1016/j.scitotenv.2021.145873 [4] 李珂, 王燕军, 王涛, 等.乌鲁木齐市机动车排放清单研究[J]. 环境科学研究,2010,23(4):407-412.LI K, WANG Y J, WANG T, et al. Vehicle pollution emission inventory research in Urumqi City[J]. Research of Environmental Sciences,2010,23(4):407-412. [5] 单臣玉, 崔耀东, 程志, 等.2013年银川市机动车温室气体排放清单[J]. 宁夏工程技术,2016,15(2):171-175.SHAN C Y, CUI Y D, CHENG Z, et al. Greenhouse gas emission inventory for motor vehicles in Yinchuan in 2013[J]. Ningxia Engineering Technology,2016,15(2):171-175. [6] 沈岩, 武彤冉, 闫静, 等.基于COPERT模型北京市机动车大气污染物和二氧化碳排放研究[J]. 环境工程技术学报,2021,11(6):1075-1082.SHEN Y, WU T R, YAN J, et al. Investigation on air pollutants and carbon dioxide emissions from motor vehicles in Beijing based on COPERT model[J]. Journal of Environmental Engineering Technology,2021,11(6):1075-1082. [7] 李光华, 高健, 邓顺熙, 等.渭南市道路移动源高分辨温室气体排放清单及特征研究[J]. 环境科学学报,2022,42(12):332-340.LI G H, GAO J, DENG S X, et al. A study on high temporal-spatial resolution emission inventory and its characteristics of greenhouse gas for on-road mobile source in Weinan, China[J]. Acta Scientiae Circumstantiae,2022,42(12):332-340. [8] 吕晨. 北京市高分辨率交通碳排放清单研究与低碳发展情景分析[D]. 北京: 北京工业大学, 2020. [9] 唐伟, 何平, 杨强, 等.基于IVE模型和大数据分析的杭州市道路移动源主要温室气体排放清单研究[J]. 环境科学学报,2018,38(4):1368-1376.TANG W, HE P, YANG Q, et al. Study on greenhouse gas emission inventory of road source in Hangzhou based on IVE model and large data analysis[J]. Acta Scientiae Circumstantiae,2018,38(4):1368-1376. [10] 汪晶发, 宋慧, 巴利萌, 等.西安市机动车污染物排放清单与空间分布特征[J]. 环境污染与防治,2020,42(6):666-671.WANG J F, SONG H, BA L M, et al. Study on the vehicle emission inventory and spatial distribution characteristics in Xi'an[J]. Environmental Pollution and Control,2020,42(6):666-671. [11] GANJI A, SHEKARRIZFARD M, HARPALANI A, et al. Methodology for spatio-temporal predictions of traffic counts across an urban road network and generation of an on-road greenhouse gas emission inventory[J]. Computer-Aided Civil and Infrastructure Engineering,2020,35(10):1063-1084. doi: 10.1111/mice.12508 [12] 王淳. 广东省高速公路网汽车排放时空特征研究[D]. 广州: 华南理工大学, 2020. [13] 陆雅静, 倪爽英, 王洪华, 等.河北省国道和省道机动车基于交通流量的尾气排放量估算[J]. 环境科学学报,2020,40(12):4483-4491.LU Y J, NI S Y, WANG H H, et al. Estimation of vehicle emission based on traffic flow on national and provincial roads in Hebei Province[J]. Acta Scientiae Circumstantiae,2020,40(12):4483-4491. [14] 高丹丹, 尹沙沙, 谷幸珂, 等.河南省2016—2019年机动车大气污染物排放清单及特征[J]. 环境科学,2021,42(8):3663-3675.GAO D D, YIN S S, GU X K, et al. Vehicle air pollutant emission inventory and characterization in Henan Province from 2016 to 2019[J]. Environmental Science,2021,42(8):3663-3675. [15] 邹泽耀, 郑鑫程, 徐崇敏, 等.疫情背景下的福建省高速公路机动车污染物排放清单[J]. 环境科学学报,2022,42(5):119-128.ZOU Z Y, ZHENG X C, XU C M, et al. Fujian Province highway motor vehicle pollutant emission inventory under the background of the COVID-19[J]. Acta Scientiae Circumstantiae,2022,42(5):119-128. [16] ABOU-SENNA H, RADWAN E, WESTERLUND K, et al. Using a traffic simulation model (VISSIM) with an emissions model (MOVES) to predict emissions from vehicles on a limited-access highway[J]. Journal of the Air & Waste Management Association (1995),2013,63(7):819-831. [17] LI Y X, LV C, YANG N, et al. A study of high temporal-spatial resolution greenhouse gas emissions inventory for on-road vehicles based on traffic speed-flow model: a case of Beijing[J]. Journal of Cleaner Production,2020,277:122419. doi: 10.1016/j.jclepro.2020.122419 [18] 李丽, 刘永红, 邓思欣, 等.基于动态交通流的佛山市机动车网格化排放清单[J]. 中山大学学报(自然科学版),2017,56(2):66-75.LI L, LIU Y H, DENG S X, et al. Gridding emission inventory of vehicle exhaust in Foshan based on dynamic traffic flow information[J]. Acta Scientiarum Naturalium Universitatis Sunyatseni,2017,56(2):66-75. [19] 张国欣, 卢昱寰, 韩素, 等.基于交通大数据的机动车尾气动态排放清单的研制: 以广州内环为例[J]. 环境污染与防治,2018,40(6):723-727.ZHANG G X, LU Y H, HAN S, et al. Development of dynamic vehicle exhaust emission inventory based on traffic big data: a case study of Guangzhou inner ring[J]. Environmental Pollution and Control,2018,40(6):723-727. [20] 解淑霞, 黄志辉, 王鑫, 等.阳泉市2017年基于交通流量的机动车排放清单[J]. 环境工程技术学报,2021,11(2):226-233.XIE S X, HUANG Z H, WANG X, et al. Emission inventory of motor vehicle based on traffic flow for Yangquan City in 2017[J]. Journal of Environmental Engineering Technology,2021,11(2):226-233. [21] 王凯, 樊守彬, 孙改红, 等.基于行驶里程的北京市延庆区机动车排放清单建立及特征分析[J]. 环境工程技术学报,2019,9(2):119-125.WANG K, FAN S B, SUN G H, et al. Motor vehicles emission inventory at County level based on vehicle kilometers travel: a case study of Yanqing District of Beijing[J]. Journal of Environmental Engineering Technology,2019,9(2):119-125. [22] 李永锋, 马杰, 王胜蓝, 等.重庆市典型道路机动车排放NO2污染特征[J]. 环境工程技术学报,2022,12(5):1601-1608.LI Y F, MA J, WANG S L, et al. Research on the pollution characteristics of NO2 emitted by motor vehicles on typical roads in Chongqing[J]. Journal of Environmental Engineering Technology,2022,12(5):1601-1608. [23] 王燕军, 何巍楠, 宋国华, 等.北京市2017年典型日机动车动态排放特征研究[J]. 环境科学研究,2021,34(1):141-148.WANG Y J, HE W N, SONG G H, et al. Vehicular dynamic emission characteristics of typical days in Beijing in 2017[J]. Research of Environmental Sciences,2021,34(1):141-148. [24] LEI J S, YANG C, FU Q Y, et al. An approach of localizing MOVES to estimate emission factors of trucks[J/OL]. International Journal of Transportation Science and Technology, 2023. [2023-03-20].https://doi.org/10.1016/j.ijtst.2023.02.002. [25] LIU H B, CHEN X H, WANG Y Q, et al. Vehicle emission and near-road air quality modeling for Shanghai, China[J]. Transportation Research Record:Journal of the Transportation Research Board,2013,2340(1):38-48. doi: 10.3141/2340-05 [26] KALL D, JACKSON D J, PERLMAN J. Using MOVES to conduct greenhouse gas inventory for on-road mobile sources in northern new jersey region[EB/OL]. [2023-03-20]. https://www.semanticscholar.org/paper/Using-MOVES-to-Conduct-Greenhouse-Gas-Inventory-for-Kall-Jackson/90a739be781b8c0ef9a659abf2cf1095a6c8b30e.html. [27] XU X D, LIU H B, ANDERSON J M, et al. Estimating project-level vehicle emissions with vissim and MOVES-matrix[J]. Transportation Research Record:Journal of the Transportation Research Board,2016,2570(1):107-117. doi: 10.3141/2570-12 [28] 林晓芳, 徐伟嘉, 刘永红, 等.广东省车辆存活概率曲线及规律[J]. 中山大学学报(自然科学版),2019,58(1):65-73. doi: 10.13471/j.cnki.acta.snus.2019.01.008LIN X F, XU W J, LIU Y H, et al. Survival probability pattern and its influencing factors of vehicles in Guangdong Province[J]. Acta Scientiarum Naturalium Universitatis Sunyatseni,2019,58(1):65-73. doi: 10.13471/j.cnki.acta.snus.2019.01.008 [29] 国家质量监督检验检疫总局, 国家标准化管理委员会. 车用汽油: GB 17930—2016[S]. 北京: 中国标准出版社, 2016. [30] 国家质量监督检验检疫总局, 国家标准化管理委员会. 车用柴油: GB 19147—2016[S]. 北京: 中国标准出版社, 2016. [31] 何立强, 胡京南, 解淑霞, 等.2010年中国机动车CH4和N2O排放清单[J]. 环境科学研究,2014,27(1):28-35.HE L Q, HU J N, XIE S X, et al. CH4 and N2O emission inventory for motor vehicles in China in 2010[J]. Research of Environmental Sciences,2014,27(1):28-35. [32] 张雅瑞, 李光华, 邓顺熙, 等.渭南市道路移动源高分辨污染物排放清单及特征研究[J]. 环境科学学报,2022,42(2):332-340.ZHANG Y R, LI G H, DENG S X, et al. A study of high temporal-spatial resolution vehicle emission inventory and its characteristics of on-road mobile source in Weinan, China[J]. Acta Scientiae Circumstantiae,2022,42(2):332-340. [33] 陶双成, 邓顺熙, 郝艳召, 等.关中城市群道路移动源气态污染物排放特征[J]. 中国环境科学,2019,39(2):542-553.TAO S C, DENG S X, HAO Y Z, et al. Vehicle emission characteristics of gaseous pollutants in Guanzhong urban agglomeration[J]. China Environmental Science,2019,39(2):542-553. □ -

 下载:
下载:


 点击查看大图
计量
- 文章访问数: 184
- HTML全文浏览量: 56
- PDF下载量: 43
- 被引次数: 0