

Research on air pollution characteristics and influencing factors of typical urban road traffic densified monitoring stations
-
摘要:
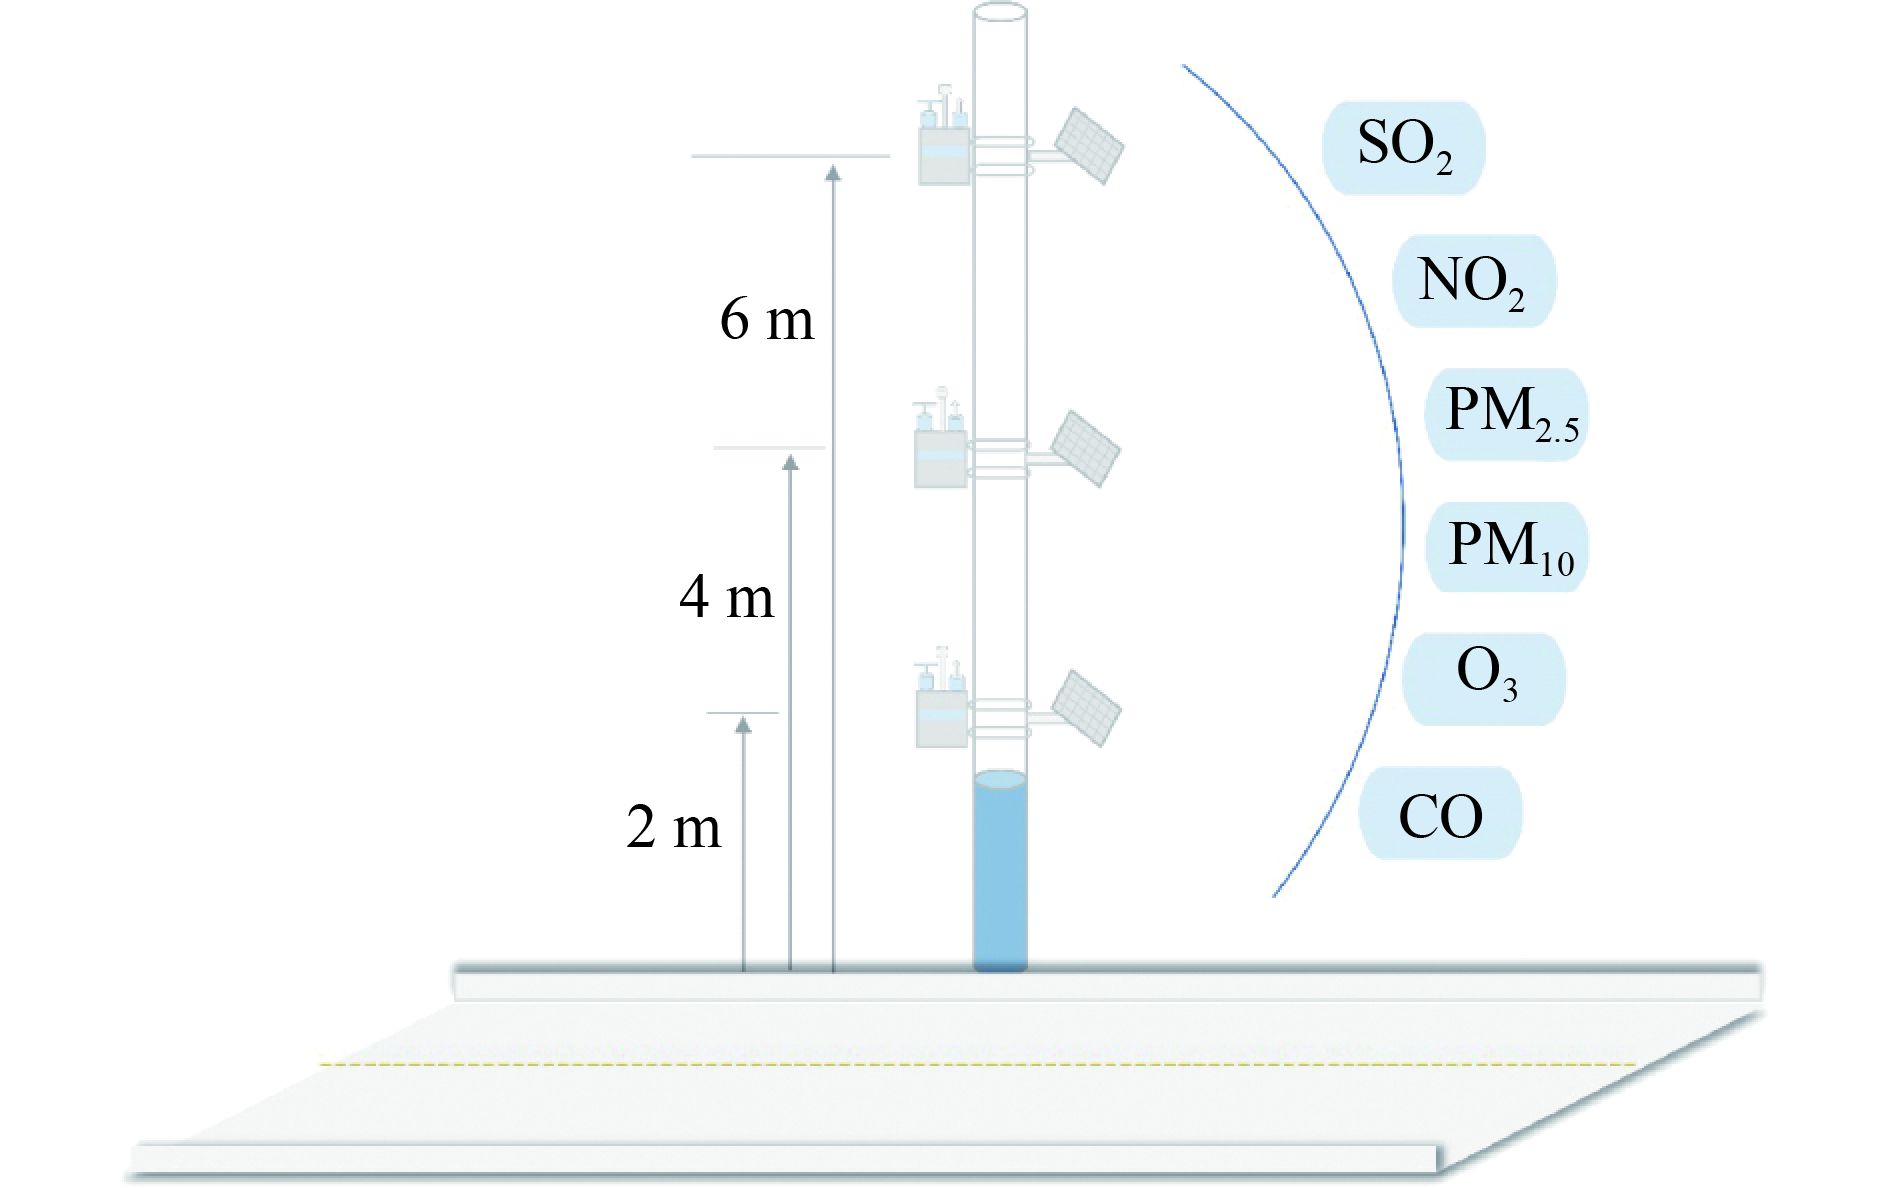
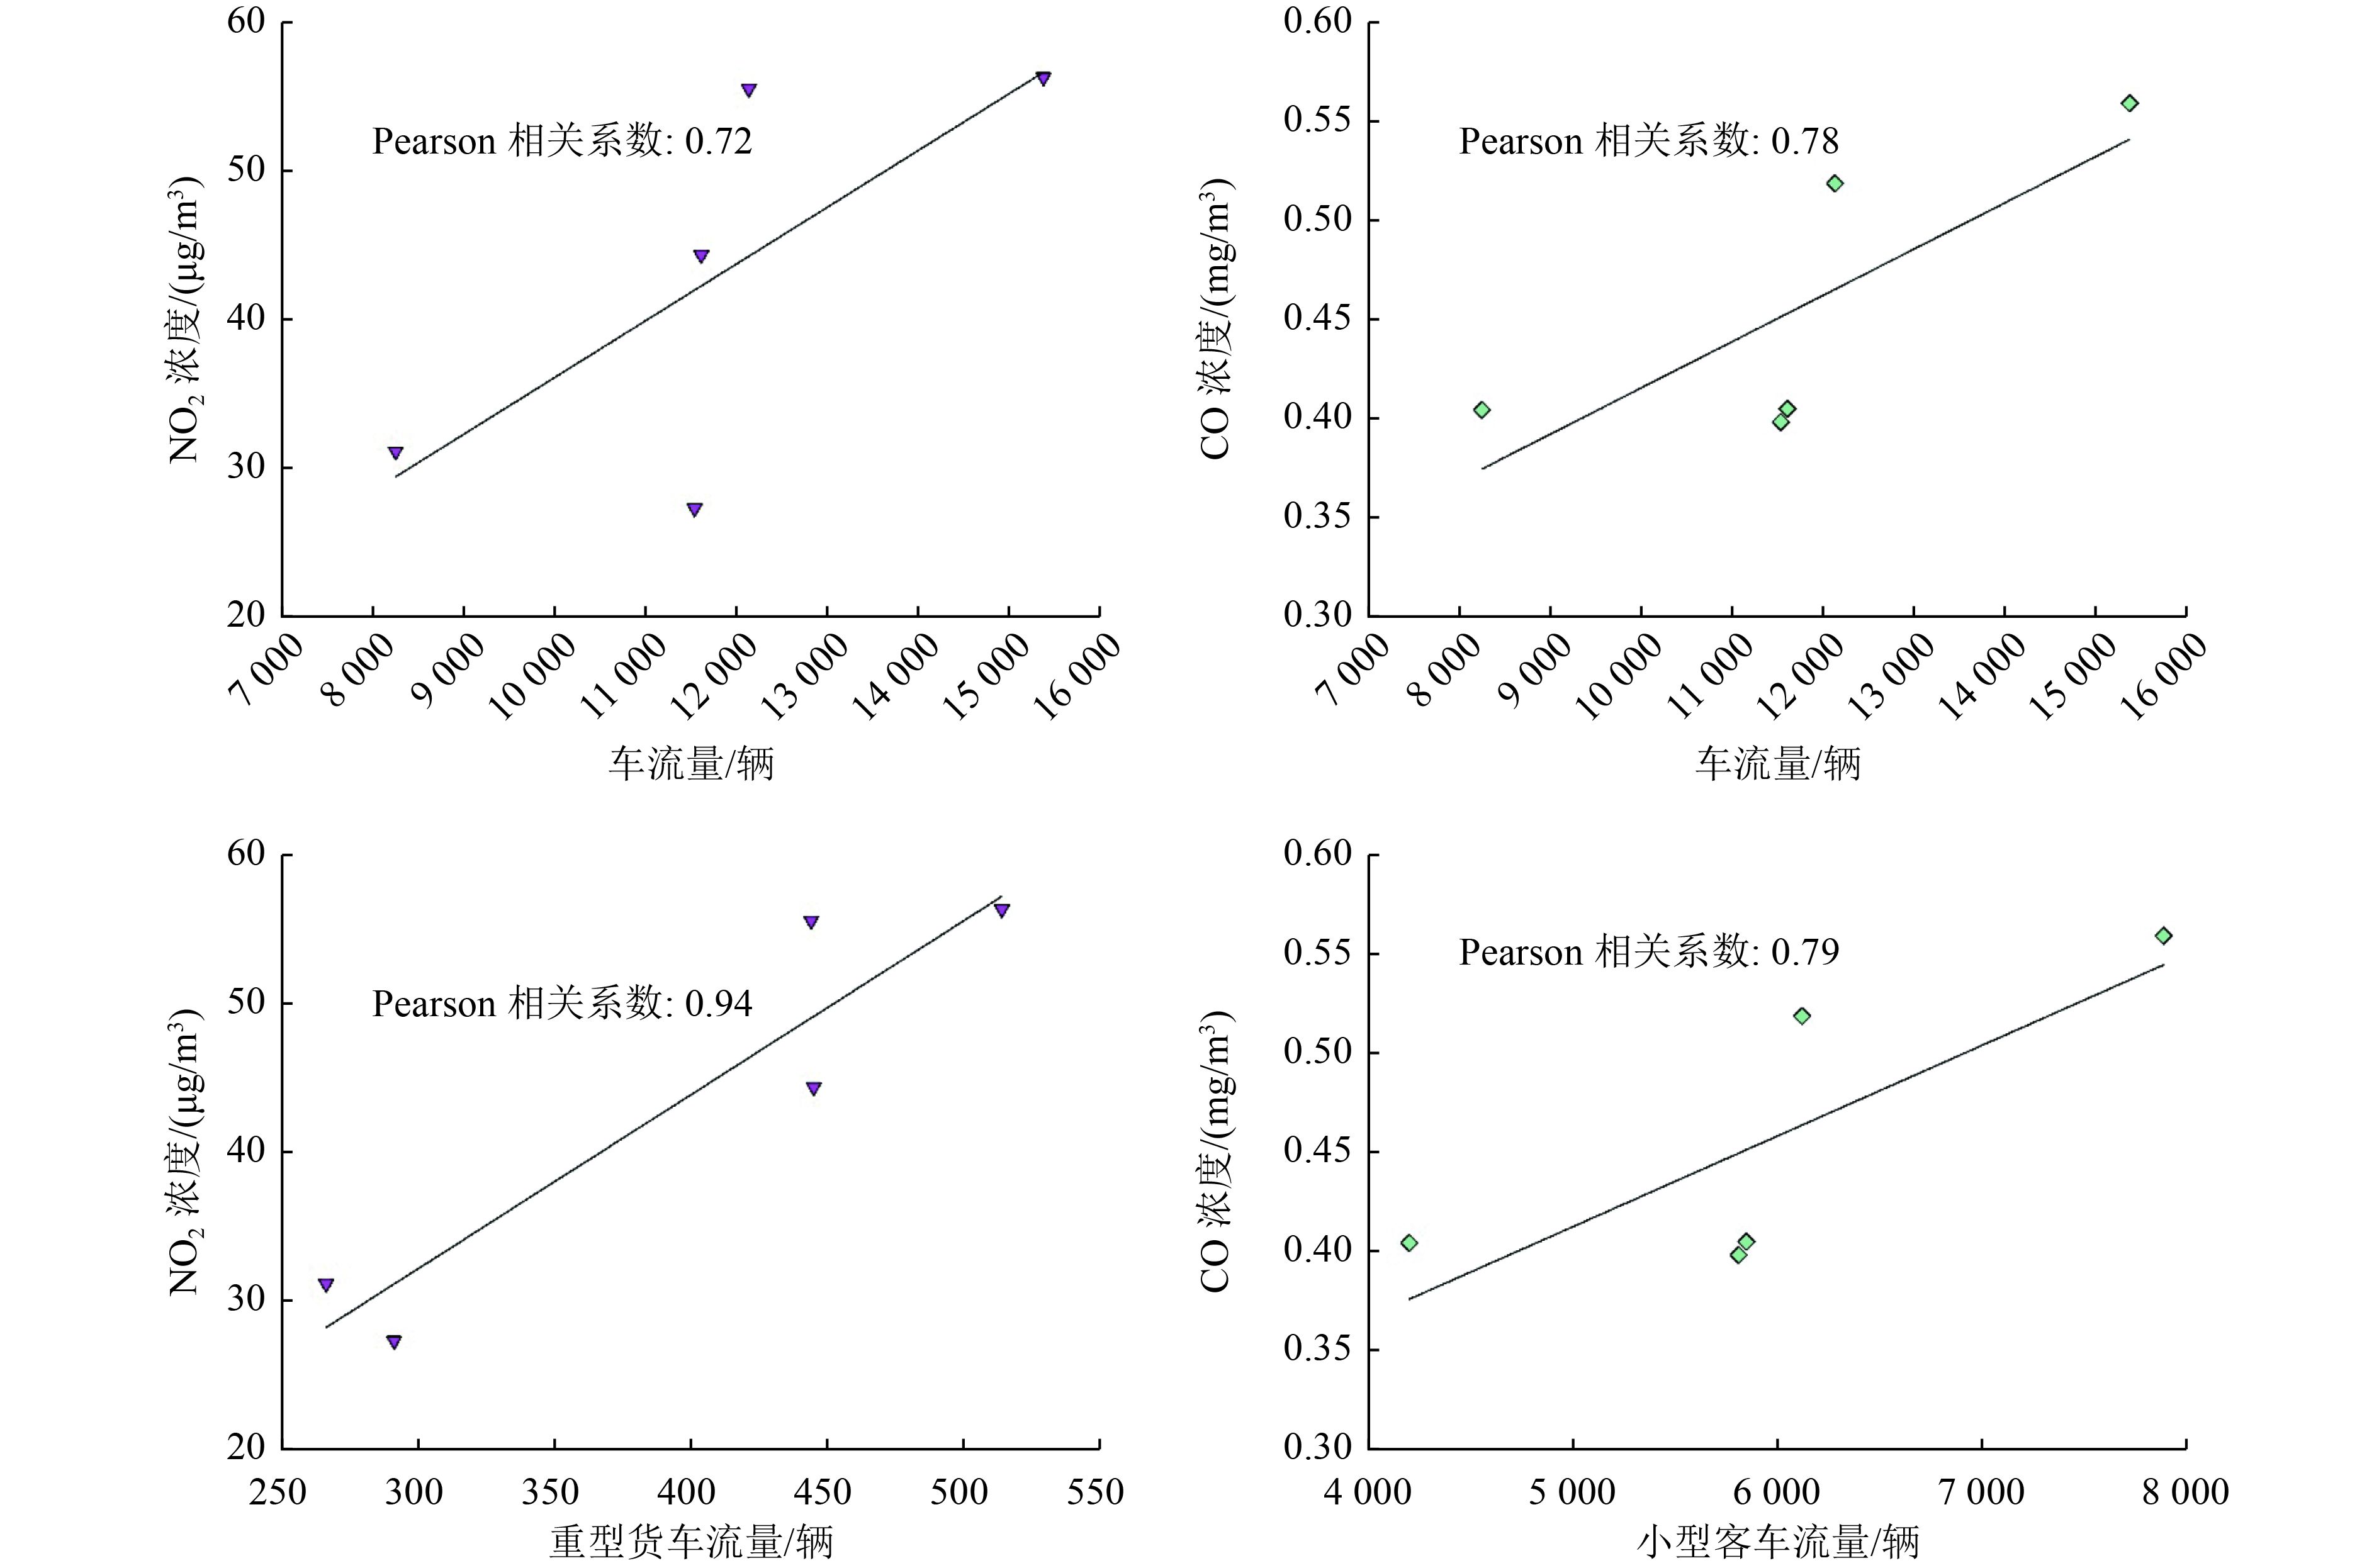
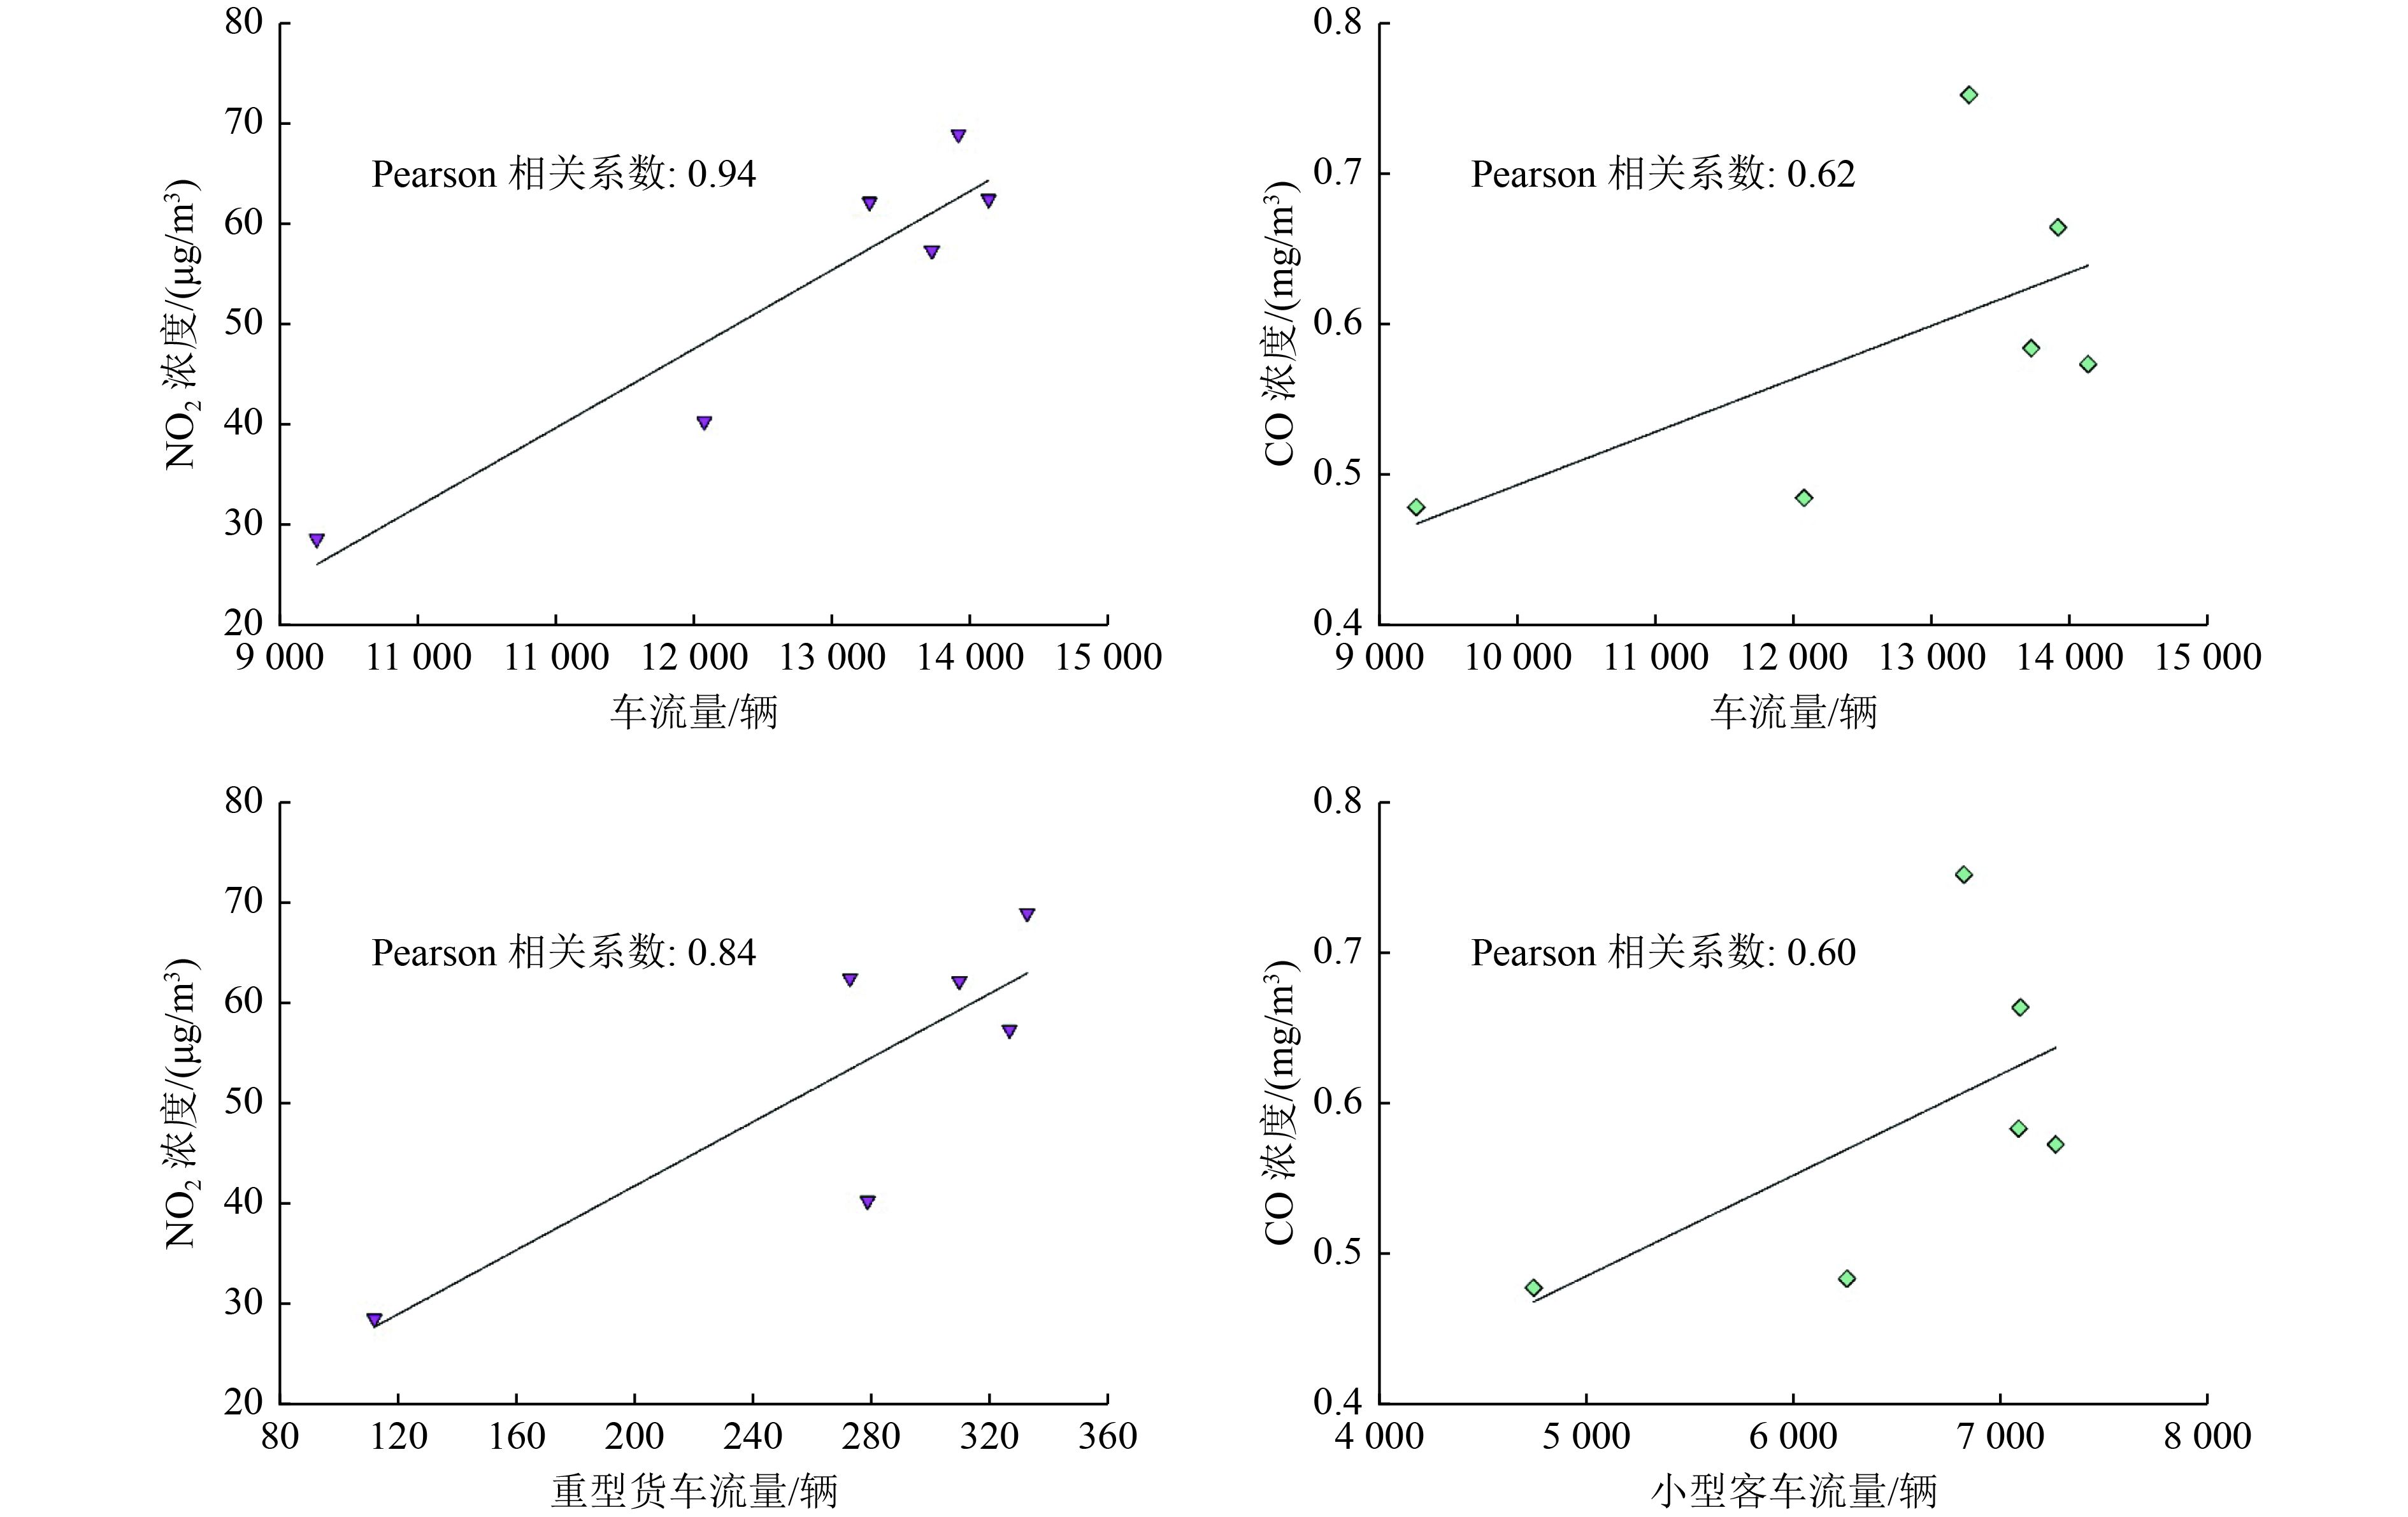
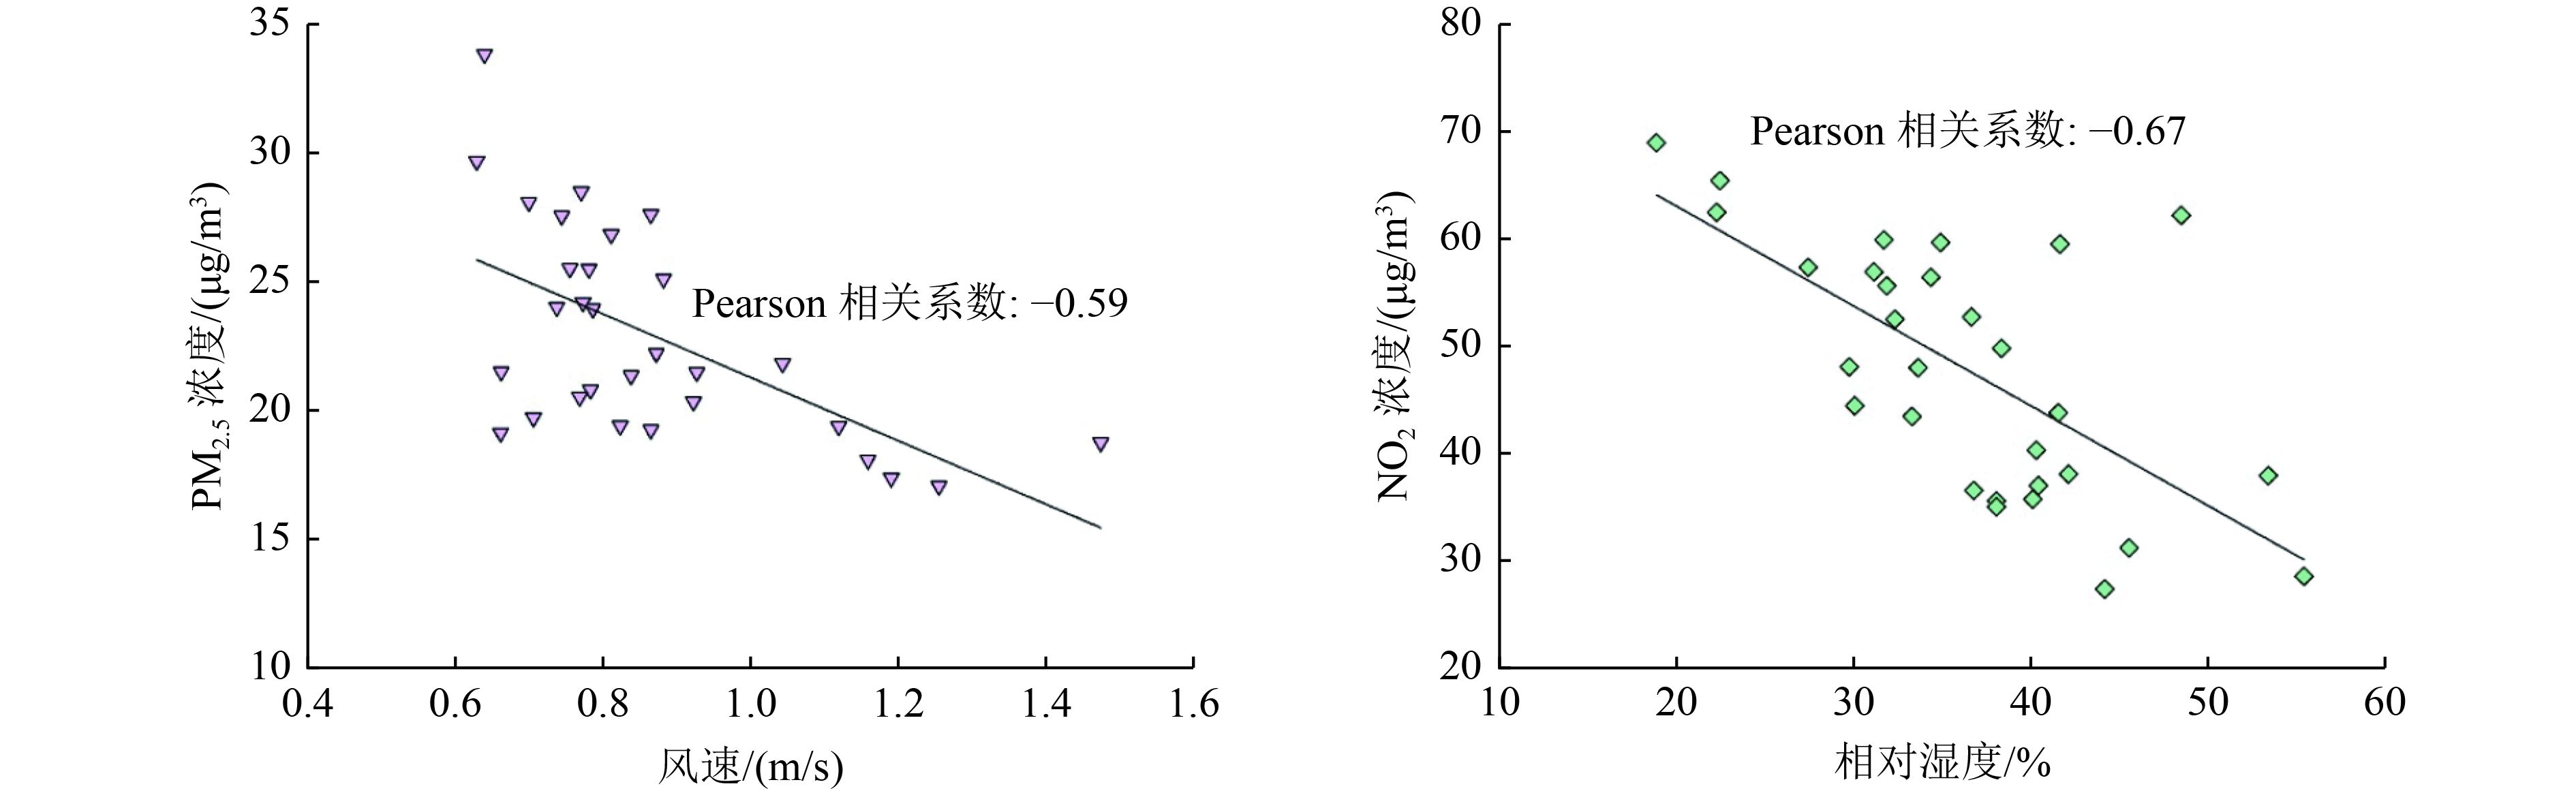
基于“十四五”生态环境监测要求,针对目前国内城市道路交通加密监测点大气污染特征及影响因素相对缺乏这一问题,以移动源为主要大气污染来源的甘肃省兰州市为例,在典型道路两侧不同点位、不同高度监测6种常规大气污染物浓度及气象参数,同时获取道路车流量和车型信息,探究其大气污染特征及影响因素。结果表明:道路两侧及道路同侧不同高度处大气污染物监测浓度均存在差异。PM2.5、PM10浓度随高度升高而逐渐降低,在2 m高度处最高,SO2、NO2、CO、O3浓度均呈现随高度先升高再降低的趋势,在4 m高度处最高。SO2、NO2、PM2.5、PM10、CO小时浓度在05:00—09:00达到峰值,在15:00—17:00达到谷值;而O3小时浓度峰谷值的时间恰好相反。NO2、CO浓度受车流量影响较大,代表时段NO2浓度与重型货车流量表现出极强的相关性,CO浓度与小型客车流量表现出强相关性。监测时段6种污染物日均浓度与相对湿度均呈负相关;NO2、PM2.5、PM10、CO日均浓度与风速均呈负相关,O3日均浓度与风速呈正相关。
Abstract:Based on the requirements of the 14th Five-Year Plan (2021-2025) of ecological environment monitoring, aiming at the lack of study about air pollution characteristics and influencing factors of typical urban road traffic densified monitoring stations in China, the concentrations of six conventional air pollutants and meteorological parameters were monitored at different points and heights on both sides of typical roads in Lanzhou City, Gansu Province, where mobile sources were the main source of air pollution. Meanwhile, road traffic flow and vehicle type information were acquired to explore the characteristics and influencing factors of air pollution. The results showed that there existed differences in the concentrations of air pollutants on both sides of the road and at different locations on the same side of the road. The concentrations of PM2.5 and PM10 declined with the height of the monitoring sites increasing, peaking at 2-meter height, whereas SO2, NO2, CO, and O3 showed a trend of first increasing and then decreasing with height, reaching their highest concentrations at 4-meter height. Hourly concentrations of SO2, NO2, PM2.5, PM10 and CO peaked at 05:00 to 09:00 and troughed at 15:00 to 17:00; while O3 peaked and troughed at exactly the opposite time. The concentrations of NO2 and CO were greatly affected by the traffic flow. Furthermore, NO2 concentrations had a very strong correlation with the volume of heavy-duty trucks and CO concentrations had a strong correlation with the volume of light-duty passenger vehicles during the representative time period. During the monitoring period the daily average concentrations of the six pollutants were negatively correlated with relative humidity; the daily average concentrations of NO2, PM2.5, PM10 and CO were negatively correlated with wind speed, while O3 was positively correlated with wind speed.
-

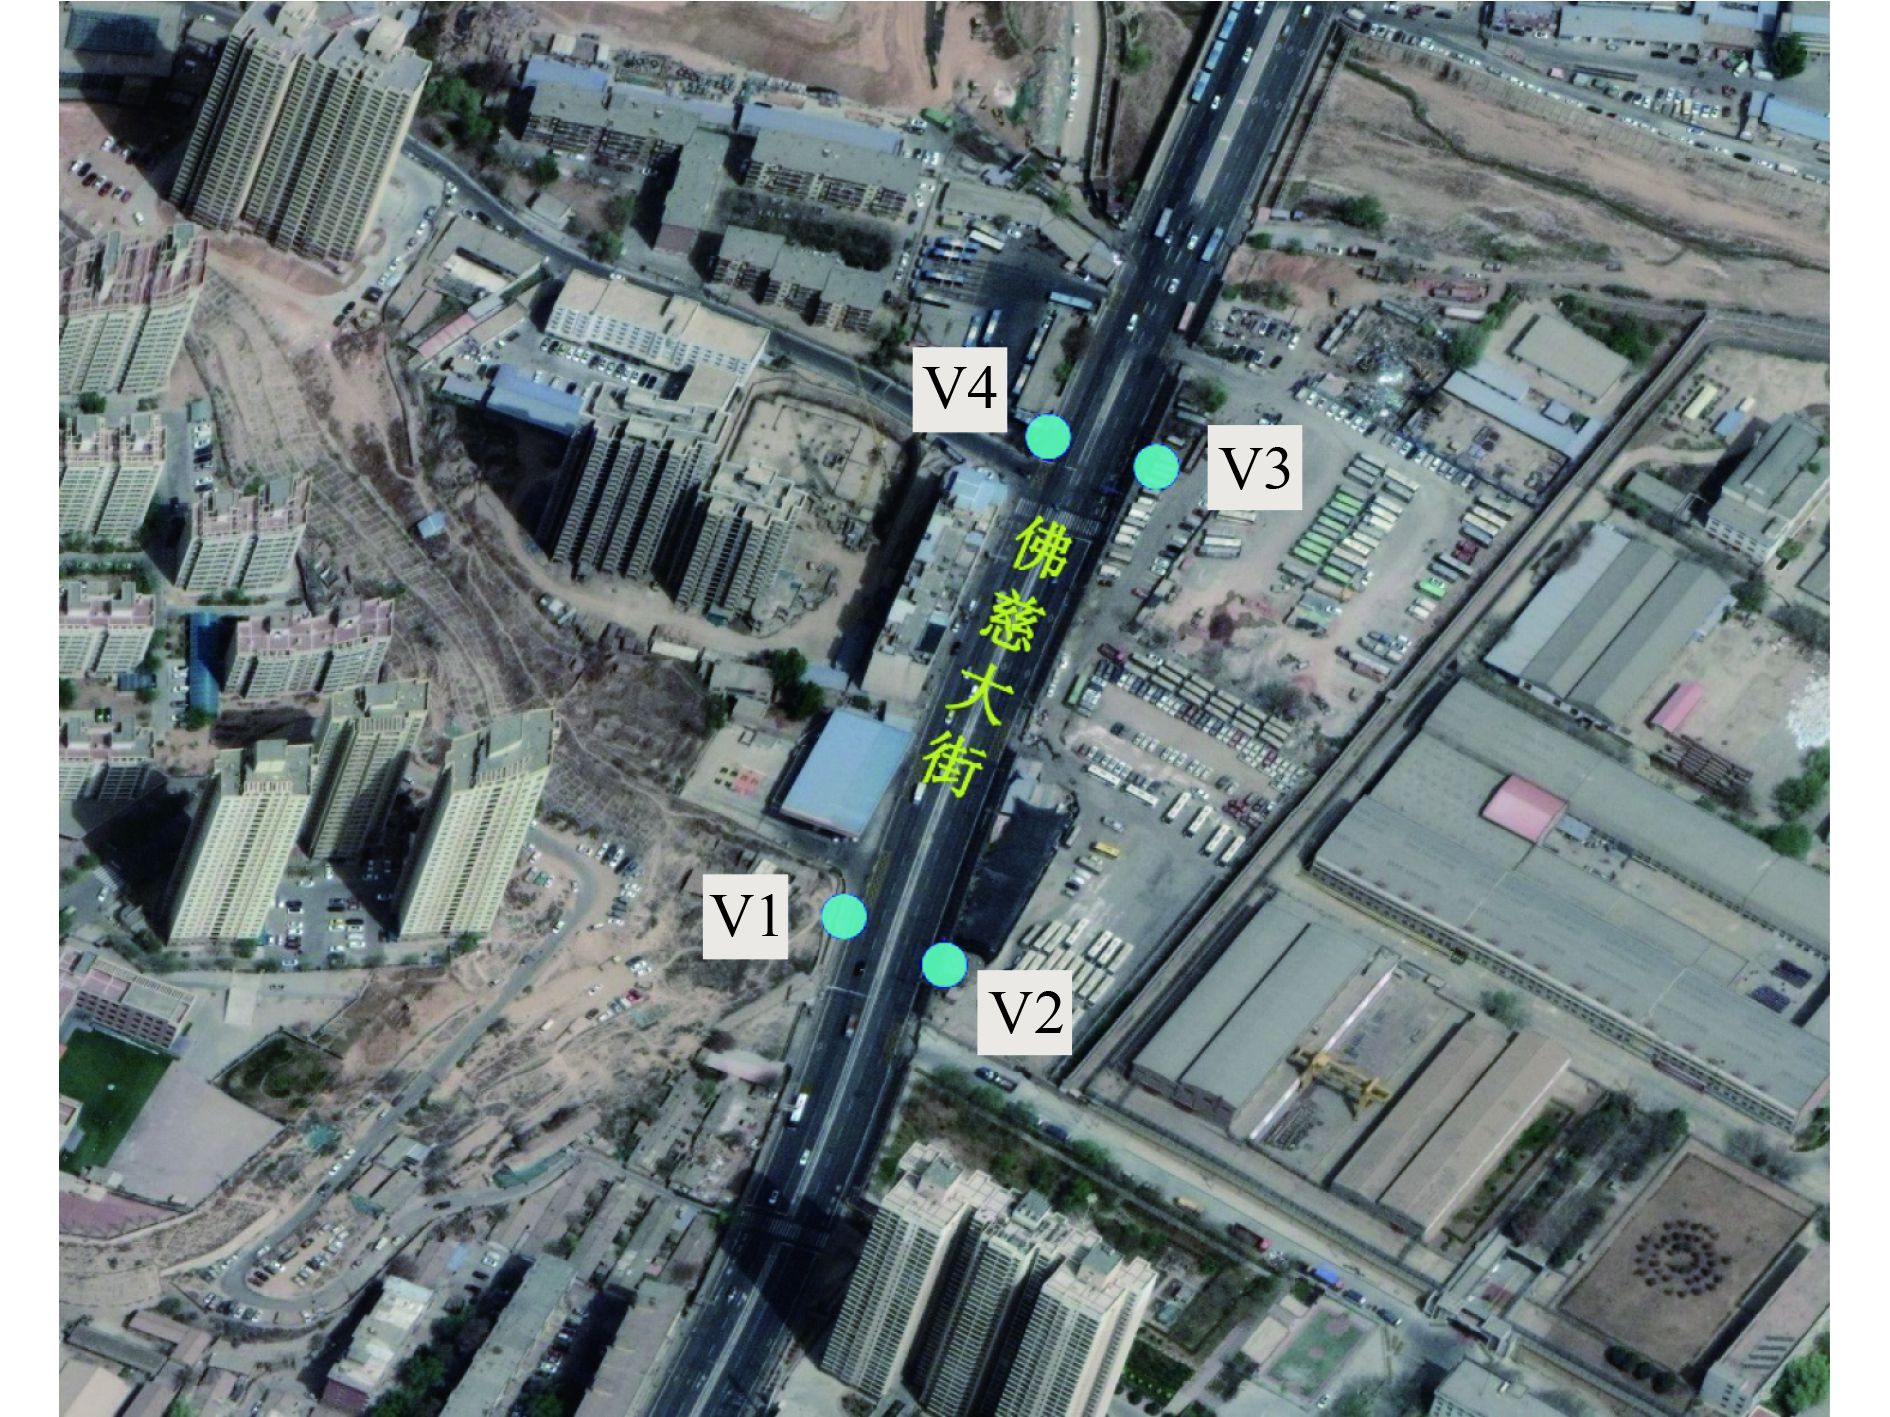
图 1 道路交通加密监测点点位示意
Figure 1. Schematic diagram of road densified traffic monitoring sites

图 2 道路交通加密监测垂直高度布点示意
Figure 2. Schematic diagram of vertical height distribution points of road densified traffic monitoring sites

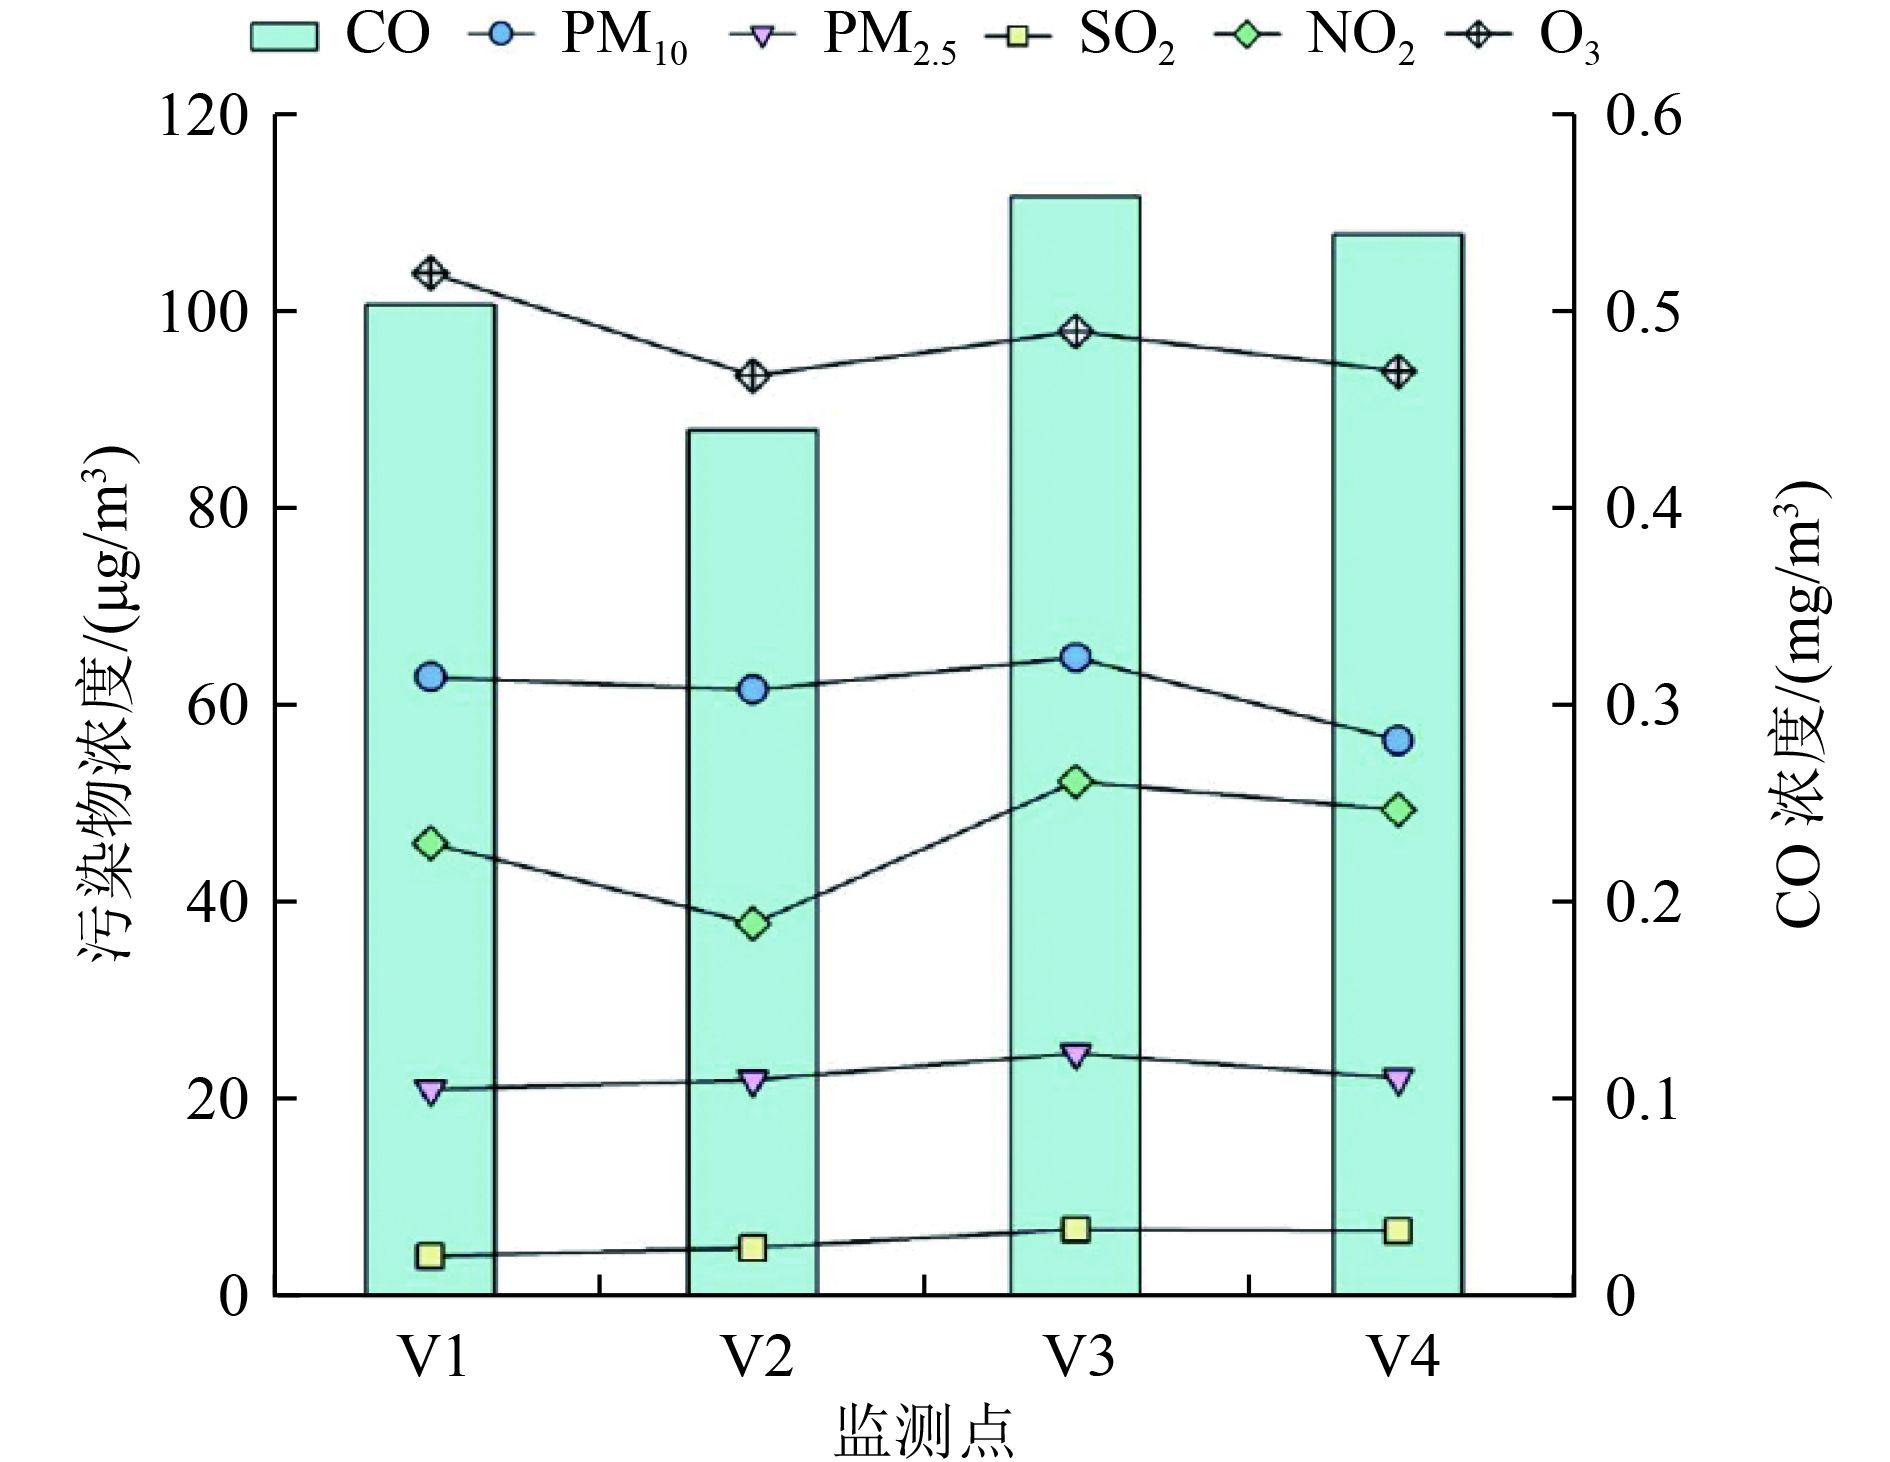
图 3 不同道路交通加密监测点的大气污染物平均浓度
Figure 3. Average mass concentration of air pollutants at different road traffic densified monitoring sites

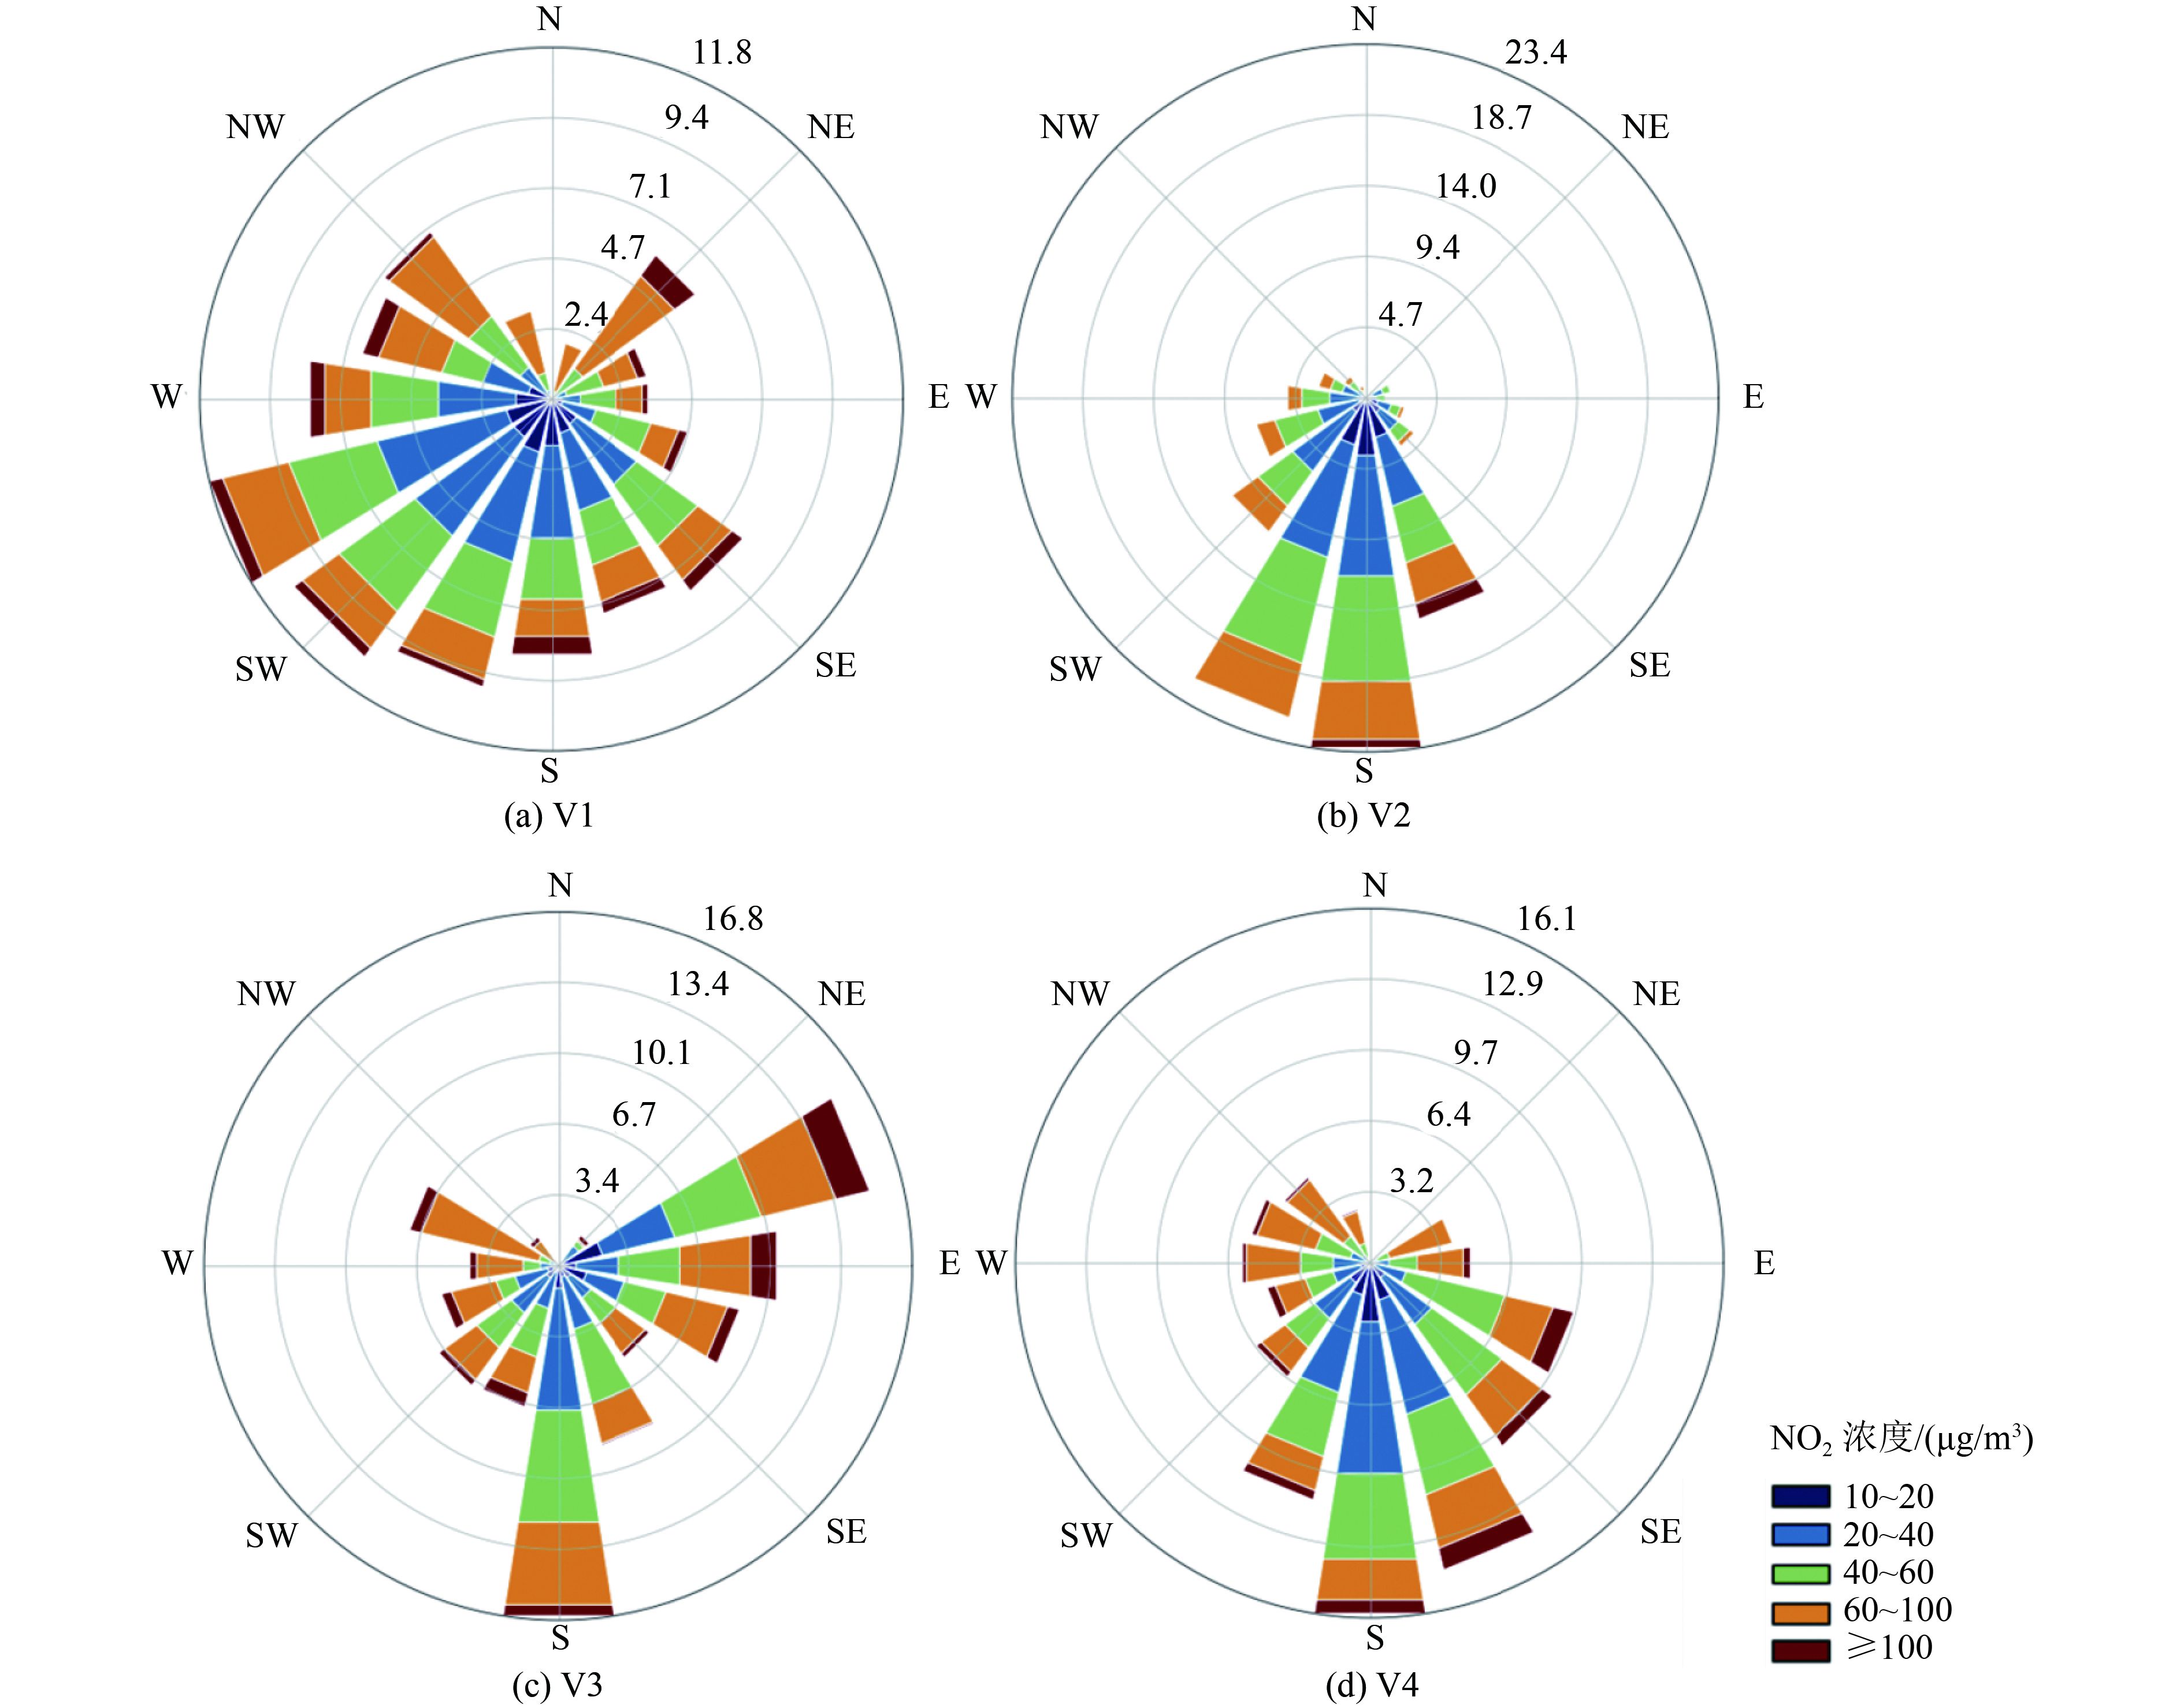
图 4 不同道路交通加密监测点的NO2因子风向玫瑰图
注:图中数值表示风向频率,%。
Figure 4. NO2 factor wind rose chart at different road traffic densified monitoring sites

图 5 不同高度道路交通加密监测点的大气污染物浓度变化
Figure 5. Variation of mass concentration of air pollutants at road traffic densified monitoring sites at different heights

图 6 1—30日道路交通加密监测点的大气污染物浓度变化
Figure 6. Variation of mass concentration of air pollutants at road traffic densified monitoring sites from Day 1 to 30

图 7 道路交通加密监测点的大气污染物小时浓度变化
Figure 7. Variation of hourly mass concentration of air pollutants at road traffic densified monitoring sites

图 8 道路交通加密监测点的大气污染物工作日与周末浓度变化
Figure 8. Weekday/weekend mass concentration of air pollutants at road traffic densified monitoring sites

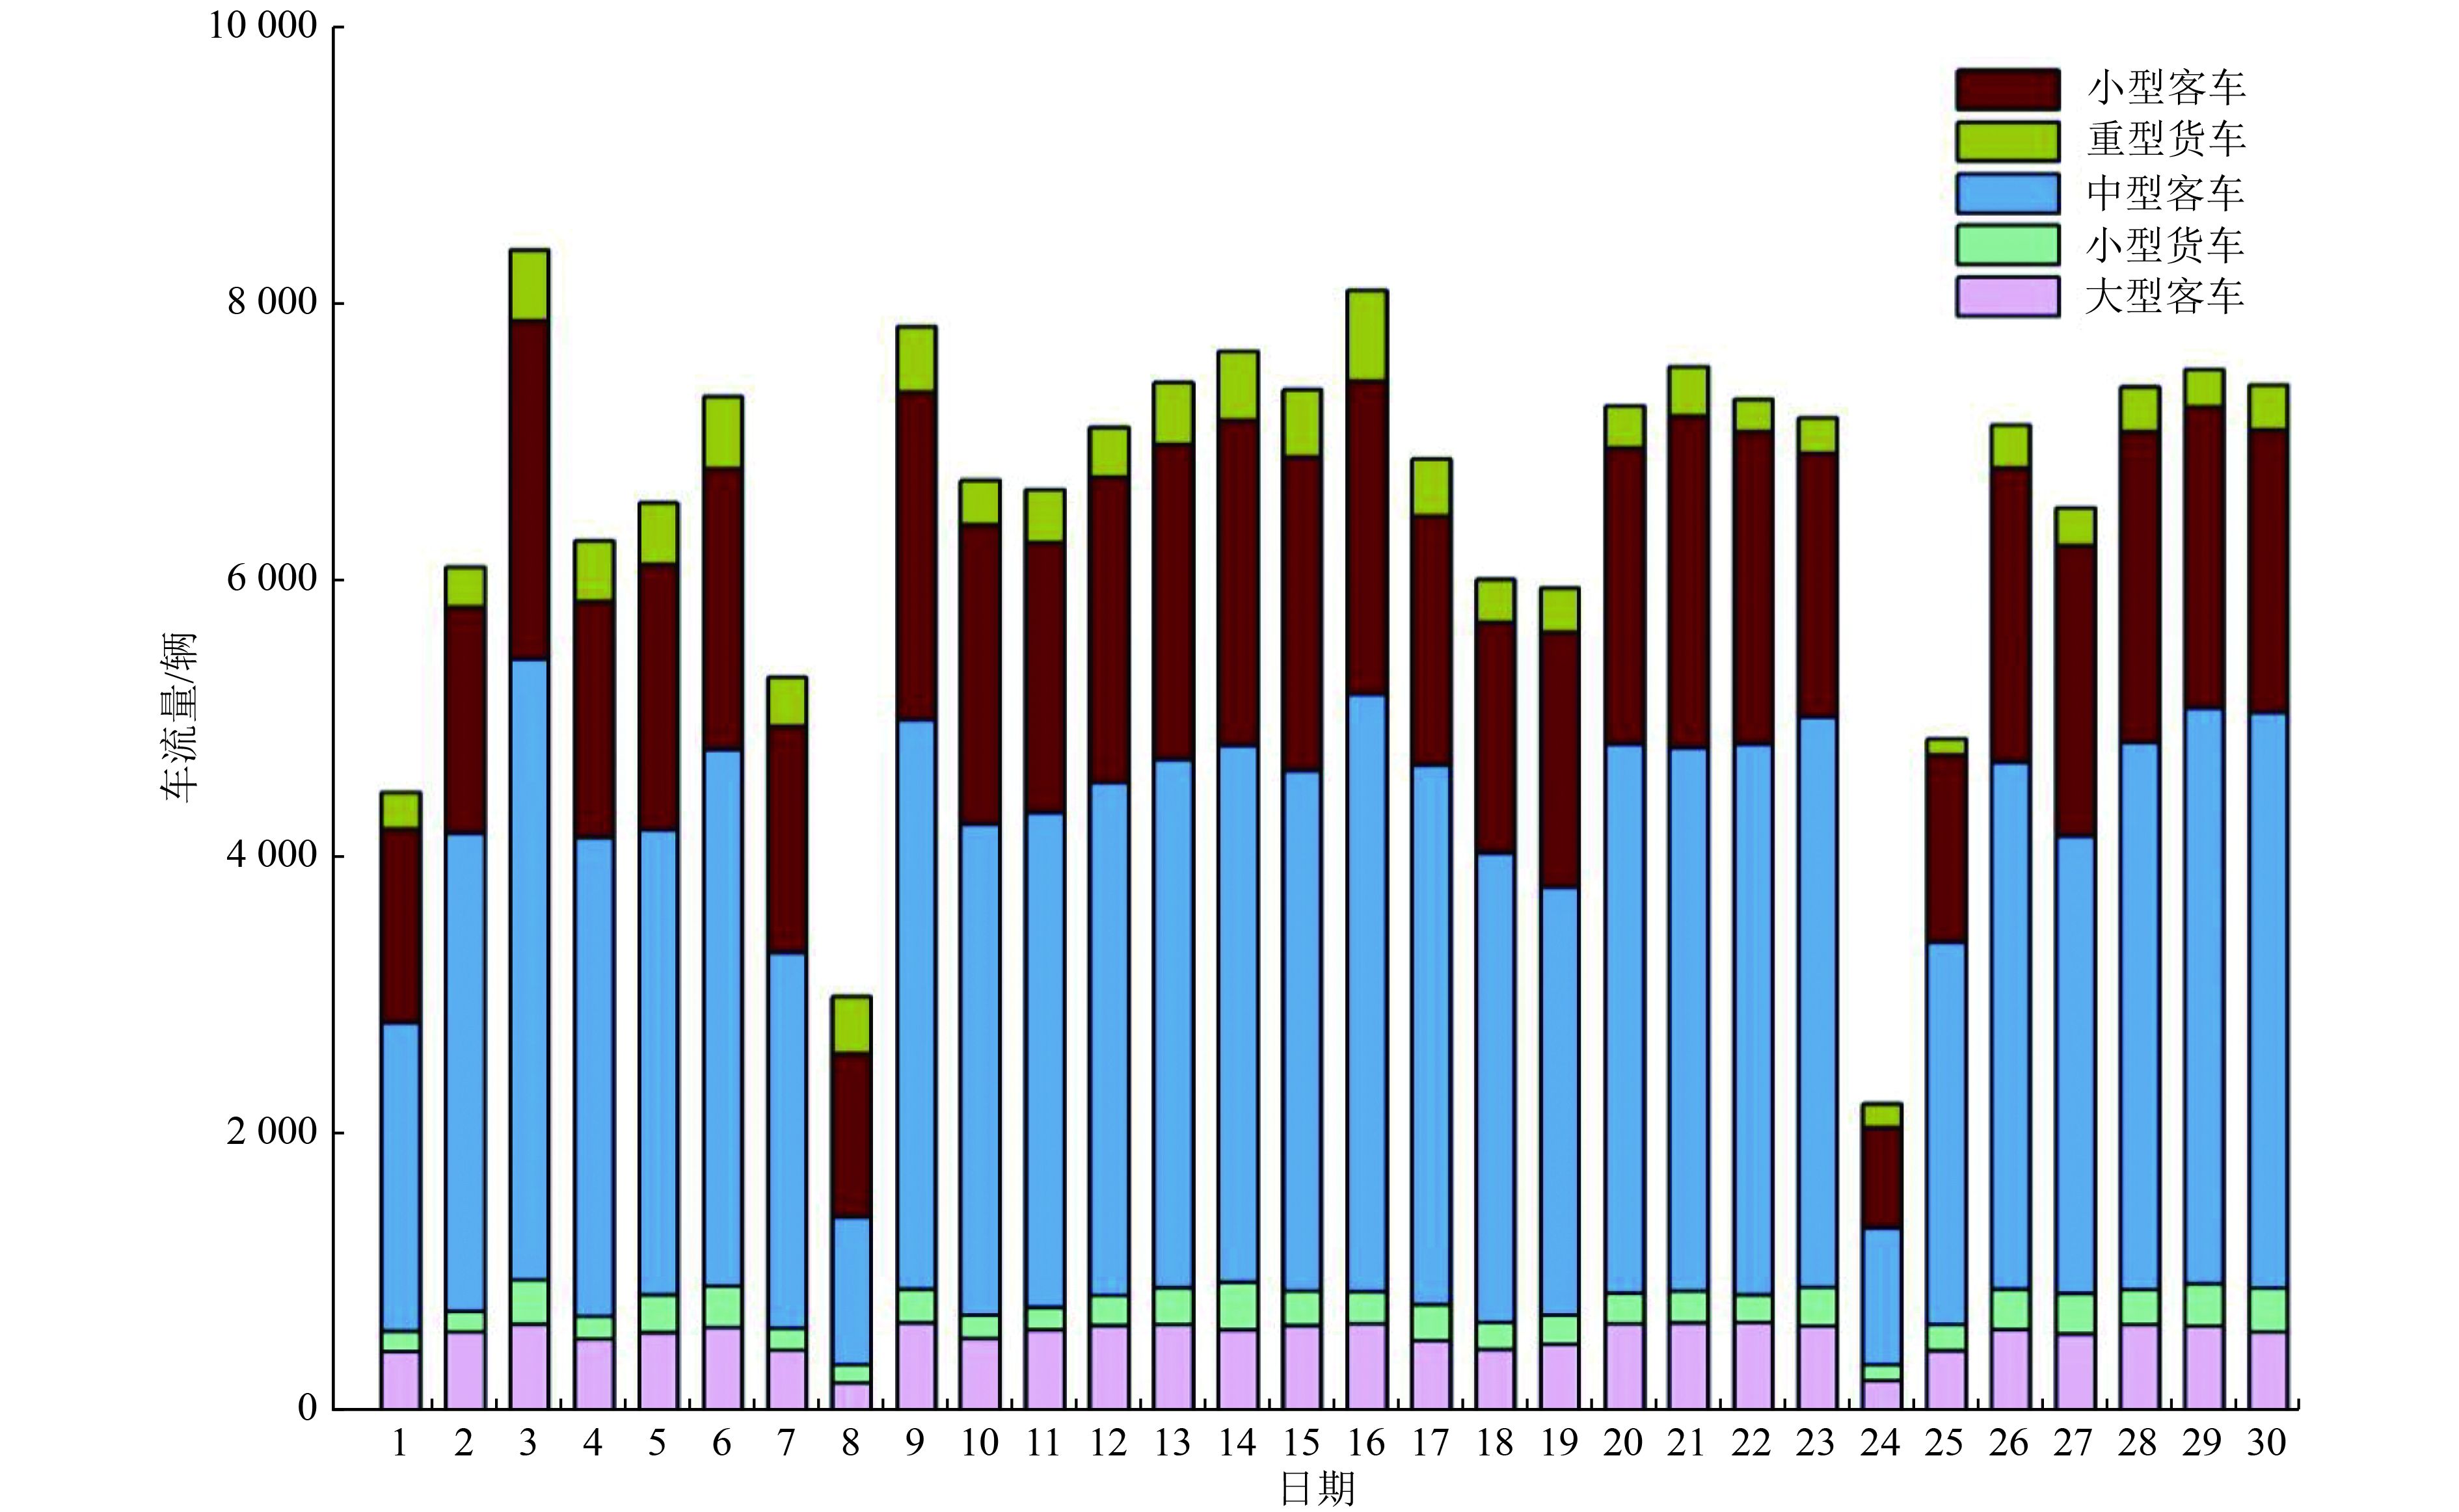
图 9 佛慈大街不同车型车流量统计
Figure 9. Traffic flow statistics of different models in Foci Street

图 10 监测时段日均风速、相对湿度、温度变化
Figure 10. Changes of average daily wind speed, relative humidity and temperature during the monitoring period

图 11 道路交通加密监测点NO2、CO浓度与车流量变化
Figure 11. Variation of daily average NO2, CO concentration and cumulative vehicle flow at road traffic densified monitoring sites

图 12 1—5日道路交通加密监测点NO2、CO浓度与车流量相关性
Figure 12. Correlation between daily average NO2, CO concentrations and cumulative vehicle flow at road traffic densified monitoring sites from Day 1 to 5

图 13 25—30日道路交通加密监测点NO2、CO浓度与车流量相关性
Figure 13. Correlation between daily average NO2, CO concentrations and cumulative vehicle flow at road traffic densified monitoring sites from Day 25 to 30

图 14 风速和PM2.5浓度、相对湿度和NO2浓度相关性
Figure 14. Correlation between wind speed and daily average PM2.5 concentration, relative humidity and daily average NO2 concentration
表 1 道路交通加密监测点经纬度信息
Table 1. Longitude and latitude information of road densified traffic monitoring sites
监测点 东经/(°) 北纬/(°) V1 103.836 8 36.084 1 V2 103.836 8 36.083 6 V3 103.838 2 36.086 4 V4 103.837 8 36.086 5  下载: 导出CSV
表 2 不同道路交通加密监测点的大气污染物日均浓度范围
Table 2. Range of daily average concentration of air pollutants at different road densified traffic monitoring sites
监测点 SO2日均浓度/
(μg/m3)NO2日均浓度/
(μg/m3)PM2.5日均浓度/
(μg/m3)PM10日均浓度/
(μg/m3)CO日均浓度/
(mg/m3)O3日均浓度/
(μg/m3)V1 2.2~7.8 27.1~67.1 15.7~32.0 42.7~101.5 0.371~0.713 76.9~124.0 V2 4.1~7.0 25.0~51.4 16.4~32.8 43.4~90.9 0.352~0.636 66.8~109.4 V3 5.2~10.9 29.2~75.2 19.4~37.5 39.9~107.2 0.407~0.848 67.3~119.9 V4 4.9~8.9 23.6~74.2 16.5~33.2 33.9~98.5 0.375~0.813 68.9~114.1
下载: 导出CSV
表 3 道路交通加密监测点大气污染物浓度与气象要素的Pearson相关系数
Table 3. Pearson correlation coefficient between mass concentration of air pollutants and meteorological elements at road traffic densified monitoring sites
气象要素 SO2 NO2 PM2.5 PM10 CO O3 风速 0.01 −0.30 −0.59 −0.52 −0.27 0.40 相对湿度 −0.38 −0.67 −0.23 −0.64 −0.28 −0.53 温度 0.17 0.38 −0.24 0.16 0.16 0.60
下载: 导出CSV
-
[1] 生态环境部. 中国移动源环境管理年报(2022年)[A/OL]. (2022-12-07)[2022-12-10]. https://www.mee.gov.cn/hjzl/sthjzk/ydyhjgl/202212/t20221207_1007111.shtml. [2] CHENG S Y, LANG J L, ZHOU Y, et al. A new monitoring-simulation-source apportionment approach for investigating the vehicular emission contribution to the PM2.5 pollution in Beijing, China[J]. Atmospheric Environment,2013,79:308-316. doi: 10.1016/j.atmosenv.2013.06.043 [3] LIU Y, ZHONG C Z, PENG J F, et al. Evaporative emission from China 5 and China 6 gasoline vehicles: emission factors, profiles and future perspective[J]. Journal of Cleaner Production,2022,331:129861. doi: 10.1016/j.jclepro.2021.129861 [4] 解淑霞, 黄志辉, 王鑫, 等.阳泉市2017年基于交通流量的机动车排放清单[J]. 环境工程技术学报,2021,11(2):226-233.XIE S X, HUANG Z H, WANG X, et al. Emission inventory of motor vehicle based on traffic flow for Yangquan City in 2017[J]. Journal of Environmental Engineering Technology,2021,11(2):226-233. [5] 陈天增, 葛艳丽, 刘永春, 等.我国机动车排放VOCs及其大气环境影响[J]. 环境科学,2018,39(2):478-492.CHEN T Z, GE Y L, LIU Y C, et al. VOCs emission from motor vehicles in China and its impact on the atmospheric environment[J]. Environmental Science,2018,39(2):478-492. [6] DENG T, WU D, DENG X J, et al. A vertical sounding of severe haze process in Guangzhou area[J]. Science China Earth Sciences,2014,57(11):2650-2656. doi: 10.1007/s11430-014-4928-y [7] LONG S L, ZENG J R, LI Y, et al. Characteristics of secondary inorganic aerosol and sulfate species in size-fractionated aerosol particles in Shanghai[J]. Journal of Environmental Sciences,2014,26(5):1040-1051. doi: 10.1016/S1001-0742(13)60521-5 [8] 吴潇萌. 中国道路机动车空气污染物与CO2排放协同控制策略研究[D]. 北京: 清华大学, 2016. [9] 张晓春, 丘建栋, 屈新明, 等.深圳市交通排放污染物浓度特征与影响因素[J]. 深圳大学学报(理工版),2020,37(2):178-186. doi: 10.3724/SP.J.1249.2020.02178ZHANG X C, QIU J D, QU X M, et al. Characteristics and influencing factors of traffic pollutant emission concentration in Shenzhen City[J]. Journal of Shenzhen University (Science and Engineering),2020,37(2):178-186. doi: 10.3724/SP.J.1249.2020.02178 [10] 范武波, 陈军辉, 钱骏, 等.机动车尾气对人体健康的危害[J]. 中国环境管理,2016,8(1):110-113.FAN W B, CHEN J H, QIAN J, et al. Effects of vehicle emissions on human's health[J]. Chinese Journal of Environmental Management,2016,8(1):110-113. [11] WU X F, VU T V, HARRISON R M, et al. Long-term characterization of roadside air pollutants in urban Beijing and associated public health implications[J]. Environmental Research, 2022, 212(Pt B): 113277. [12] 沈岩, 武彤冉, 闫静, 等.基于COPERT模型北京市机动车大气污染物和二氧化碳排放研究[J]. 环境工程技术学报,2021,11(6):1075-1082.SHEN Y, WU T R, YAN J, et al. Investigation on air pollutants and carbon dioxide emissions from motor vehicles in Beijing based on COPERT model[J]. Journal of Environmental Engineering Technology,2021,11(6):1075-1082. [13] PERUGU H. Emission modelling of light-duty vehicles in India using the revamped VSP-based MOVES model: the case study of Hyderabad[J]. Transportation Research Part D: Transport and Environment,2019,68:150-163. doi: 10.1016/j.trd.2018.01.031 [14] WEN H, MALKI-EPSHTEIN L. A parametric study of the effect of roof height and morphology on air pollution dispersion in street canyons[J]. Journal of Wind Engineering and Industrial Aerodynamics,2018,175:328-341. doi: 10.1016/j.jweia.2018.02.006 [15] BUCCOLIERI R, JEANJEAN A P R, GATTO E, et al. The impact of trees on street ventilation, NOx and PM2.5 concentrations across heights in Marylebone Rd street canyon, central London[J]. Sustainable Cities and Society,2018,41:227-241. doi: 10.1016/j.scs.2018.05.030 [16] CHATZIMICHAILIDIS A E, ARGYROPOULOS C D, ASSAEL M J, et al. Qualitative and quantitative investigation of multiple large eddy simulation aspects for pollutant dispersion in street canyons using OpenFOAM[J]. Atmosphere,2019,10(1):17. doi: 10.3390/atmos10010017 [17] 生态环境部. “十四五”生态环境监测规划[A/OL]. (2021-12-28)[2022-12-10]. https://www.mee.gov.cn/xxgk2018/xxgk/xxgk03/202201/t20220121_967927.html. [18] 李永锋, 马杰, 王胜蓝, 等.重庆市典型道路机动车排放NO2污染特征[J]. 环境工程技术学报,2022,12(5):1601-1608.LI Y F, MA J, WANG S L, et al. Research on the pollution characteristics of NO2 emitted by motor vehicles on typical roads in Chongqing[J]. Journal of Environmental Engineering Technology,2022,12(5):1601-1608. [19] 倪艳姝. 交通微环境中汽车排气PM2.5扩散及影响因素研究[D]. 哈尔滨: 东北林业大学, 2016. [20] 邹超, 吴琳, 李笑语, 等.南京市交通流与NO2、CO时空分布特征关系研究[J]. 环境科学学报,2017,37(10):3894-3905.ZOU C, WU L, LI X Y, et al. Relationship between traffic flow and temporal and spatial variations of NO2 and CO in Nanjing[J]. Acta Scientiae Circumstantiae,2017,37(10):3894-3905. [21] 程念亮, 李珊珊, 王欣, 等.北京市交通环境监测点大气污染特征分析[J]. 环境监测管理与技术,2019,31(6):7-11.CHENG N L, LI S S, WANG X, et al. Characteristics of air pollution at traffic environmental monitoring stations in Beijing[J]. The Administration and Technique of Environmental Monitoring,2019,31(6):7-11. [22] 沈敏霞, 曹军骥, 张宁宁, 等.西安市道路PM2.5 NO2 CO水平浓度分布特征[J]. 环境科学研究,2017,30(1):130-136.SHEN M X, CAO J J, ZHANG N N, et al. Horizontal concentration distribution characteristics of PM2.5, NO2 and CO on Xi'an roads[J]. Research of Environmental Sciences,2017,30(1):130-136. [23] SHI J P, KHAN A A, HARRISON R M. Measurements of ultrafine particle concentration and size distribution in the urban atmosphere[J]. Science of the Total Environment,1999,235(1/2/3):51-64. [24] CHUNG A, HERNER J D, KLEEMAN M J. Detection of alkaline ultrafine atmospheric particles at Bakersfield, California[J]. Environmental Science & Technology,2001,35(11):2184-2190. [25] LONGLEY I D, GALLAGHER M W, DORSEY J R, et al. A case study of aerosol (4.6 nm Dp 10 μm) number and mass size distribution measurements in a busy street canyon in Manchester, UK[J]. Atmospheric Environment,2003,37(12):1563-1571. doi: 10.1016/S1352-2310(03)00010-4 [26] 王恬爽, 牛笑应, 文惠, 等.兰州地区大气污染的化学组成及来源解析[J]. 环境科学学报,2022,42(11):351-360.WANG T S, NIU X Y, WEN H, et al. Chemical composition and source attribution of air pollutants in Lanzhou[J]. Acta Scientiae Circumstantiae,2022,42(11):351-360. [27] 陈瑞, 孙建云, 魏巧珍, 等.2014—2020年兰州市大气污染物特征及变化趋势分析[J]. 卫生研究,2021,50(5):769-774.CHEN R, SUN J Y, WEI Q Z, et al. The characteristics and change trends of air pollutants in Lanzhou City from 2014 to 2020[J]. Journal of Hygiene Research,2021,50(5):769-774. [28] 庞可. 基于道路交通碳达峰情景的兰州市环境空气质量改善研究[D]. 兰州: 兰州大学, 2022. [29] 严晓瑜, 缑晓辉, 杨婧, 等.中国典型城市臭氧变化特征及其与气象条件的关系[J]. 高原气象,2020,39(2):416-430.YAN X Y, GOU X H, YANG J, et al. The variety of ozone and its relationship with meteorological conditions in typical cities in China[J]. Plateau Meteorology,2020,39(2):416-430. [30] 楚芳婕, 孙爽, 李令军, 等.2018—2020年北京市交通监测站点大气污染特征分析[J]. 中国环境科学,2021,41(12):5548-5560. doi: 10.3969/j.issn.1000-6923.2021.12.010CHU F J, SUN S, LI L J, et al. Characteristics of the atmospheric pollutants at traffic monitoring sites in Beijing during 2018-2020[J]. China Environmental Science,2021,41(12):5548-5560. doi: 10.3969/j.issn.1000-6923.2021.12.010 [31] ZHAO J G, WANG S G, ZHANG T Y, et al. The analysis of meteorological factors causing heavy air pollution in Lanzhou[J]. Acta Scientiae Circumstantiae,2015,35(5):1547-1555. □ -

 下载:
下载:


 点击查看大图
计量
- 文章访问数: 267
- HTML全文浏览量: 103
- PDF下载量: 41
- 被引次数: 0