

Study on the embodied carbon's flow process in China's industrial system based on social networks
-
摘要:
隐含碳是产品和服务在全生命周期中的直接和间接碳排放之和。研究隐含碳在产业系统中的流动特征及不同产业部门在碳排放关系网络中的地位与作用,对于碳减排责任分解、碳排放核算标准制定、碳溯源机制建立及碳减排方案制定等具有重要意义。基于2018年投入产出表,计算产业部门隐含碳流动量,借助社会网络分析的理论与方法,构建产业系统隐含碳流动网络,并分析产业部门间的隐含碳流动关系特征、核心部门及聚类特征。结果显示:1)生产过程中的隐含碳流动量约占直接碳排放总量的85.12%,电气机械和器材制造业、金属矿采选业、纺织业分别在隐含碳流入、流出及滞留占比中占据领先。2)产业部门间已形成隐含碳流动网络,部门间联系紧密,一个产业部门碳排放的变动会带动全产业系统的变化。3)化学产品制造业、电力热力燃气及水生产和供应业、交通运输仓储和邮政业是网络中的核心部门,对其他部门的控制影响力较强;金属矿采选业、非金属矿和其他矿采选业与其他部门的隐含碳传输路径较短,具有较高的隐含碳流动效率。4)产业部门间存在明显聚类特征,以化学产品制造业为核心的调节者和以石油炼焦产品及核燃料加工业为核心的直接碳排放提供者,起到平衡全产业系统隐含碳流动的作用;以建筑业、其他服务业为核心的产业部门是隐含碳接收者;以电力热力燃气及水生产和供应业为核心的产业部门是隐含碳的供应者。
Abstract:Embodied carbon is the sum of direct and indirect carbon emissions in the entire life cycle of products and services. Research on the flow characteristics of embodied carbon in the industrial system and the study on the position and role of different industrial sectors in the carbon emission relationship network is of great significance to the decomposition of carbon emission reduction responsibility, the formulation of carbon emission accounting standards, the establishment of carbon traceability mechanism and the formulation of carbon emission reduction plans. Based on the input-output tables in 2018, the embodied carbon flow of industrial sectors was calculated, a flow network related to embodied carbon in the industrial system was built by applying the theory and method of social network analysis, and the characteristics of the implicit carbon flow relationship between industrial sectors, the core sectors and clustering features were analyzed. The main conclusions were as follows: 1) The embodied carbon flow in the production process accounted for about 85.12% of the total direct carbon emissions, and electrical machinery and equipment manufacturing industry, metal mining and processing industry, and textile industry took the lead in the proportion of embodied carbon inflow, outflow and retention, respectively. 2) An embodied carbon flow network had been formed among industrial sectors, and the inter-departments were closely linked. The changes in carbon emissions in one industrial sector would drive changes in the entire industrial system. 3) Chemical product manufacturing industry, electricity, heat, gas and water production and supply industry, and transportation, warehousing and postal services industry were the core sectors in the network, with strong control and influence over other sectors. The embodied carbon transmission paths of metal mining, non-metal mining and other mining and processing industries to other sectors were shorter, and had higher embodied carbon flow efficiency. 4) There were obvious clustering characteristics among industrial sectors. The regulators centered on the chemical product manufacturing industry, and the direct carbon emission providers centered on the petroleum coking products and nuclear fuel processing industries played a role in balancing the embodied carbon flow of the entire industrial system. The industrial sectors centered on the construction industry and other service industries were the receivers of embodied carbon, while the industrial sectors centered on the production and supply of electricity, heat, gas, and water were the suppliers of embodied carbon.
-
Key words:
- embodied carbon /
- industrial system /
- input-output model /
- social network
-

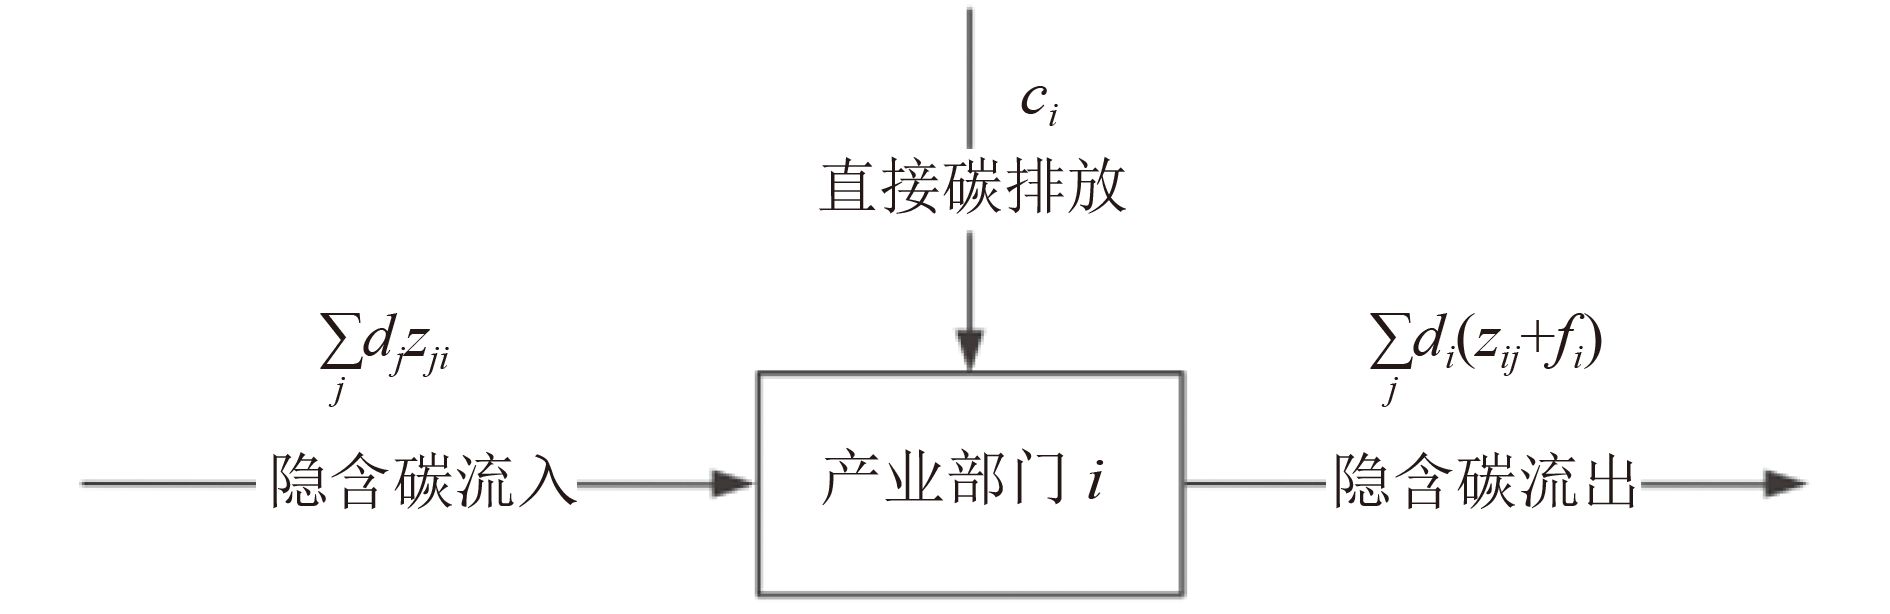
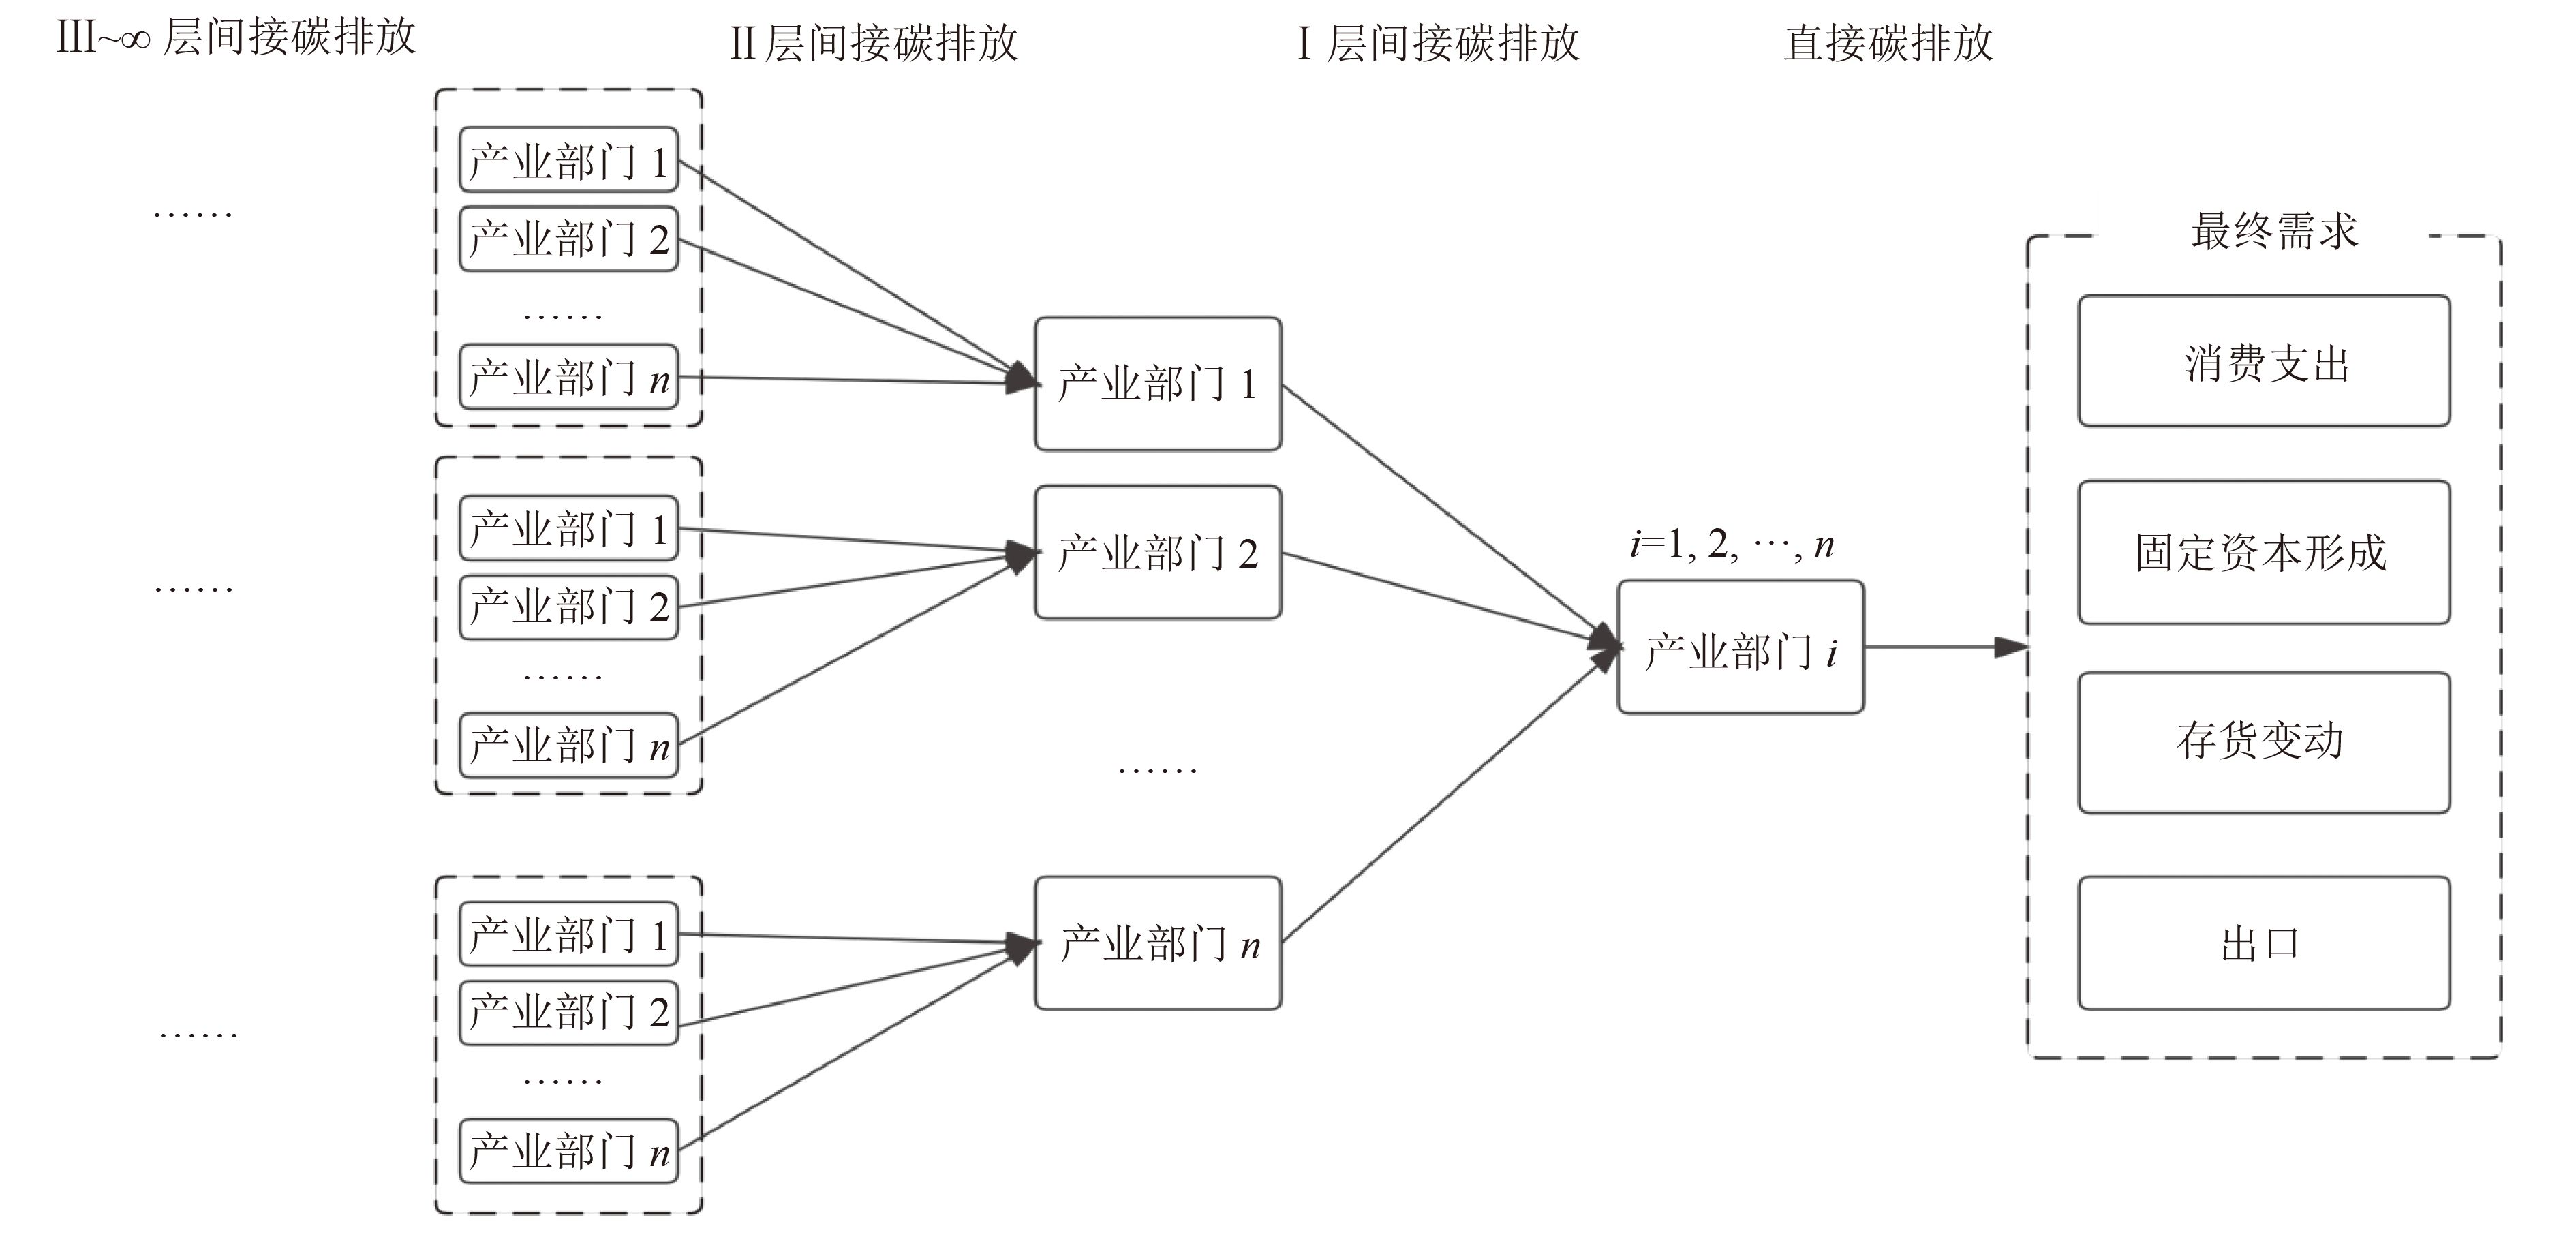
图 1 产业部门间隐含碳流动过程示意
注:直接碳排放为产业部门i产品直接用于满足最终需求所产生的碳排放;Ⅰ层间接碳排放为产业部门i通过使用其他产业部门产品以满足最终需求所产生的间接碳排放;Ⅱ层间接碳排放为产业部门i使用产业部门j产品,产业部门j再使用其他部门产品以满足产业部门i的最终需求所产生的间接碳排放。
Figure 1. Schematic diagram of embodied carbon flow process between industrial sectors

图 3 产业部门隐含碳流入量、流出量、滞留量占比
Figure 3. Proportion of industrial sector's embodied carbon input, output and retention
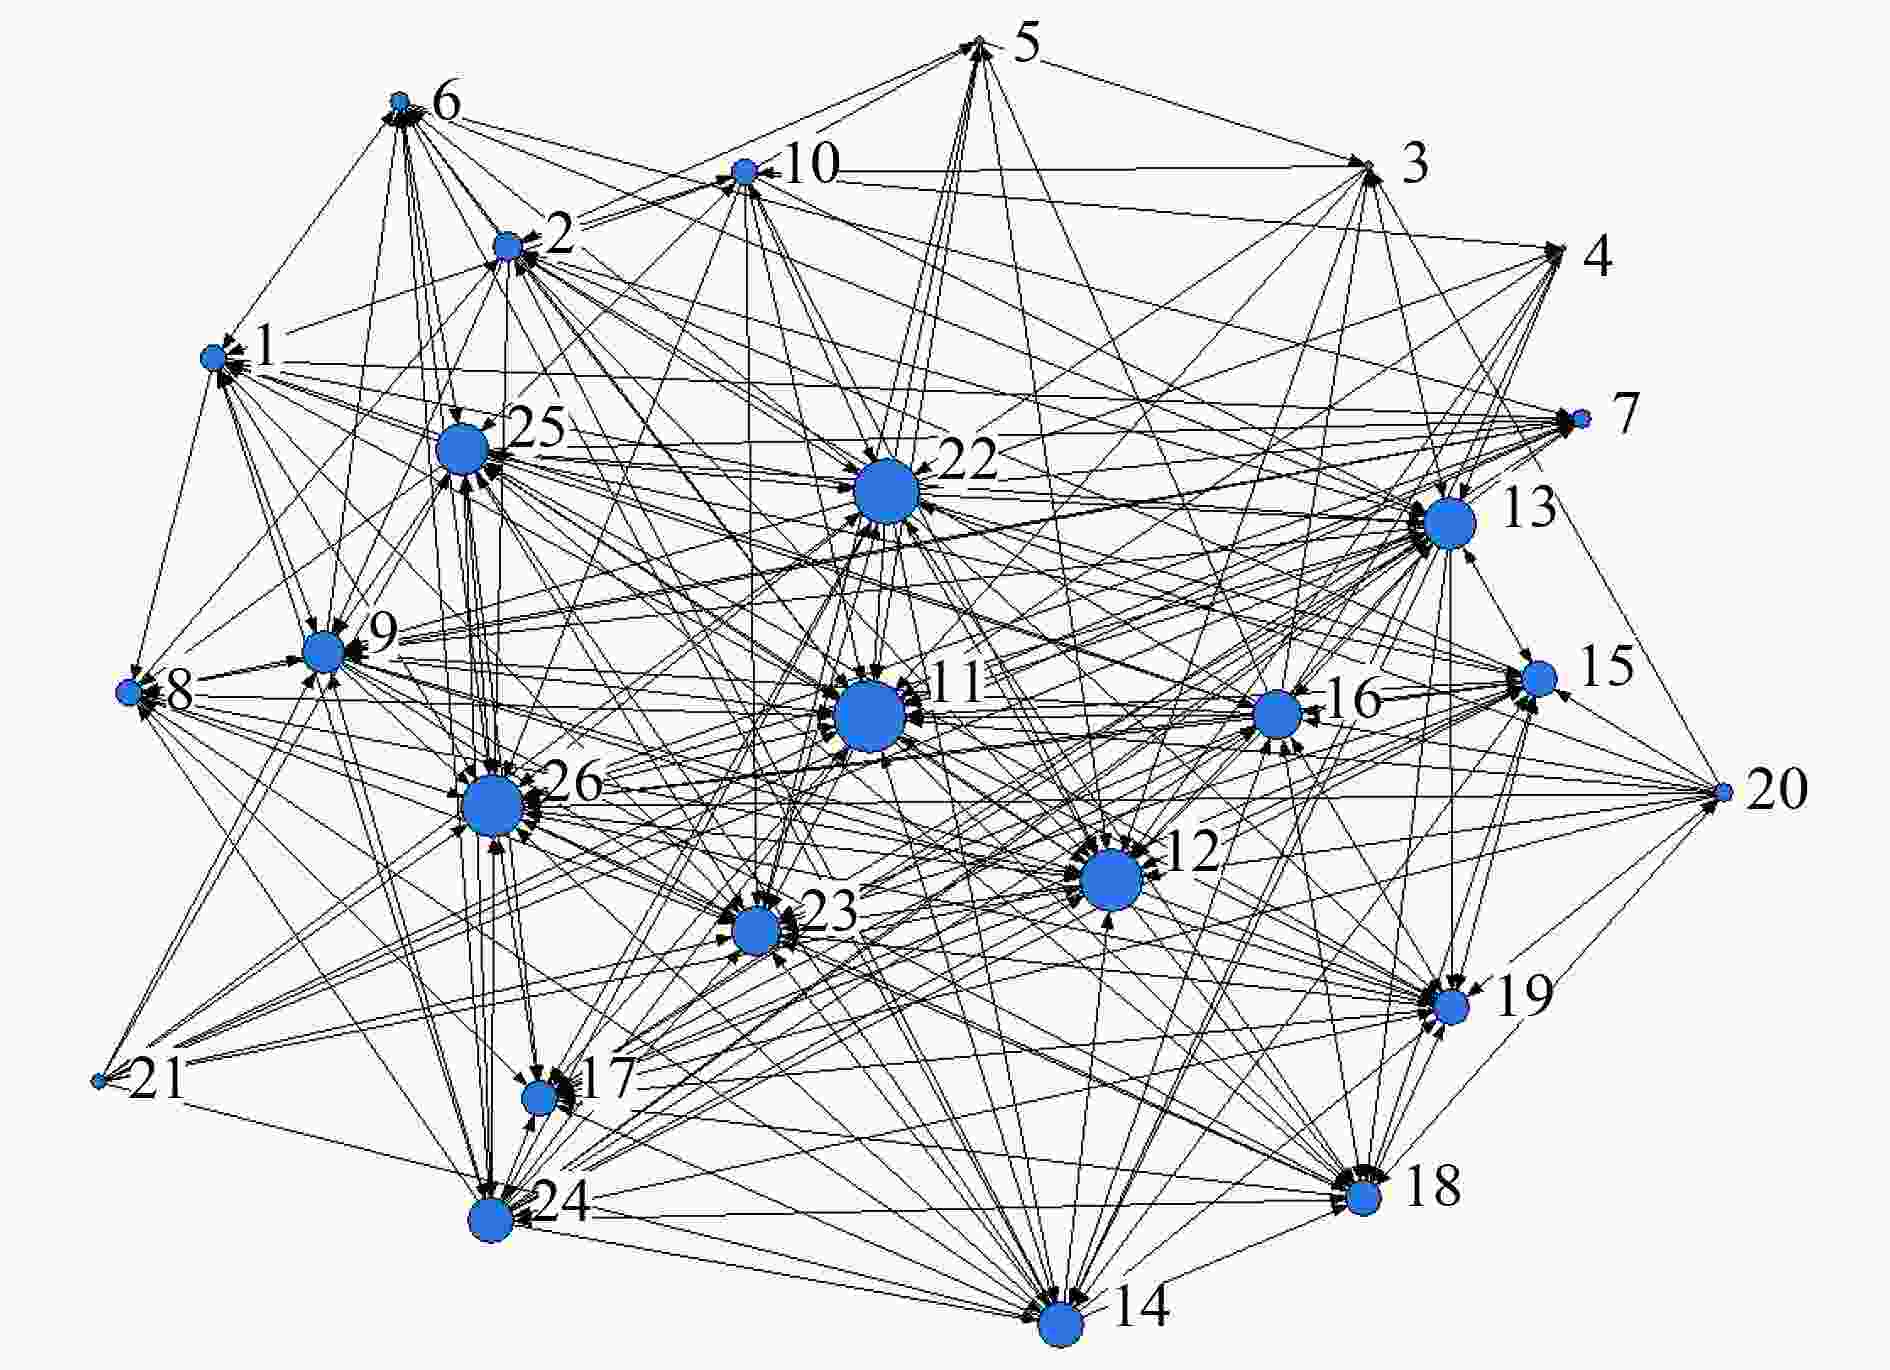
图 4 产业系统隐含碳流动网络示意
注:圆圈代表产业部门,边代表产业部门之间的有效关联。圆圈越大代表该产业部门的有效关联数越多,与其他部门的隐含碳排放流动越密切。
Figure 4. Embodied carbon correlation network of industrial system

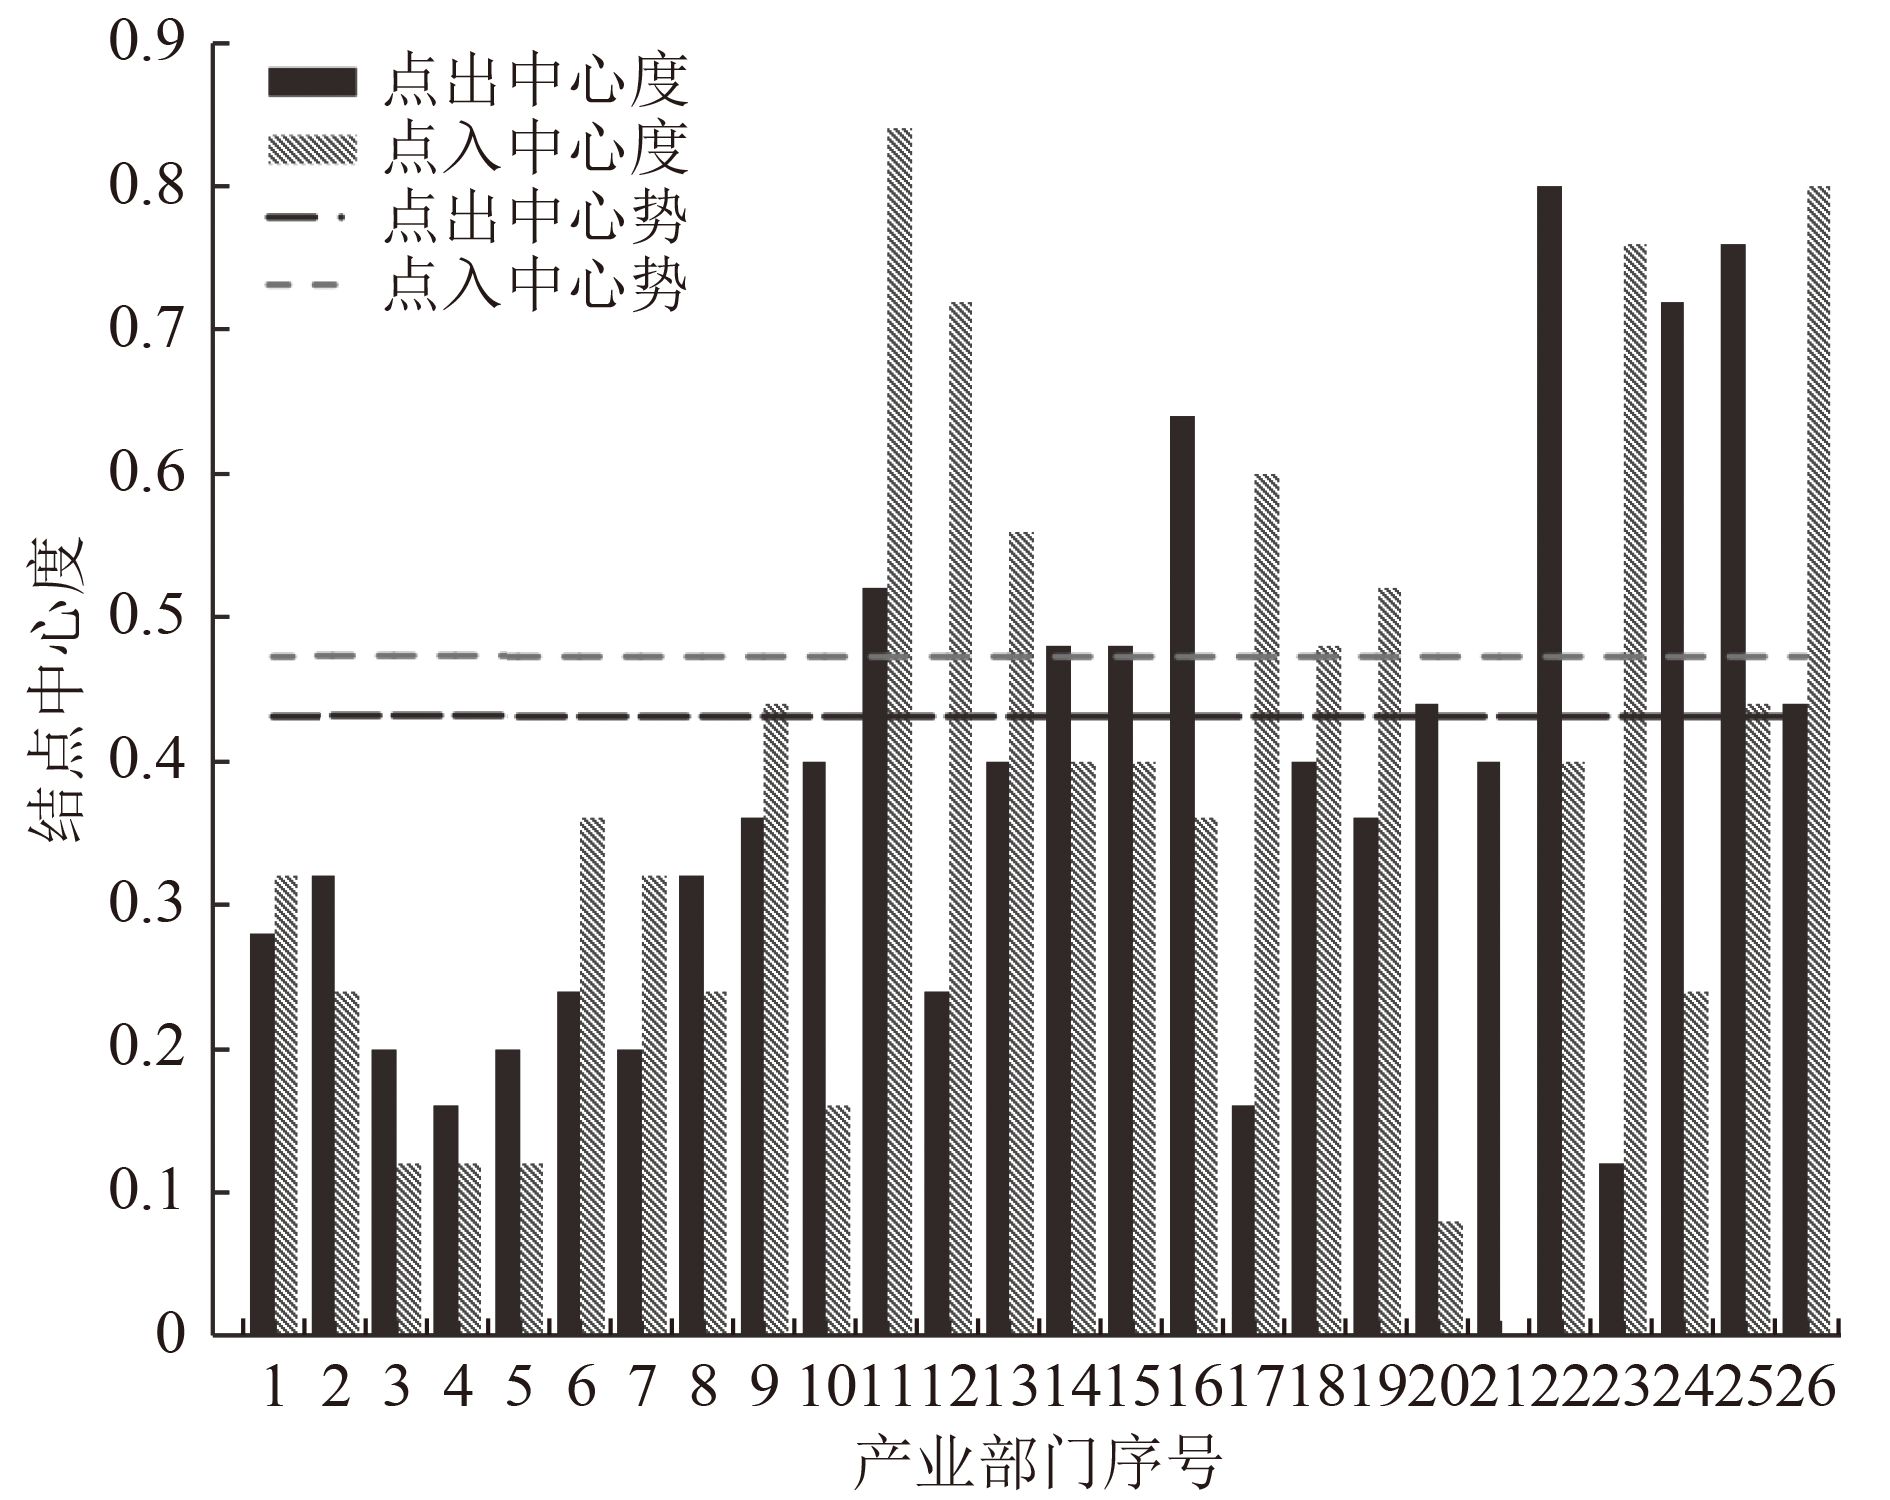
图 5 产业系统隐含碳流动网络结点中心度计算结果
Figure 5. Computing results of the degree centrality in the industrial system's embodied carbon flow network

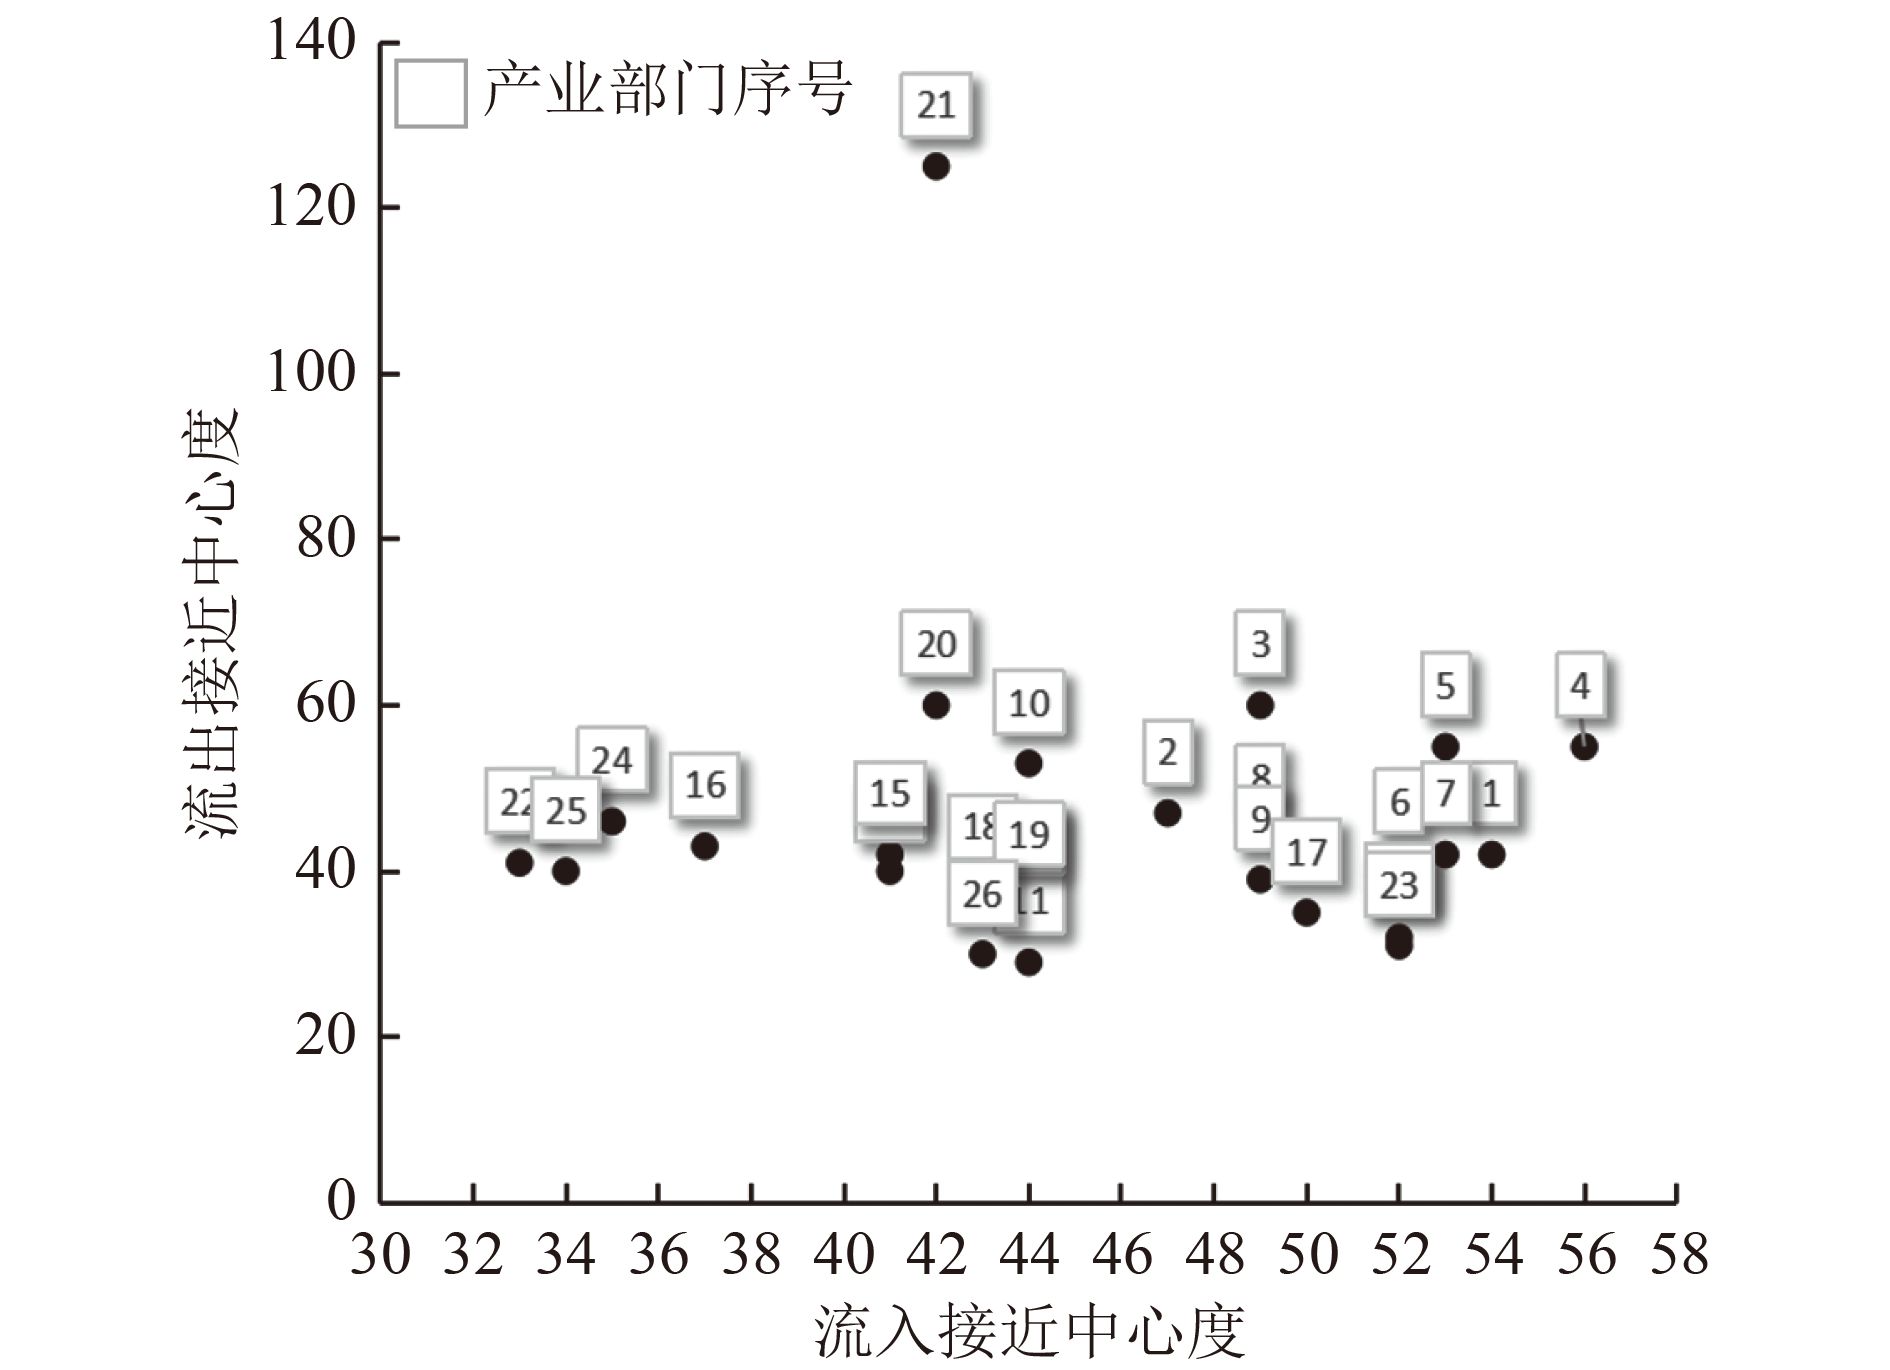
图 6 产业系统隐含碳流动网络接近中心度计算结果
Figure 6. Computing results of the clossness centrality in the industrial system’s embodied carbon flow network

图 7 产业系统隐含碳流动网络中介中心度
Figure 7. Computing results of the betweenness centrality in the industrial system’s embodied carbon flow network

图 8 产业系统隐含碳流动网络凝聚子群结构
Figure 8. Subgroup structure of the industrial system’s embodied carbon flow network
表 1 2018年我国26个产业部门直接碳排放量与直接碳排放强度
Table 1. Direct carbon emission and direct carbon intensity of 26 industrial sectors in China in 2018
序号 产业部门名称 国民经济
行业分类
代码直接碳
排放量/
(万/t)直接碳
排放强度/
(t/万元)占比/
%1 农林牧渔产品和
服务业01~05 9 465.98 0.085 0.98 2 煤炭开采和洗选业 06 5 844.94 0.247 0.61 3 石油和天然气
开采业07 4 005.59 0.310 0.42 4 金属矿采选业 08~09 1 219.51 0.110 0.13 5 非金属矿和其他矿采选业 10~12 1 494.09 0.156 0.16 6 食品和烟草业 13~16 5 692.34 0.049 0.59 7 纺织业 17~19 1 487.74 0.019 0.15 8 木材加工和家具
制造业20~21 245.16 0.009 0.03 9 造纸印刷和文教体育用品制造业 22~24 2 086.41 0.051 0.22 10 石油炼焦产品和核燃料加工业 25 14 238.91 0.316 1.48 11 化学产品制造业 26~29 20 427.44 0.131 2.12 12 非金属矿物制品业 30 109 365.31 1.478 11.37 13 金属冶炼和压延
加工业31~32 183 376.76 1.578 19.06 14 金属制品业 33 2 489.02 0.052 0.26 15 通用设备制造业 34 1 470.35 0.030 0.15 16 专用设备制造业 35 368.99 0.011 0.04 17 交通运输设备
制造业36~37 902.10 0.010 0.09 18 电气机械和器材
制造业38 225.31 0.004 0.02 19 计算机通信和其他电子设备制造业 39 360.67 0.004 0.04 20 仪器仪表制造业 40 37.75 0.004 0.00 21 其他制造业和废弃资源综合利用业 41~43 398.59 0.027 0.04 22 电力热力燃气及水生产和供应业 44~46 451 465.88 6.144 46.92 23 建筑业 47~50 4 500.75 0.017 0.47 24 批发和零售业 51~52 7 129.64 0.053 0.74 25 交通运输仓储和
邮政业53~60 74 135.91 0.658 7.71 26 其他服务业 61~96 59 676.85 0.089 6.20  下载: 导出CSV
表 2 产业系统隐含碳流动网络凝聚子群特征
Table 2. Subgroup characteristics of the embodied carbon flow network of the industrial system
子群 隐含碳流出
量/万t流出量
占比/%隐含碳流入
量/万t流入量
占比/%隐含碳滞留
量/万t滞留量
占比/%凝聚子群密度 调节者子群 接收者子群 直接碳排放子群 供应者子群 调节者子群 152 852 67.9 180 079 79.9 54 728 24.3 0.554 0.646 0.042 0.125 接收者子群 97 151 55.5 303 715 173.5 35 636 20.4 0.125 0.6 0 0.528 直接碳排放子群 23 580 86.7 33 036 121.4 1 578 5.8 0.375 0.333 0.2 0.167 供应者子群 320 488 59.9 77 241 14.4 132 926 24.9 0.667 1 0.306 0.567
下载: 导出CSV
-
[1] 陈林, 万攀兵.《京都议定书》及其清洁发展机制的减排效应: 基于中国参与全球环境治理微观项目数据的分析[J]. 经济研究,2019,54(3):55-71.CHEN L, WAN P B. The Kyoto protocol and its clean development mechanism's emission reduction effects: micro-project data on China's participation in global environmental governance[J]. Economic Research Journal,2019,54(3):55-71. [2] WANG Z, WEI L Y, NIU B B, et al. Controlling embedded carbon emissions of sectors along the supply chains: a perspective of the power-of-pull approach[J]. Applied Energy,2017,206:1544-1551. doi: 10.1016/j.apenergy.2017.09.108 [3] 赵巧芝, 闫庆友.基于投入产出的中国行业碳排放及减排效果模拟[J]. 自然资源学报,2017,32(9):1528-1541. doi: 10.11849/zrzyxb.20160875ZHAO Q Z, YAN Q Y. Simulation of industrial carbon emissions and its reduction in China based on input-output model[J]. Journal of Natural Resources,2017,32(9):1528-1541. doi: 10.11849/zrzyxb.20160875 [4] 姜华, 李艳萍, 高健, 等.关于统筹建立二氧化碳排放总量控制制度的思考[J]. 环境工程技术学报,2022,12(1):1-5. doi: 10.12153/j.issn.1674-991X.20210778JIANG H, LI Y P, GAO J, et al. Thoughts on the overall establishment of total carbon dioxide emission control system[J]. Journal of Environmental Engineering Technology,2022,12(1):1-5. doi: 10.12153/j.issn.1674-991X.20210778 [5] 严刚, 郑逸璇, 王雪松, 等.基于重点行业/领域的我国碳排放达峰路径研究[J]. 环境科学研究,2022,35(2):309-319. doi: 10.13198/j.issn.1001-6929.2021.11.13YAN G, ZHENG Y X, WANG X S, et al. Pathway for carbon dioxide peaking in China based on sectoral analysis[J]. Research of Environmental Sciences,2022,35(2):309-319. doi: 10.13198/j.issn.1001-6929.2021.11.13 [6] MACHADO G, SCHAEFFER R, WORRELL E. Energy and carbon embodied in the international trade of Brazil: an input-output approach[J]. Ecological Economics,2001,39(3):409-424. doi: 10.1016/S0921-8009(01)00230-0 [7] HOU H M, WANG J W, YUAN M N, et al. Estimating the mitigation potential of the Chinese service sector using embodied carbon emissions accounting[J]. Environmental Impact Assessment Review,2021,86:106510. doi: 10.1016/j.eiar.2020.106510 [8] XIA Q, TIAN G L, WU Z. Examining embodied carbon emission flow relationships among different industrial sectors in China[J]. Sustainable Production and Consumption,2022,29:100-114. doi: 10.1016/j.spc.2021.09.021 [9] LEONTIEF W W. Quantitative input and output relations in the economic systems of the United States[J]. The Review of Economics and Statistics,1936,18(3):105. doi: 10.2307/1927837 [10] WIEDMANN T, MINX J, BARRETT J, et al. Allocating ecological footprints to final consumption categories with input-output analysis[J]. Ecological Economics,2006,56(1):28-48. doi: 10.1016/j.ecolecon.2005.05.012 [11] 花瑞祥, 蓝艳.中国与东盟贸易的环境效应及其关键社会经济因子影响分析[J]. 环境科学研究,2020,33(9):2210-2218. doi: 10.13198/j.issn.1001-6929.2020.05.16HUA R X, LAN Y. Environmental effect of free trade between China and ASEAN and impact analysis of key socio-economic factors[J]. Research of Environmental Sciences,2020,33(9):2210-2218. doi: 10.13198/j.issn.1001-6929.2020.05.16 [12] 李思奇, 邬娜, 吴佳, 等.基于CiteSpace的中国产业转移研究热点与趋势分析[J]. 环境工程技术学报,2021,11(3):599-608.LI S Q, WU N, WU J, et al. Analysis of research hotspots and trends of China's industrial transfer based on CiteSpace[J]. Journal of Environmental Engineering Technology,2021,11(3):599-608. [13] PENG S J, ZHANG W C, SUN C W. ‘Environmental load displacement’ from the North to the South: a consumption-based perspective with a focus on China[J]. Ecological Economics,2016,128:147-158. doi: 10.1016/j.ecolecon.2016.04.020 [14] 李峰, 胡剑波.中国产业部门隐含碳排放变化的影响因素动态研究: 基于细分行业数据的实证分析[J]. 经济问题,2021(11):77-87.LI F, HU J B. Dynamic analysis of influential factors on the change of embodied carbon emissions in China's industrial sectors: empirical research based on the industrial data[J]. On Economic Problems,2021(11):77-87. [15] 杨桂元, 吴齐, 涂洋.中国省际碳排放的空间关联及其影响因素研究: 基于社会网络分析方法[J]. 商业经济与管理,2016(4):56-68. doi: 10.3969/j.issn.1000-2154.2016.04.006YANG G Y, WU Q, TU Y. Researchs of China's regional carbon emission spatial correlation and its determinants: based on the method of social network analysis[J]. Journal of Business Economics,2016(4):56-68. doi: 10.3969/j.issn.1000-2154.2016.04.006 [16] LI Z L, SUN L, GENG Y, et al. Examining industrial structure changes and corresponding carbon emission reduction effect by combining input-output analysis and social network analysis: a comparison study of China and Japan[J]. Journal of Cleaner Production,2017,162:61-70. doi: 10.1016/j.jclepro.2017.05.200 [17] HAO X Q, AN H Z, QI H, et al. Evolution of the exergy flow network embodied in the global fossil energy trade: based on complex network[J]. Applied Energy,2016,162:1515-1522. doi: 10.1016/j.apenergy.2015.04.032 [18] 郑航, 叶阿忠.城市群碳排放空间关联网络结构及其影响因素[J]. 中国环境科学,2022,42(5):2413-2422.ZHENG H, YE A Z. Spatial correlation network structure and influencing factors of carbon emission in urban agglomeration[J]. China Environmental Science,2022,42(5):2413-2422. [19] 闫敏, 孙慧.经济内循环视角下中国省域间隐含碳转移网络结构特征研究[J]. 生态经济,2022,38(2):13-21.YAN M, SUN H. Research on the network structural characteristics of China's provincial implicit carbon ttransfer from the perspective of economic internal circulation[J]. Ecological Economy,2022,38(2):13-21. [20] 丛建辉, 朱婧, 陈楠, 等.中国城市能源消费碳排放核算方法比较及案例分析: 基于“排放因子”与“活动水平数据”选取的视角[J]. 城市问题,2014(3):5-11.CONG J H, ZHU J, CHEN N, et al. Comparison and cases analysis to the accounting methods for carbon emission of China's urban energy consumption: from the perspectives of emission factors and activity-level data[J]. Urban Problems,2014(3):5-11. [21] 杨超, 吴立军, 李江风, 等.公平视角下中国地区碳排放权分配研究[J]. 资源科学,2019,41(10):1801-1813. doi: 10.18402/resci.2019.10.04YANG C, WU L J, LI J F, et al. Distribution of carbon emission rights in China based on equity perspective[J]. Resources Science,2019,41(10):1801-1813. doi: 10.18402/resci.2019.10.04 [22] ZHOU J G, LI Y S, HUO X J, et al. How to allocate carbon emission permits among China's industrial sectors under the constraint of carbon intensity?[J]. Sustainability,2019,11(3):914. doi: 10.3390/su11030914 [23] 林聚任. 社会网络分析: 理论、方法与应用[M]. 北京: 北京师范大学出版社, 2009. [24] SHI J L, LI H J, GUAN J H, et al. Evolutionary features of global embodied energy flow between sectors: a complex network approach[J]. Energy,2017,140:395-405. doi: 10.1016/j.energy.2017.08.124 [25] DU Q, XU Y D, WU M, et al. A network analysis of indirect carbon emission flows among different industries in China[J]. Environmental Science and Pollution Research International,2018,25(24):24469-24487. doi: 10.1007/s11356-018-2533-x [26] 沈丽珍, 汪侠, 甄峰.社会网络分析视角下城市流动空间网络的特征[J]. 城市问题,2017(3):28-34. doi: 10.13239/j.bjsshkxy.cswt.170304SHEN L Z, WANG Xia, ZHEN F. Characteristics of the networks of urban flow space from the point of view of social network analysis[J]. Urban Problems,2017(3):28-34. doi: 10.13239/j.bjsshkxy.cswt.170304 [27] 杨传明.新旧常态中国产业全碳足迹复杂网络比较[J]. 自然资源学报,2020,35(2):313-328. doi: 10.31497/zrzyxb.20200206YANG C M. A comparative study on the complex networks of China's industrial total carbon footprint in the new and old normal periods[J]. Journal of Natural Resources,2020,35(2):313-328. doi: 10.31497/zrzyxb.20200206 [28] GUAN Y R, SHAN Y L, HUANG Q, et al. Assessment to China's recent emission pattern shifts[J]. Earth's Future,2021,9(11):1-13. [29] 王陆.虚拟学习社区社会网络中的凝聚子群[J]. 中国电化教育,2009(8):22-28. ⊕ doi: 10.3969/j.issn.1006-9860.2009.08.005 -

 下载:
下载:


 点击查看大图
计量
- 文章访问数: 168
- HTML全文浏览量: 256
- PDF下载量: 33
- 被引次数: 0