

Pollution characteristics of volatile organic compounds above subtropical forest canopy in Lingnan and the influence of regional anthropogenic emissions
-
摘要:
大气中挥发性有机物(VOC)对空气质量、气候变化和人体健康均有重要影响。我国南方亚热带森林地区大气VOC浓度易受区域人为源排放影响。为定量探究其影响,于2019年8—9月在鼎湖山和车八岭自然保护区森林站点,通过无人机机载设备采集并分析了午后和晚上林冠层上方不同垂直高度的大气VOC和臭氧浓度,结合WRF-GC模型模拟和情景分析定量评价了区域人为源排放对林区大气环境的影响。结果表明:林区大气植物源VOC(BVOC)浓度低,人为源VOC(AVOC)浓度相对较高;车八岭AVOC浓度低于鼎湖山,BVOC浓度则高于鼎湖山,受区域人为源排放的影响较鼎湖山小;〔甲基丙烯醛(MACR)+甲基乙烯基酮(MVK)〕/异戊二烯比值高,说明2个站点BVOC大气转化均较快;2个站点不同采样高度上AVOC物种浓度差异均不显著,车八岭BVOC物种浓度差异也不显著,但鼎湖山异戊二烯和α-蒎烯在25和100 m处浓度差别较大,垂直湍流扩散可解释这一差异。此外,WRF-GC模型对鼎湖山林区大气污染物地表浓度的模拟效果较好。在关闭区域人为源情景下,鼎湖山异戊二烯日均模拟浓度增加4倍,臭氧浓度降低3倍,说明我国南部亚热带森林大气受区域人为源排放影响,BVOC向其氧化产物的转化加快,可能促进植物源二次有机气溶胶(SOA)的生成,而臭氧浓度超过植物耐受阈值,长期暴露会引起林区植被损伤。
Abstract:Volatile organic compounds (VOC) in the atmosphere have significant impacts on air quality, climate change, and human health. Atmospheric VOC concentrations in subtropical forests of southern China are affected by regional anthropogenic source emissions. To quantitatively explore the impacts of regional anthropogenic source emissions on forest atmosphere, VOC and ozone concentrations at different vertical levels above the canopy were collected by drone-based samplers in the afternoon and evening in Dinghushan (DHS) and Chebaling (CBL) Nature Reserves in August and September 2019 and were analyzed offline. Moreover, WRF-GC model simulations and scenario analysis were conducted to quantitatively evaluate the impact of regional anthropogenic source emissions on the atmosphere in forest areas. The results showed that the biogenic VOC (BVOC) concentrations were low and anthropogenic VOC (AVOC) concentrations were relatively high at both sites. Compared with DHS, the AVOC concentrations in CBL were lower and the BVOC concentrations were higher, which could be attributed to less anthropogenic influence by regional transport. The ratios of (MVK+MACR)/isoprene at both sites were high, indicating a rapid atmospheric conversion. No significant difference in AVOC concentrations at different sampling heights were found at both sites. BVOC concentrations in CBL were also similar for both of the sampling heights. In DHS, the concentrations of isoprene and α-pinene were significantly different for 25 and 100 m sampling heights, which may be explained by vertical eddy diffusion. Moreover, the surface concentrations of air pollutants in DHS were well simulated by WRF-GC model. Under the scenario of no anthropogenic emissions, the simulated daily average concentrations of isoprene increased by 4 times and that of ozone decreased by 3 times in DHS compared with the default setting. This result suggested that because of the influence of anthropogenic emissions in southern China, the conversion of BVOC to its oxidation products was accelerated to promote the formation of biogenic secondary organic aerosol (SOA). Meanwhile, the ozone concentrations were greater than the plant tolerance threshold, for which long-term exposure would cause vegetation damage in the forested area.
-
Key words:
- VOC /
- vertical distribution /
- anthropogenic effect /
- subtropical forest atmosphere /
- drone
-

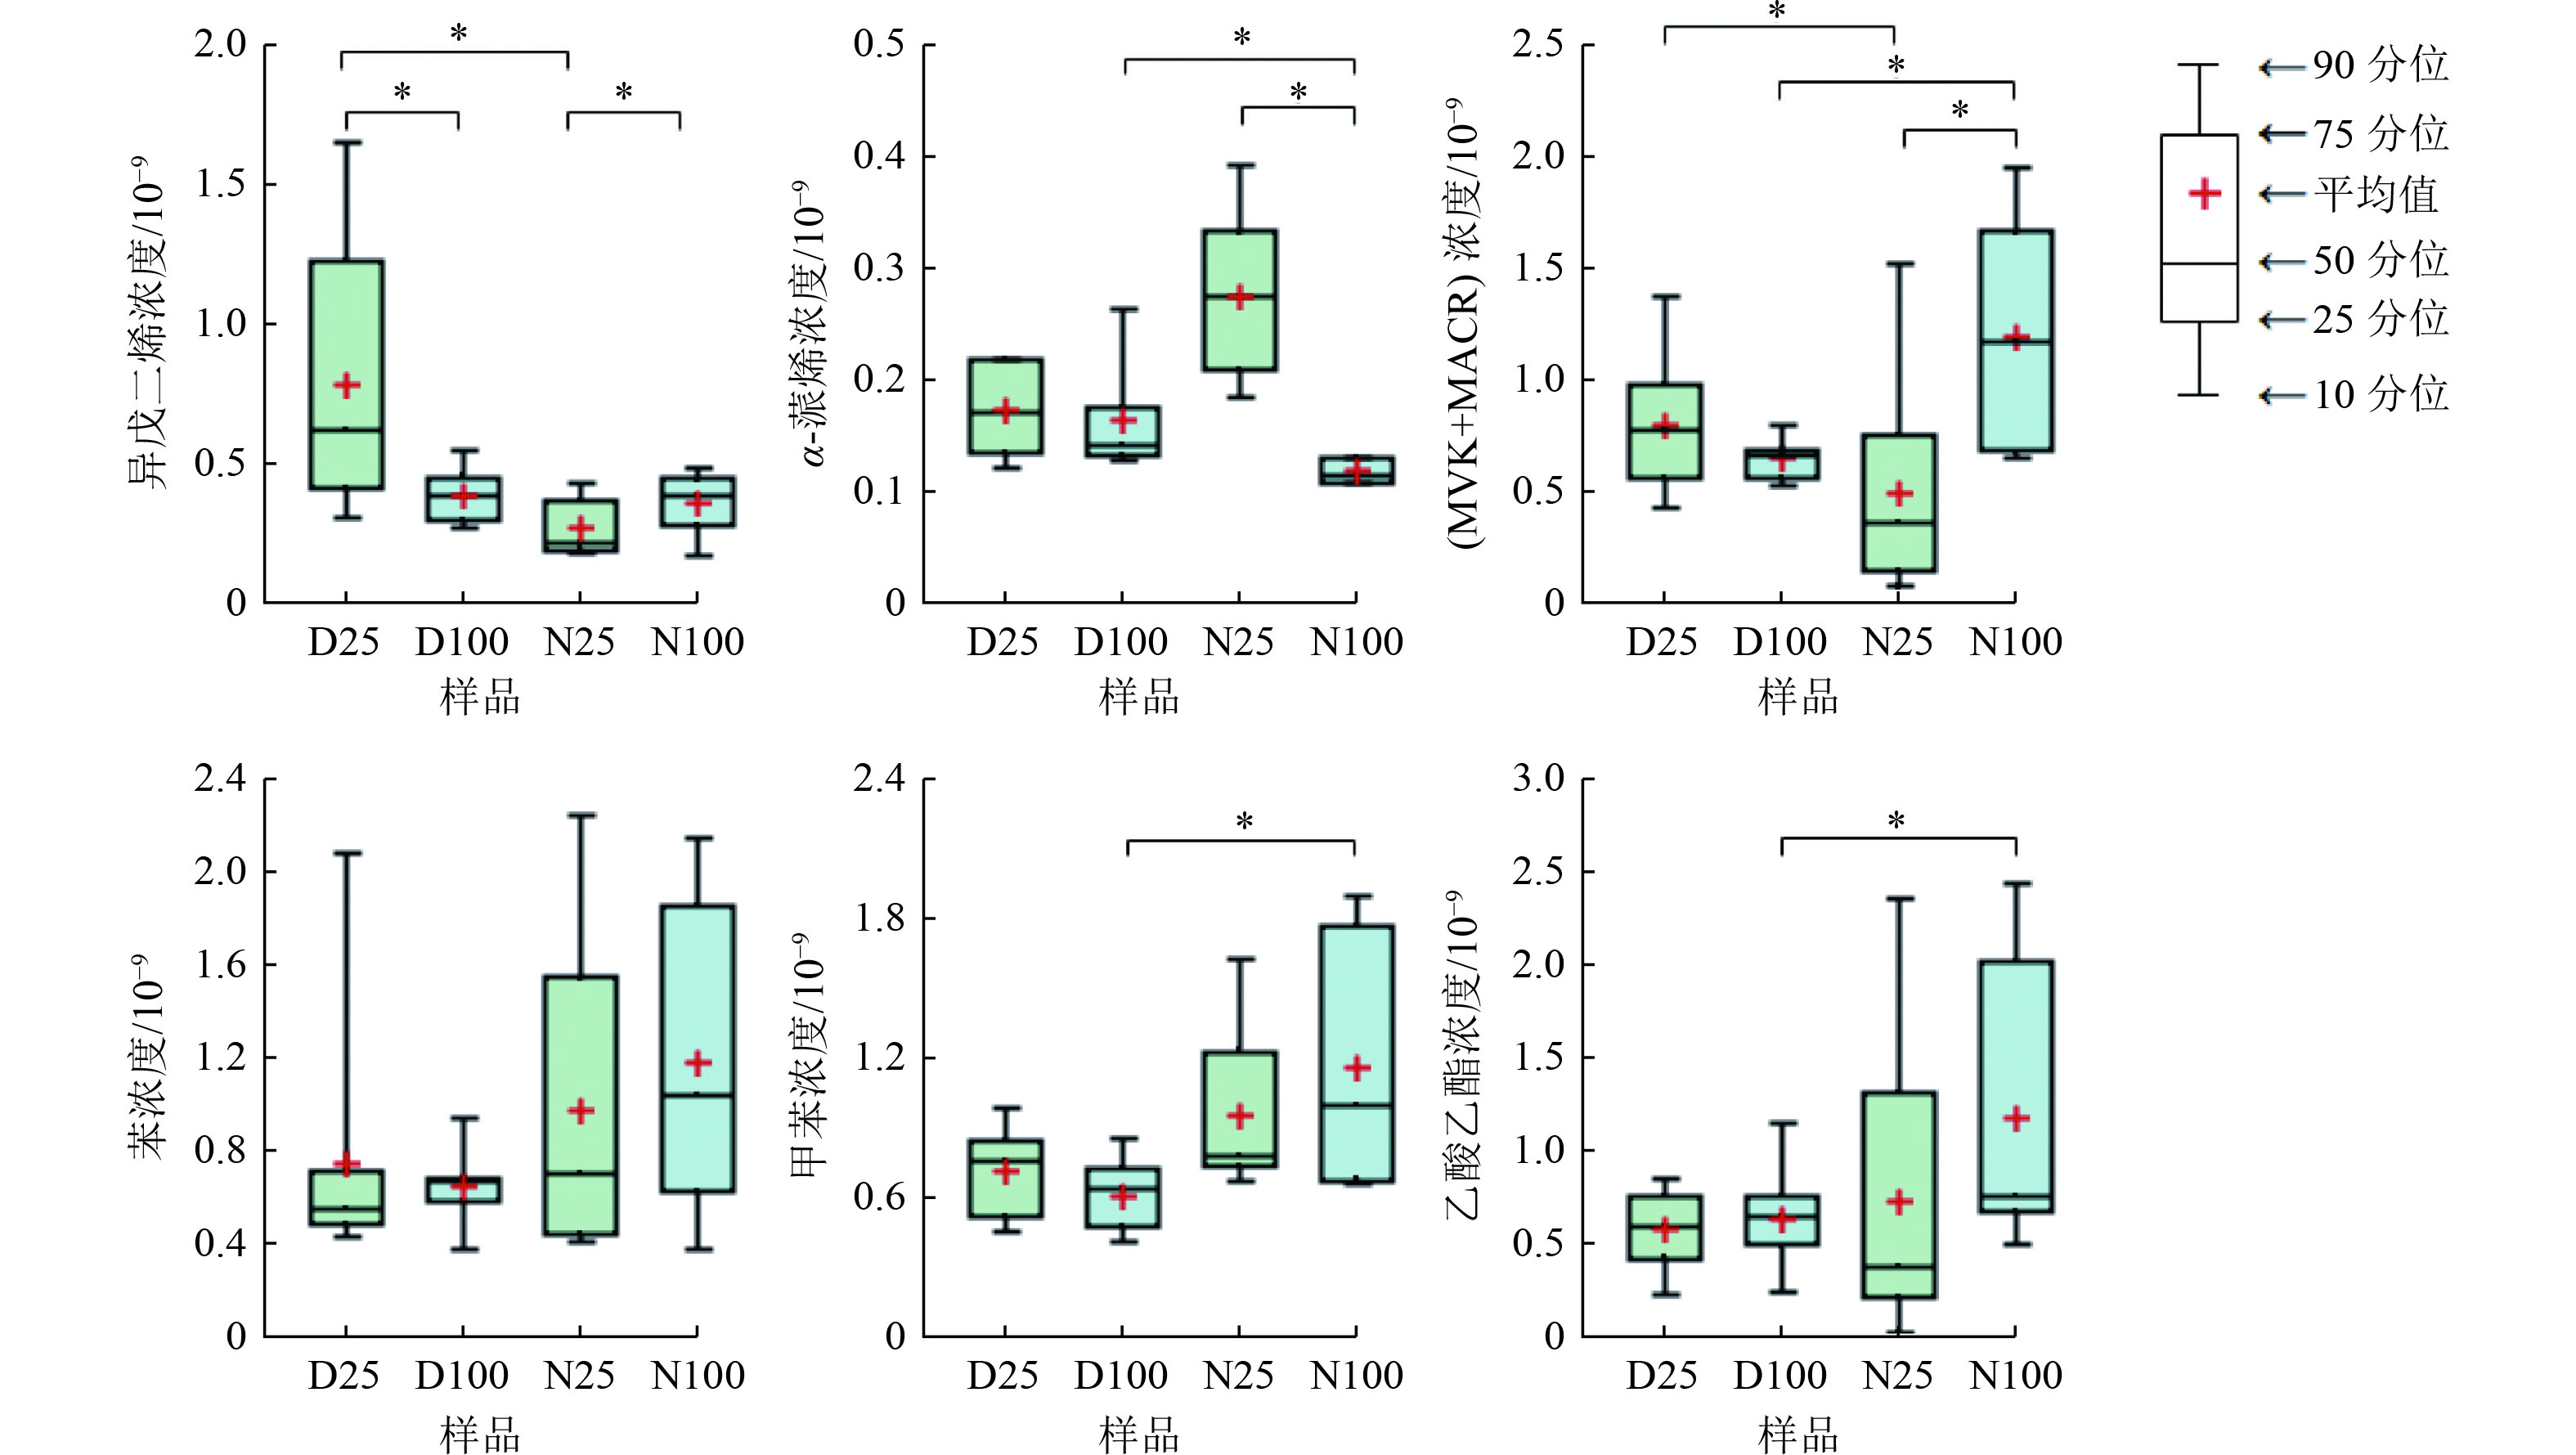
图 1 鼎湖山夏季典型VOC物种浓度箱型图
注:样品编号D代表日间采样,N代表夜间采样,25和100代表采样高度分别为25和100 m;*为P<0.05下差异显著。
Figure 1. Concentration box plots of typical VOC species measured at different sampling heights in summer in Dinghushan area

图 2 车八岭夏季典型VOC物种浓度箱型图
注:同图1。
Figure 2. Concentration box plots of typical VOC species measured at different sampling heights in summer in Chebaling area

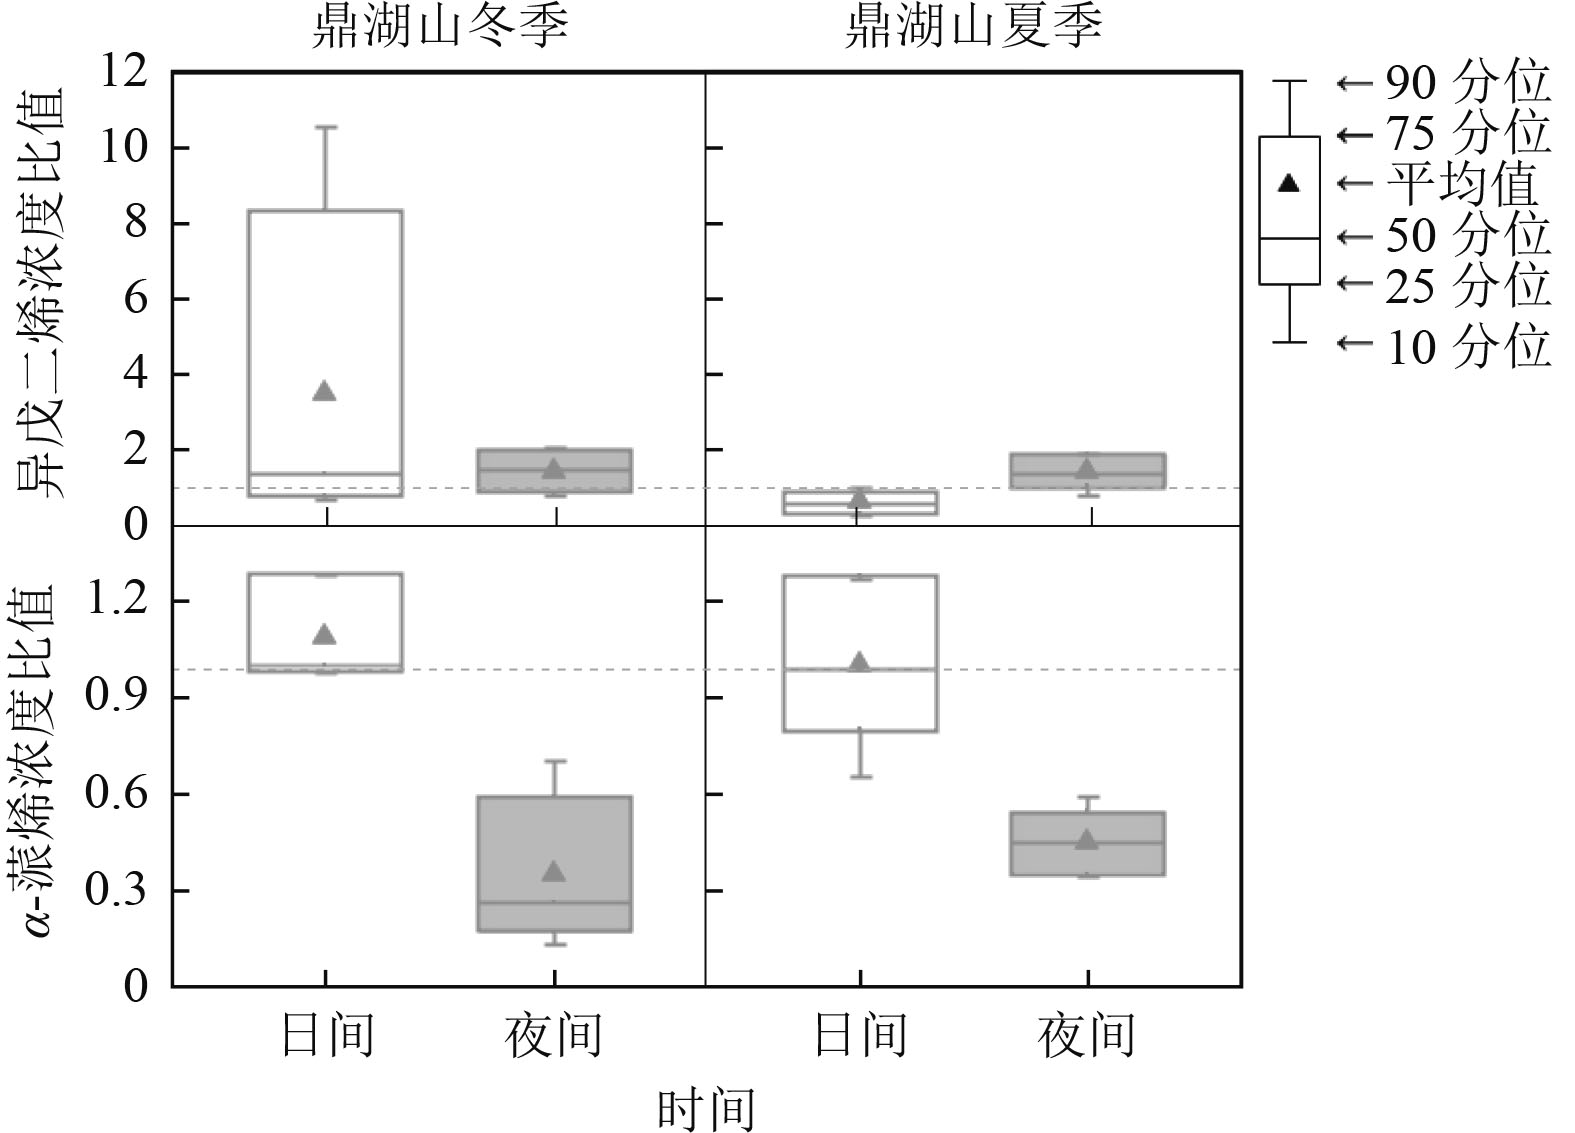
图 3 鼎湖山冬夏季异戊二烯和α-蒎烯分别在100与25 m处的浓度比值箱形图
Figure 3. 100 to 25 m concentration ratios for isoprene and α-pinene observed daily in winter and summer in Dinghushan area

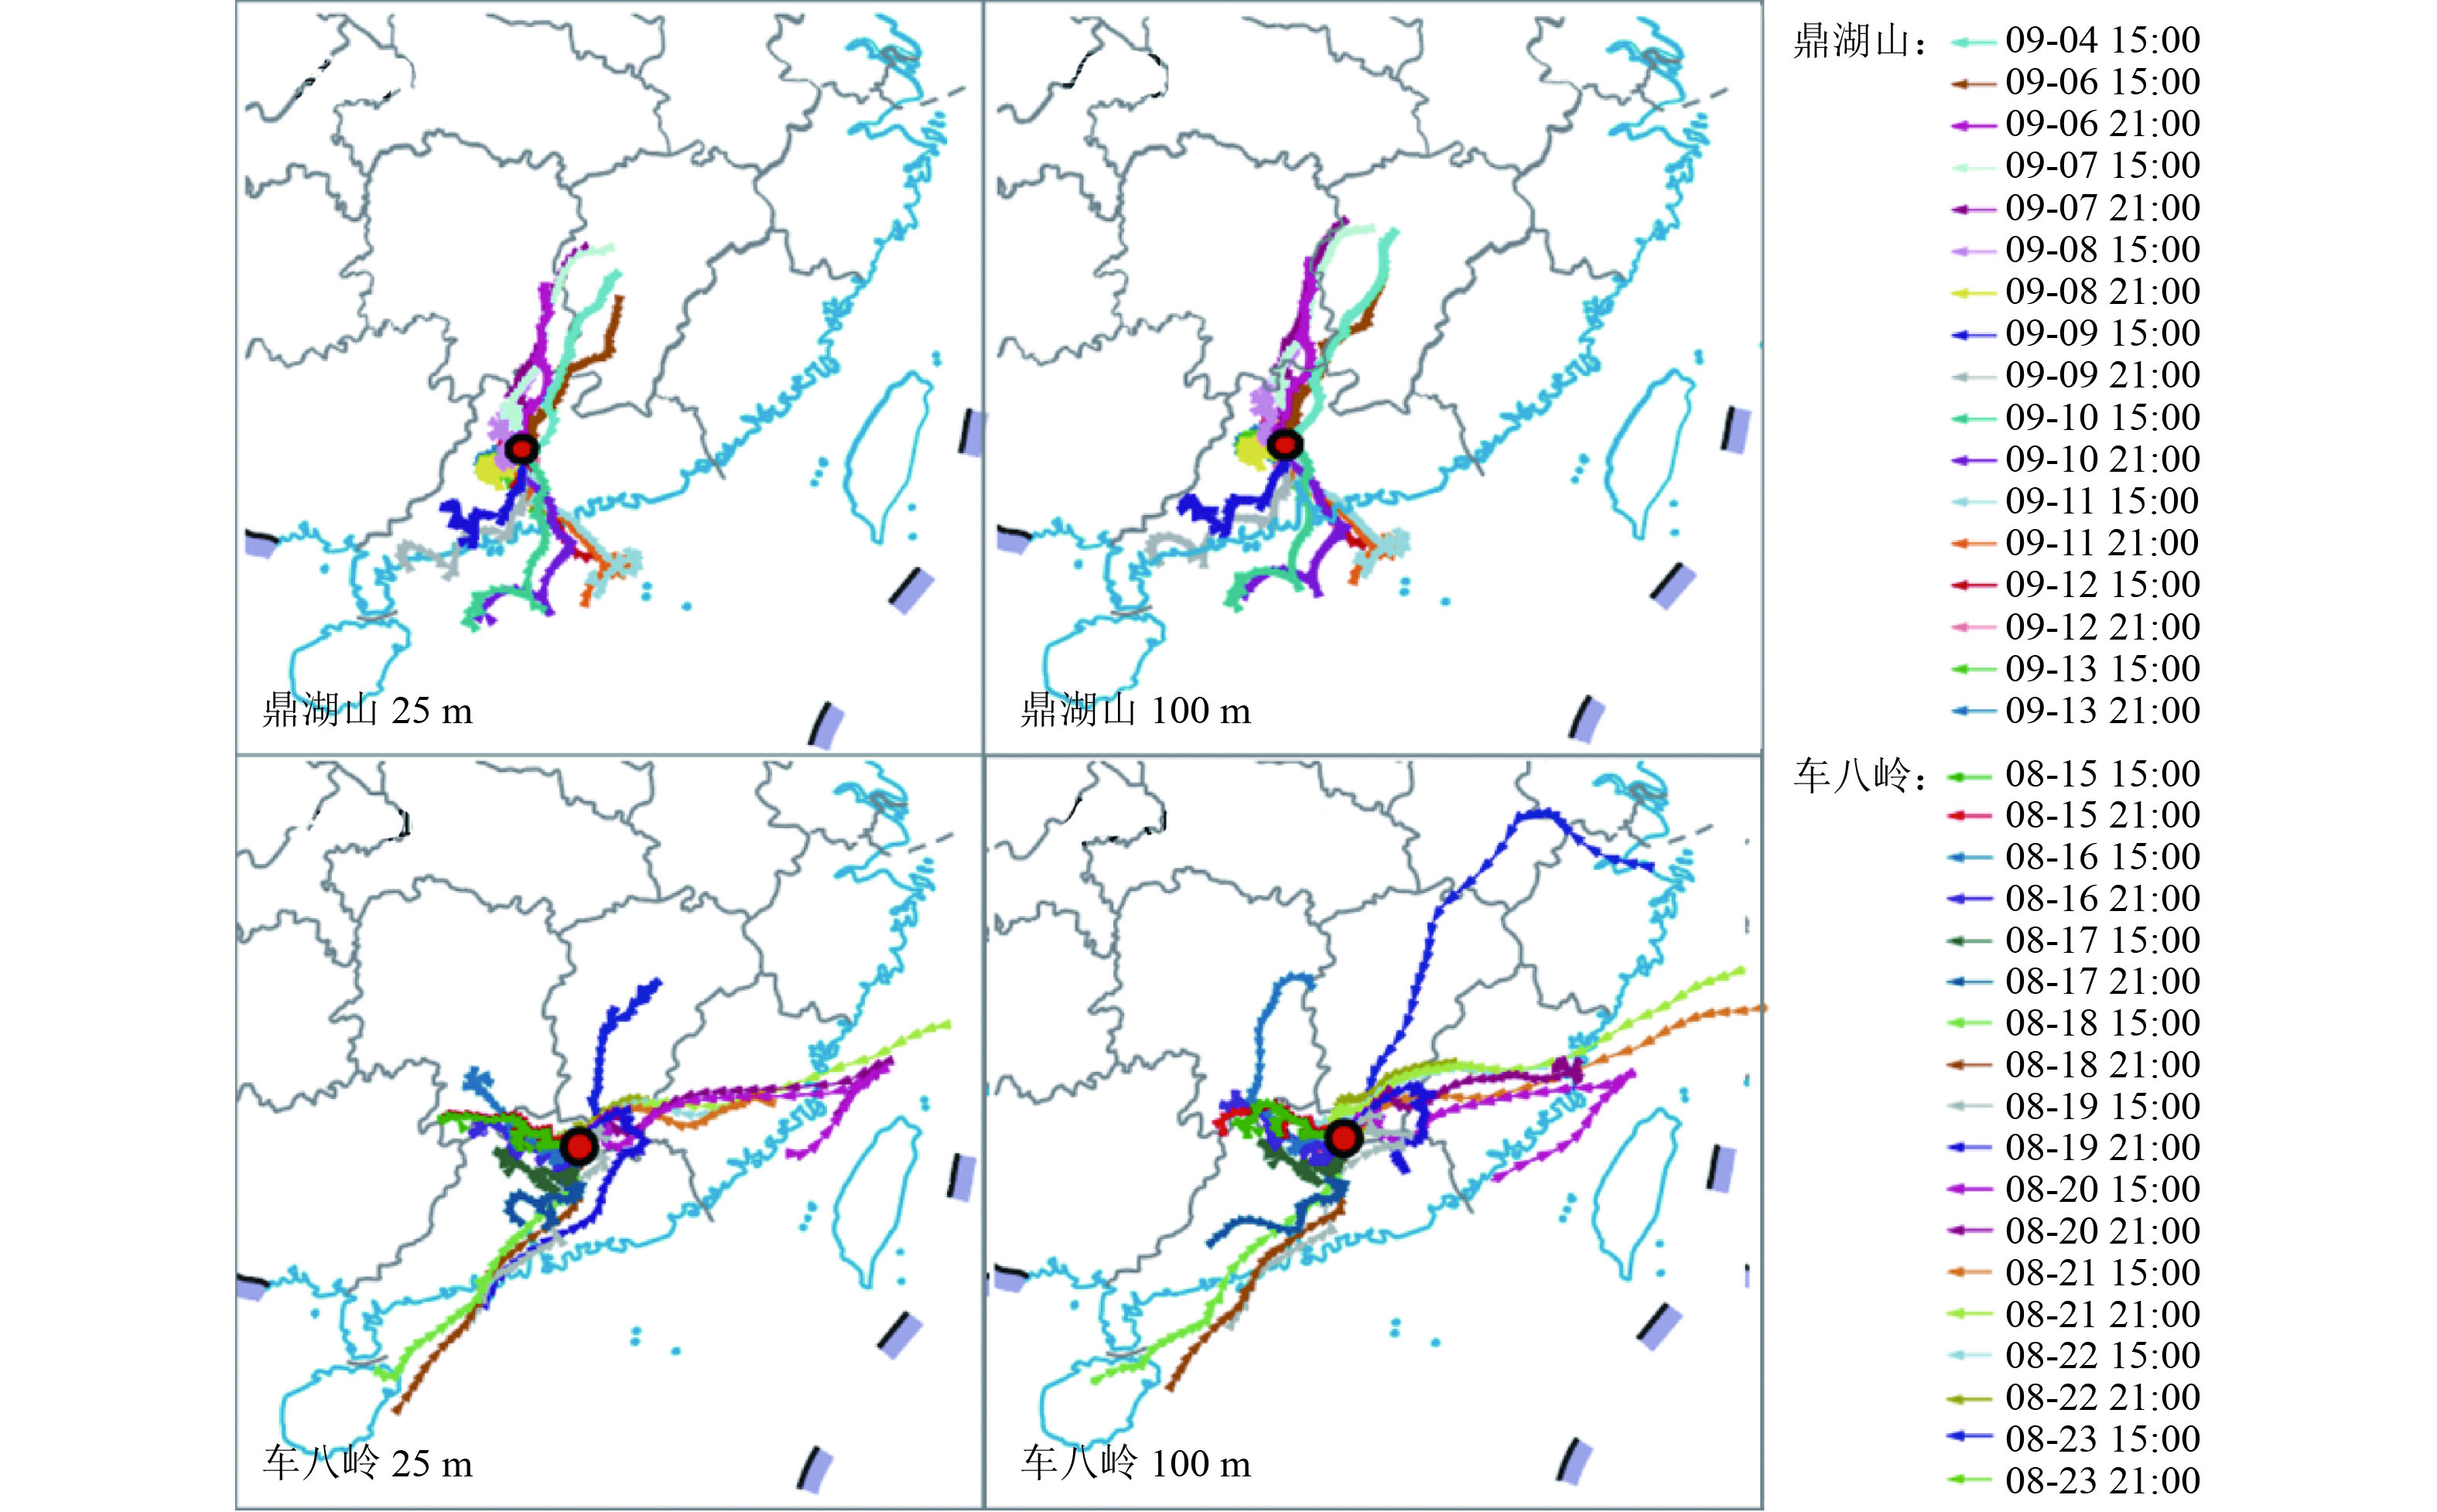
图 4 鼎湖山和车八岭站点25和100 m高度处气团72 h后向轨迹
注:基于GS (2019) 1697的标准地图制作。
Figure 4. 72-h backward trajectories of air masses at 25 and 100 m during sampling in summer at Dinghushan and Chebaling sites

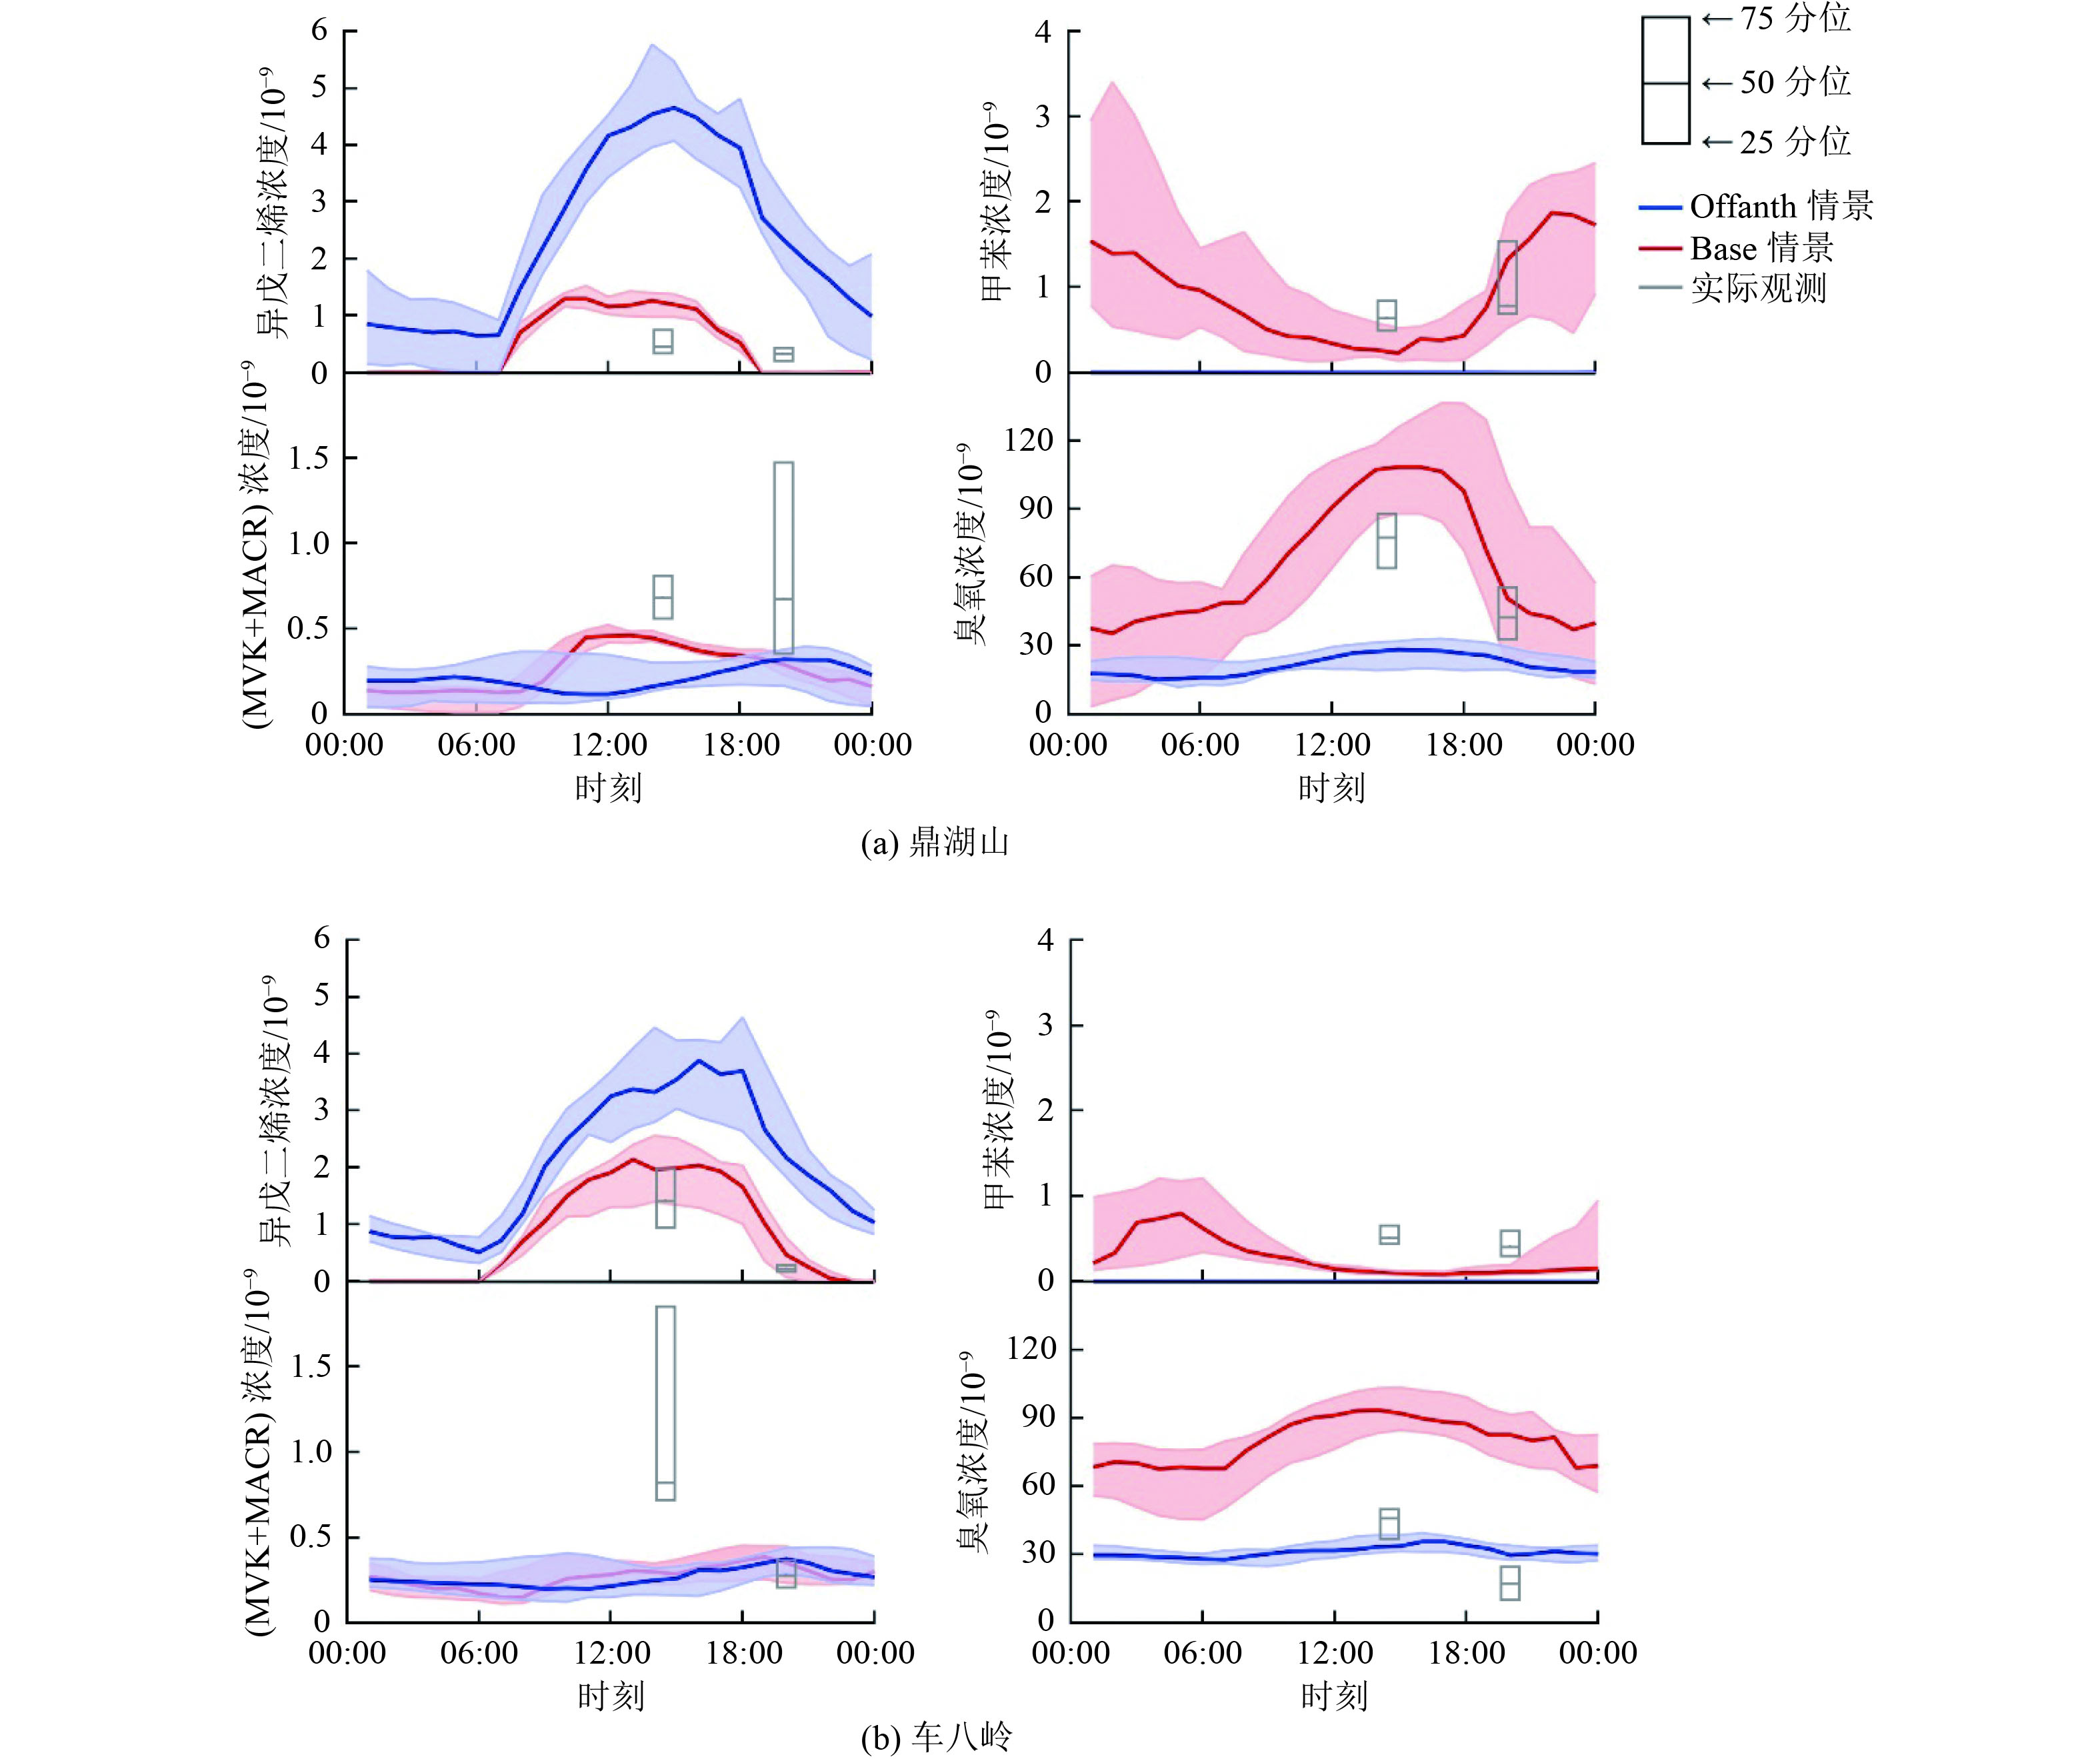
图 5 鼎湖山和车八岭站点各典型物种模拟浓度日变化和观测浓度
Figure 5. Diurnal patterns of concentrations of typical species simulated by WRF-GC compared with the observations at Dinghushan and Chebaling sites
表 1 中国南部亚热带森林地区VOC浓度比较
Table 1. Comparisons of VOC concentrations measured in subtropical forests in southern China
10−9 项目 季节 BVOC 芳香烃 OVOC 异戊
二烯α-蒎烯 苯 甲苯 邻二
甲苯苯乙烯 氯苯 MVK MACR 乙酸
乙酯甲基乙基酮 3-戊酮 甲基异丁基酮 R-诺蒎酮 本研究 鼎湖山 夏季 0.48±
0.340.18±
0.070.87±
0.560.84±
0.380.24±
0.170.25±
0.050.21±
0.020.50±
0.190.29±
0.340.77±
0.590.96±
0.860.16±
0.020.16±
0.150.23±
0.01车八岭 夏季 0.96±
1.020.24±
0.080.48±
0.200.51±
0.240.14±
0.110.21±
0.030.19±
0.020.51±
0.500.26±
0.330.18±
0.170.42±
0.470.13±
0.020.09±
0.090.22±
0.03鼎湖山 冬季[6] 0.05±
0.040.08±
0.101.54±
0.341.11±
0.970.26±
0.250.13±
0.170.02±
0.010.24±
0.130.11±
0.040.99±
0.621.02±
0.600.91±
0.08春季[5] 0.12±
0.800.32±
0.161.17±
0.543.09±
1.790.27±
0.18全年[4] 0.76±
0.500.33±
0.181.43±
0.512.27±
0.890.54±
0.320.30±
0.220.58±
0.25南岭[5] 夏季 0.29±
0.030.05±
0.010.15±
0.020.29±
0.020.07±
0.01人工林[2] 全年 0.80±
0.560.62±
0.29 下载: 导出CSV
表 2 森林地区异戊二烯平均浓度及(MVK+MACR)/异戊二烯
Table 2. Isoprene average concentrations and concentration ratios of (MVK+MACR)/isoprene in different forest areas
气候区 海拔/m 测量方法 采样时段 距离地面高度/m 异戊二烯浓度/10−9 (MVK+MACR)/异戊二烯 亚热带(23.17°N)(本研究鼎湖山) 36 吸附管采样+TD-GC-MS 夏季日间 25 0.79±0.49 1.33±0.71 100 0.39±0.10 1.75±0.50 夏季夜间 25 0.27±0.10 1.75±1.16 100 0.37±0.11 3.30±0.78 亚热带 (24.72°N)(本研究车八岭) 359 吸附管采样+TD-GC-MS 夏季日间 25 1.73±0.94 0.63±0.26 100 0.73±0.20 0.94±0.30 夏季夜间 25 0.21±0.05 1.23±0.34 100 0.35±0.21 1.55±0.82 亚热带(23.17°N)[6] 36 吸附管采样+TD-GC-MS 冬季日间 25 0.03±0.01 7.46±2.93 100 0.08±0.08 7.57±4.72 冬季夜间 25 0.03±0.01 11.78±3.79 100 0.04±0.02 10.83±7.51 亚热带(24.70°N)[5] 1 690 在线气相色谱质谱 日间 151) 0.38±0.05 1.9±0.5 夜间 0.16±0.04 6.3±1.4 温带(43.11°N)[24] 24 PTR-MS 全天 12 0.42 0.79 地中海(43.93°N)[25] 650 PTR-MS 日间 10 2.8±1.5 0.4±0.1 夜间 0.4±0.2 0.28±0.05 热带(2.59°S)[26] 103 吸附管采样+GC-FID 日间 52 3.4 0.31±0.07 热带(2.14°S)[27] PTR-MS 日间 40 6.17 0.29 79 4.80 0.39 夜间 40 1.44 79 1.58 0.88 1)为距林冠层上层距离。
下载: 导出CSV
-
[1] SHRIVASTAVA M, CAPPA C D, FAN J W, et al. Recent advances in understanding secondary organic aerosol: implications for global climate forcing[J]. Reviews of Geophysics,2017,55(2):509-559. doi: 10.1002/2016RG000540 [2] BAI J H, GUENTHER A, TURNIPSEED A, et al. Seasonal and interannual variations in whole-ecosystem BVOC emissions from a subtropical plantation in China[J]. Atmospheric Environment,2017,161:176-190. doi: 10.1016/j.atmosenv.2017.05.002 [3] TANG J H, CHAN L Y, CHAN C Y, et al. Characteristics and diurnal variations of NMHCs at urban, suburban, and rural sites in the Pearl River Delta and a remote site in South China[J]. Atmospheric Environment,2007,41(38):8620-8632. doi: 10.1016/j.atmosenv.2007.07.029 [4] WU F K, YU Y, SUN J, et al. Characteristics, source apportionment and reactivity of ambient volatile organic compounds at Dinghu Mountain in Guangdong Province, China[J]. Science of the Total Environment,2016,548/549:347-359. doi: 10.1016/j.scitotenv.2015.11.069 [5] GONG D C, WANG H, ZHANG S Y, et al. Low-level summertime isoprene observed at a forested mountaintop site in Southern China: implications for strong regional atmospheric oxidative capacity[J]. Atmospheric Chemistry and Physics,2018,18(19):14417-14432. doi: 10.5194/acp-18-14417-2018 [6] LI Y W, LIU B, YE J H, et al. Unmanned aerial vehicle measurements of volatile organic compounds over a subtropical forest in China and implications for emission heterogeneity[J]. Acs Earth and Space Chemistry,2021,5(2):247-256. doi: 10.1021/acsearthspacechem.0c00271 [7] LÜ S J, GONG D C, DING Y Z, et al. Elevated levels of glyoxal and methylglyoxal at a remote mountain site in Southern China: prompt in situ formation combined with strong regional transport[J]. Science of the Total Environment,2019,672:869-882. doi: 10.1016/j.scitotenv.2019.04.020 [8] 黄忠良, 孔国辉, 何道泉.鼎湖山植物群落多样性的研究[J]. 生态学报,2000,20(2):193-198. doi: 10.3321/j.issn:1000-0933.2000.02.004HUANG Z L, KONG G H, HE D Q. Plant community diversity in Dinghushan Nature Reserve[J]. Acta Ecologica Sinica,2000,20(2):193-198. doi: 10.3321/j.issn:1000-0933.2000.02.004 [9] MAO T, WANG Y S, XU H H, et al. A study of the atmospheric VOCs of Mount Tai in June 2006[J]. Atmospheric Environment,2009,43(15):2503-2508. doi: 10.1016/j.atmosenv.2009.02.013 [10] XUE L K, WANG T, GUO H, et al. Sources and photochemistry of volatile organic compounds in the remote atmosphere of Western China: results from the Mt. Waliguan Observatory[J]. Atmospheric Chemistry and Physics,2013,13(17):8551-8567. doi: 10.5194/acp-13-8551-2013 [11] FENG X, LIN H P, FU T M, et al. WRF-GC (v2.0): online two-way coupling of WRF (v3.9. 1.1) and GEOS-Chem (v12.7. 2) for modeling regional atmospheric chemistry-meteorology interactions[J]. Geoscientific Model Development,2021,14(6):3741-3768. doi: 10.5194/gmd-14-3741-2021 [12] ZHENG B, TONG D, LI M, et al. Trends in China's anthropogenic emissions since 2010 as the consequence of clean air actions[J]. Atmospheric Chemistry and Physics,2018,18(19):14095-14111. doi: 10.5194/acp-18-14095-2018 [13] HUANG Z J, ZHONG Z M, SHA Q G, et al. An updated model-ready emission inventory for Guangdong Province by incorporating big data and mapping onto multiple chemical mechanisms[J]. Science of the Total Environment,2021,769:144535. doi: 10.1016/j.scitotenv.2020.144535 [14] GIGLIO L, RANDERSON J T, van der WERF G R. Analysis of daily, monthly, and annual burned area using the fourth-generation global fire emissions database (GFED4)[J]. Journal of Geophysical Research:Biogeosciences,2013,118(1):317-328. doi: 10.1002/jgrg.20042 [15] GUENTHER A B, JIANG X, HEALD C L, et al. The Model of Emissions of Gases and Aerosols from Nature version 2.1 (MEGAN2.1): an extended and updated framework for modeling biogenic emissions[J]. Geoscientific Model Development,2012,5(6):1471-1492. doi: 10.5194/gmd-5-1471-2012 [16] 王思行, 彭钰雯, 齐吉朋, 等.挥发性有机物(VOCs)的不同化学去除途径: 城市与区域站点的对比[J]. 环境科学学报,2020,40(7):2311-2322.WANG S H, PENG Y W, QI J P, et al. Different chemical removal pathways of volatile organic compounds (VOCs): comparison of urban and regional sites[J]. Acta Scientiae Circumstantiae,2020,40(7):2311-2322. [17] LERDAU M, KELLER M. Controls on isoprene emission from trees in a subtropical dry forest[J]. Plant, Cell and Environment,1997,20(5):569-578. doi: 10.1111/j.1365-3040.1997.00075.x [18] FEHSENFELD F, CALVERT J, FALL R, et al. Emissions of volatile organic compounds from vegetation and the implications for atmospheric chemistry[J]. Global Biogeochemical Cycles,1992,6(4):389-430. doi: 10.1029/92GB02125 [19] DRAXLER R R, HESS G D. Description of the HYSPLIT_4 modelling system[J]. NOAA Technical Memorandum, 1997. [20] STEIN A F, DRAXLER R R, ROLPH G D, et al. NOAA's HYSPLIT atmospheric transport and dispersion modeling system[J]. Bulletin of the American Meteorological Society,2015,96(12):2059-2077. doi: 10.1175/BAMS-D-14-00110.1 [21] 王艳, 柴发合, 刘厚凤, 等.长江三角洲地区大气污染物水平输送场特征分析[J]. 环境科学研究,2008,21(1):22-29.WANG Y, CHAI F H, LIU H F, et al. Analysis on the characteristics of horizontal transport of the atmospheric pollutant over the Yangtze Delta[J]. Research of Environmental Sciences,2008,21(1):22-29. [22] 沈洪艳, 吕宗璞, 师华定, 等.基于HYSPLIT模型的京津冀地区大气污染物输送的路径分析[J]. 环境工程技术学报,2018,8(4):359-366.SHEN H Y, LÜ Z P, SHI H D, et al. Route analysis of air pollutant transport in Beijing-Tianjin-Hebei region based on HYSPLIT model[J]. Journal of Environmental Engineering Technology,2018,8(4):359-366. [23] 王红果, 孙永旺, 王芳, 等.济源市疫情防控期间VOCs的变化特征、臭氧生成潜势及来源解析[J]. 环境科学学报,2021,41(3):761-769.WANG H G, SUN Y W, WANG F, et al. Characteristics, ozone formation potential and source apportionment of VOCs during epidemic prevention in Jiyuan[J]. Acta Scientiae Circumstantiae,2021,41(3):761-769. [24] JORDAN C, FITZ E, HAGAN T, et al. Long-term study of VOCs measured with PTR-MS at a rural site in New Hampshire with urban influences[J]. Atmospheric Chemistry and Physics,2009,9(14):4677-4697. doi: 10.5194/acp-9-4677-2009 [25] ZANNONI N, GROS V, LANZA M, et al. OH reactivity and concentrations of biogenic volatile organic compounds in a Mediterranean forest of downy oak trees[J]. Atmospheric Chemistry and Physics,2016,16(3):1619-1636. doi: 10.5194/acp-16-1619-2016 [26] KUHN U, ANDREAE M O, AMMANN C, et al. Isoprene and monoterpene fluxes from Central Amazonian rainforest inferred from tower-based and airborne measurements, and implications on the atmospheric chemistry and the local carbon budget[J]. Atmospheric Chemistry and Physics,2007,7(11):2855-2879. doi: 10.5194/acp-7-2855-2007 [27] YÁÑEZ-SERRANO A M, NÖLSCHER A C, WILLIAMS J, et al. Diel and seasonal changes of biogenic volatile organic compounds within and above an Amazonian rainforest[J]. Atmospheric Chemistry and Physics,2015,15(6):3359-3378. doi: 10.5194/acp-15-3359-2015 [28] TANI A, TOBE S, SHIMIZU S. Uptake of methacrolein and methyl vinyl ketone by tree saplings and implications for forest atmosphere[J]. Environmental Science & Technology,2010,44(18):7096-7101. [29] MARTIN S T, ANDREAE M O, ALTHAUSEN D, et al. An overview of the Amazonian aerosol characterization experiment 2008 (AMAZE-08)[J]. Atmospheric Chemistry and Physics,2010,10(23):11415-11438. doi: 10.5194/acp-10-11415-2010 [30] FUHRER J, SKÄRBY L, ASHMORE M R. Critical levels for ozone effects on vegetation in Europe[J]. Environmental Pollution,1997,97(1/2):91-106. □ -

 下载:
下载:


 点击查看大图
计量
- 文章访问数: 319
- HTML全文浏览量: 142
- PDF下载量: 59
- 被引次数: 0