

Trends analysis and targets study of the water quality in Tianjin coastal waters
-
摘要:
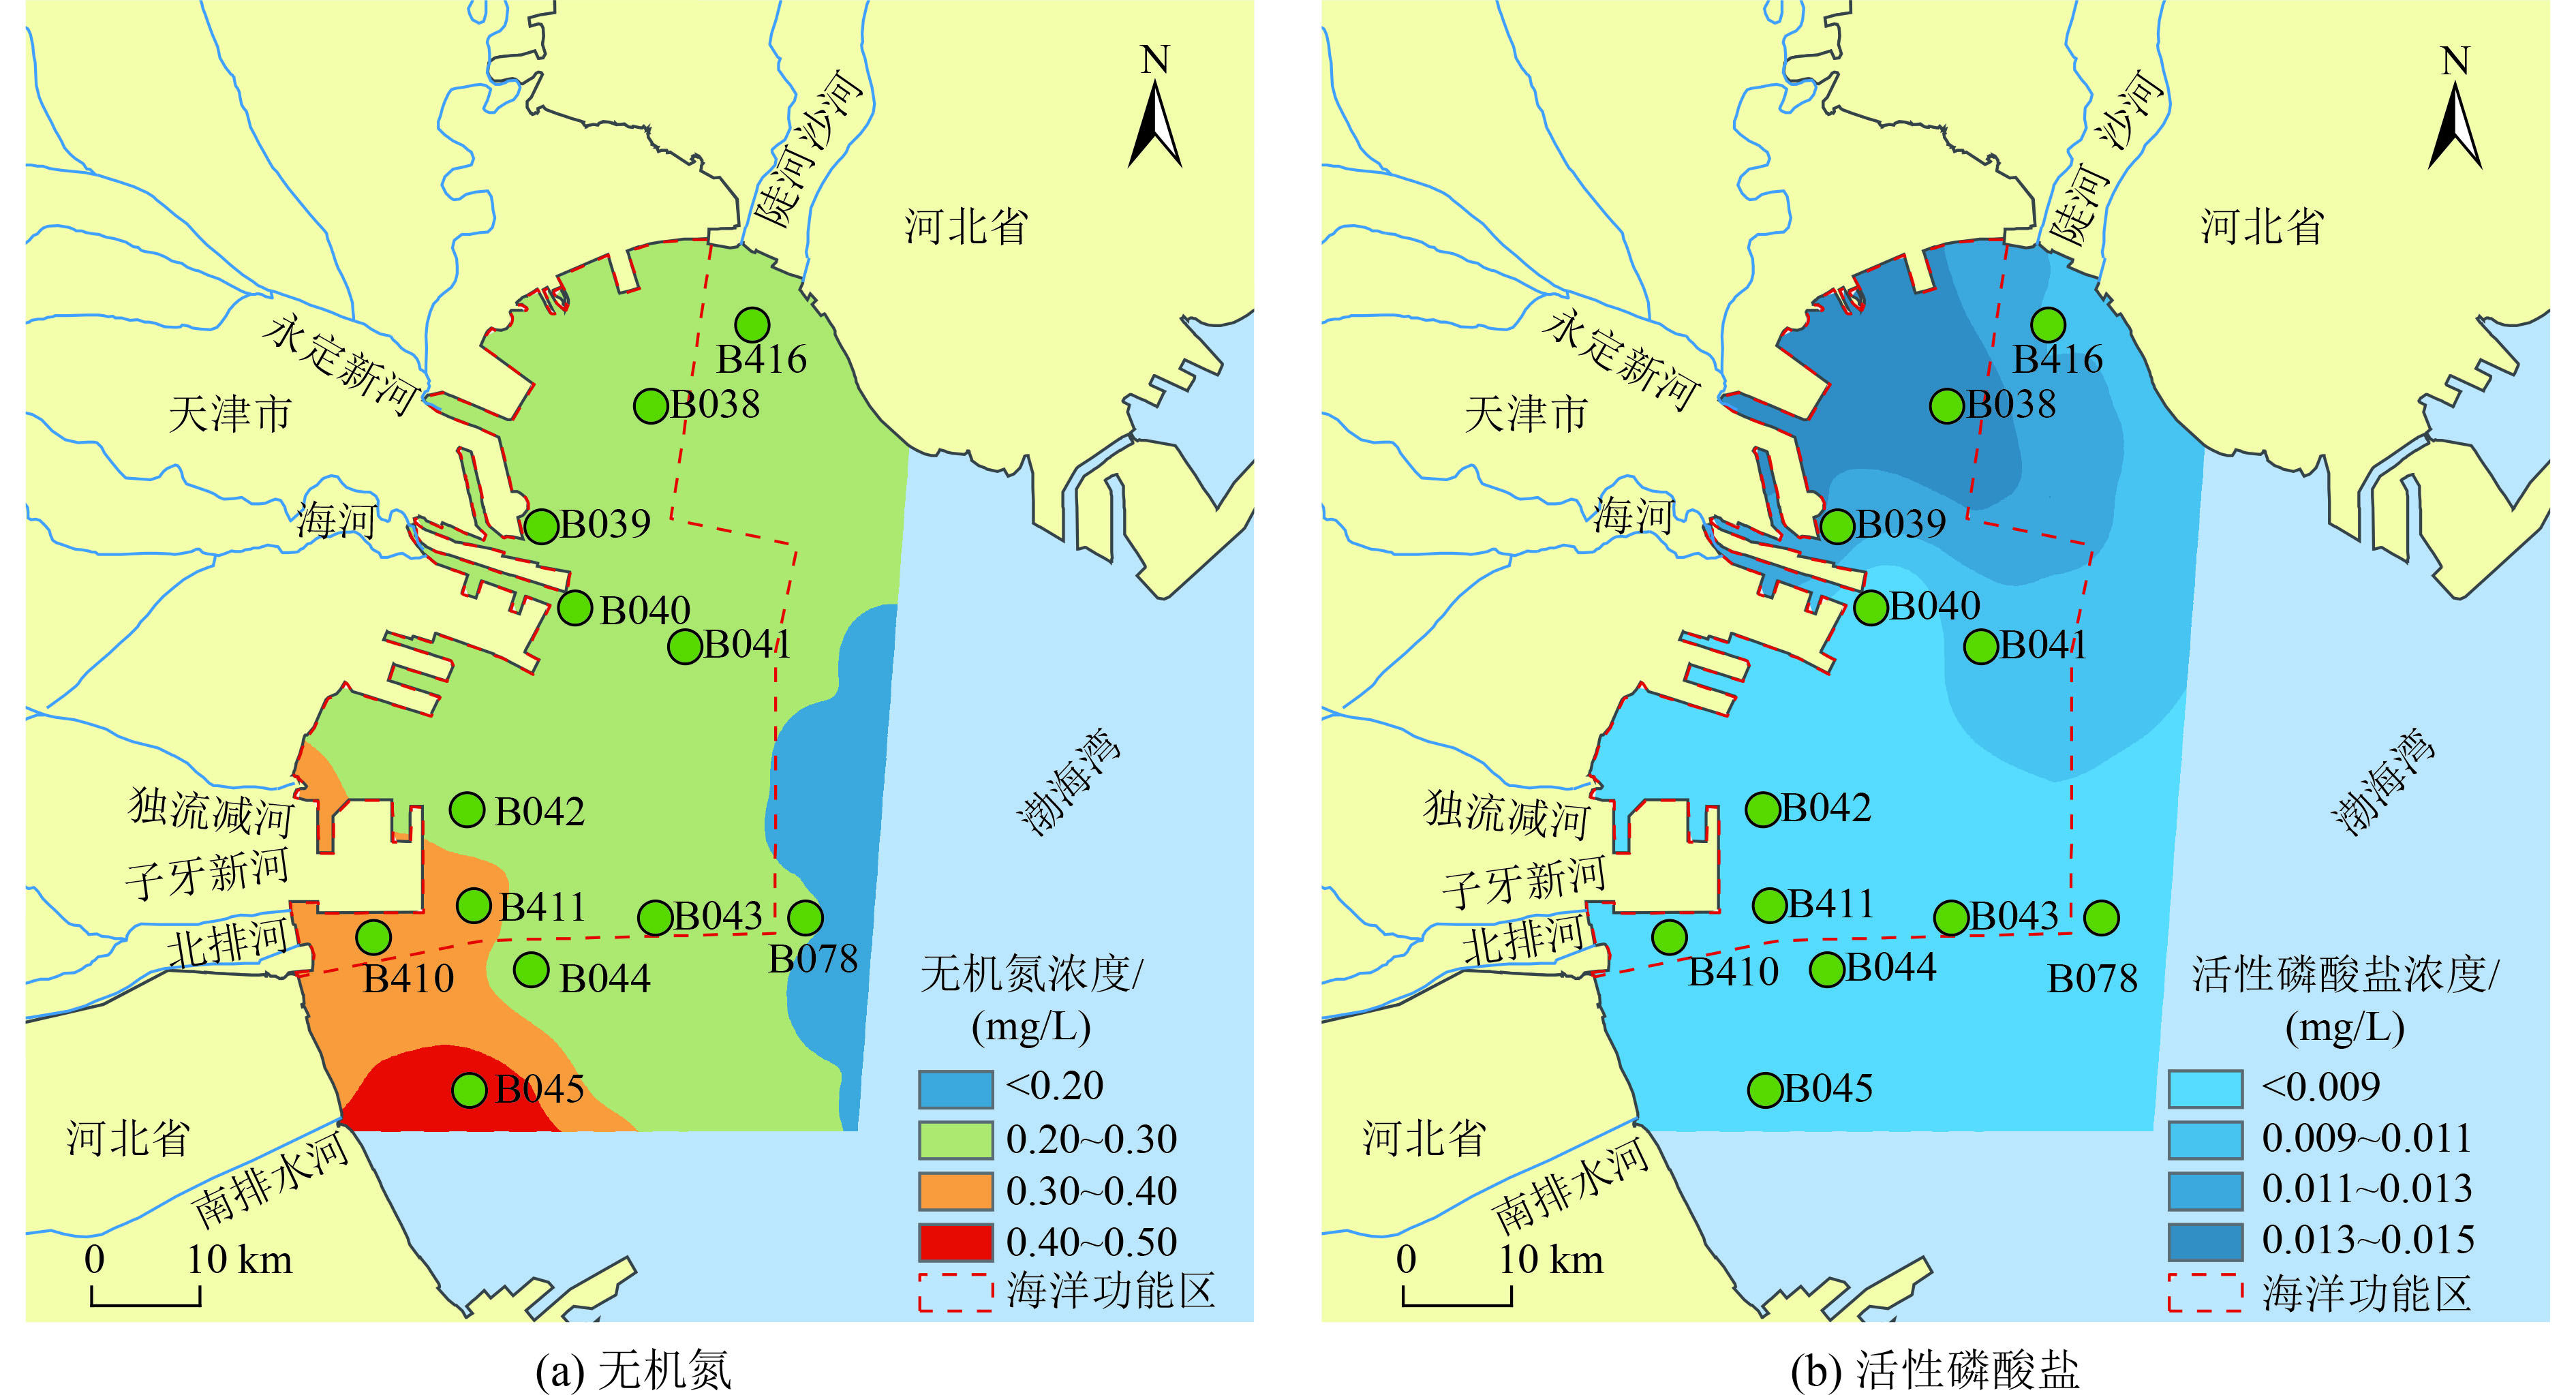
掌握海域水质变化趋势、制定科学合理的水质目标,有助于精准实施重点海域排污总量控制,制定有效的污染物管控政策。利用广义加性模型(GAM),基于2007—2018年天津市近岸海域营养盐浓度及降水量数据,建立水质变化趋势分析模型和水质目标确定方法,在评估天津市近岸海域12个监测站位无机氮和活性磷酸盐浓度变化趋势的基础上,提出天津市近岸海域水质控制目标,并分析水质目标的合理性和可达性。结果表明:2013—2018年与2007—2012年相比,天津市近岸海域无机氮浓度总体呈下降趋势,下降比例为13.19%,95%的置信区间为−30.37%~3.96%;活性磷酸盐浓度总体呈上升趋势,上升比例为7.01%,95%的置信区间为−11.43%~25.45%,尚未恢复到2007—2012年的平均水平;提出2025年天津市近岸海域无机氮、活性磷酸盐二者综合优良水质比例达到75%的控制目标;将天津市近岸海域划分成7个区域,建议据此实施海域水质分区管理,进一步加强农业面源污染防治,强化流域上下游协同治理和省际水污染联防联治,持续改善天津市近岸海域水质。
Abstract:Mastering the seawater quality variation trends and formulating scientific and reasonable water quality targets are helpful to the accurate implementation of the total amount control of pollutant discharge in key sea areas and formulate effective pollutant control policies. The water quality variation trends analysis model and the water quality target determination method were established by using the Generalized Additive Models (GAM), based on the nutrient concentration and precipitation data of Tianjin coastal waters for the 2007-2018 periods. The water quality targets of Tianjin coastal waters were put forward on the basis of evaluating the variation trend of inorganic nitrogen and reactive phosphate concentrations at 12 stations in Tianjin coastal waters, and the rationality and accessibility of the water quality targets were analyzed. The results showed that the concentration of inorganic nitrogen in the coastal waters of Tianjin generally showed a downward trend, with a decreasing ratio of 13.19% and a 95% confidence interval ranging from −30.37% to 3.96% in 2013-2018, compared with 2007-2012. The concentration of reactive phosphorus generally showed an upward trend, with an upward ratio of 7.01% and a 95% confidence interval ranging from −11.43% to 25.45%, which had not recovered to the average level from 2007 to 2012. It was proposed that the proportion of Grade Ⅰ-Ⅱ water quality of inorganic nitrogen and reactive phosphorus in Tianjin coastal waters would reach 75% in 2025. It was suggested to implement water quality zoning management, and the Tianjin coastal waters were divided into seven zones. Other measures such as further strengthening the prevention and control of agricultural non-point sources pollution, enhancing the upstream and downstream collaborative governance and inter provincial joint prevention and treatment of water pollution were also proposed to continually improve the water quality of the coastal waters of Tianjin.
-
Key words:
- water quality target /
- generalized additive model /
- trend analysis /
- nutrient /
- Tianjin coastal waters
-

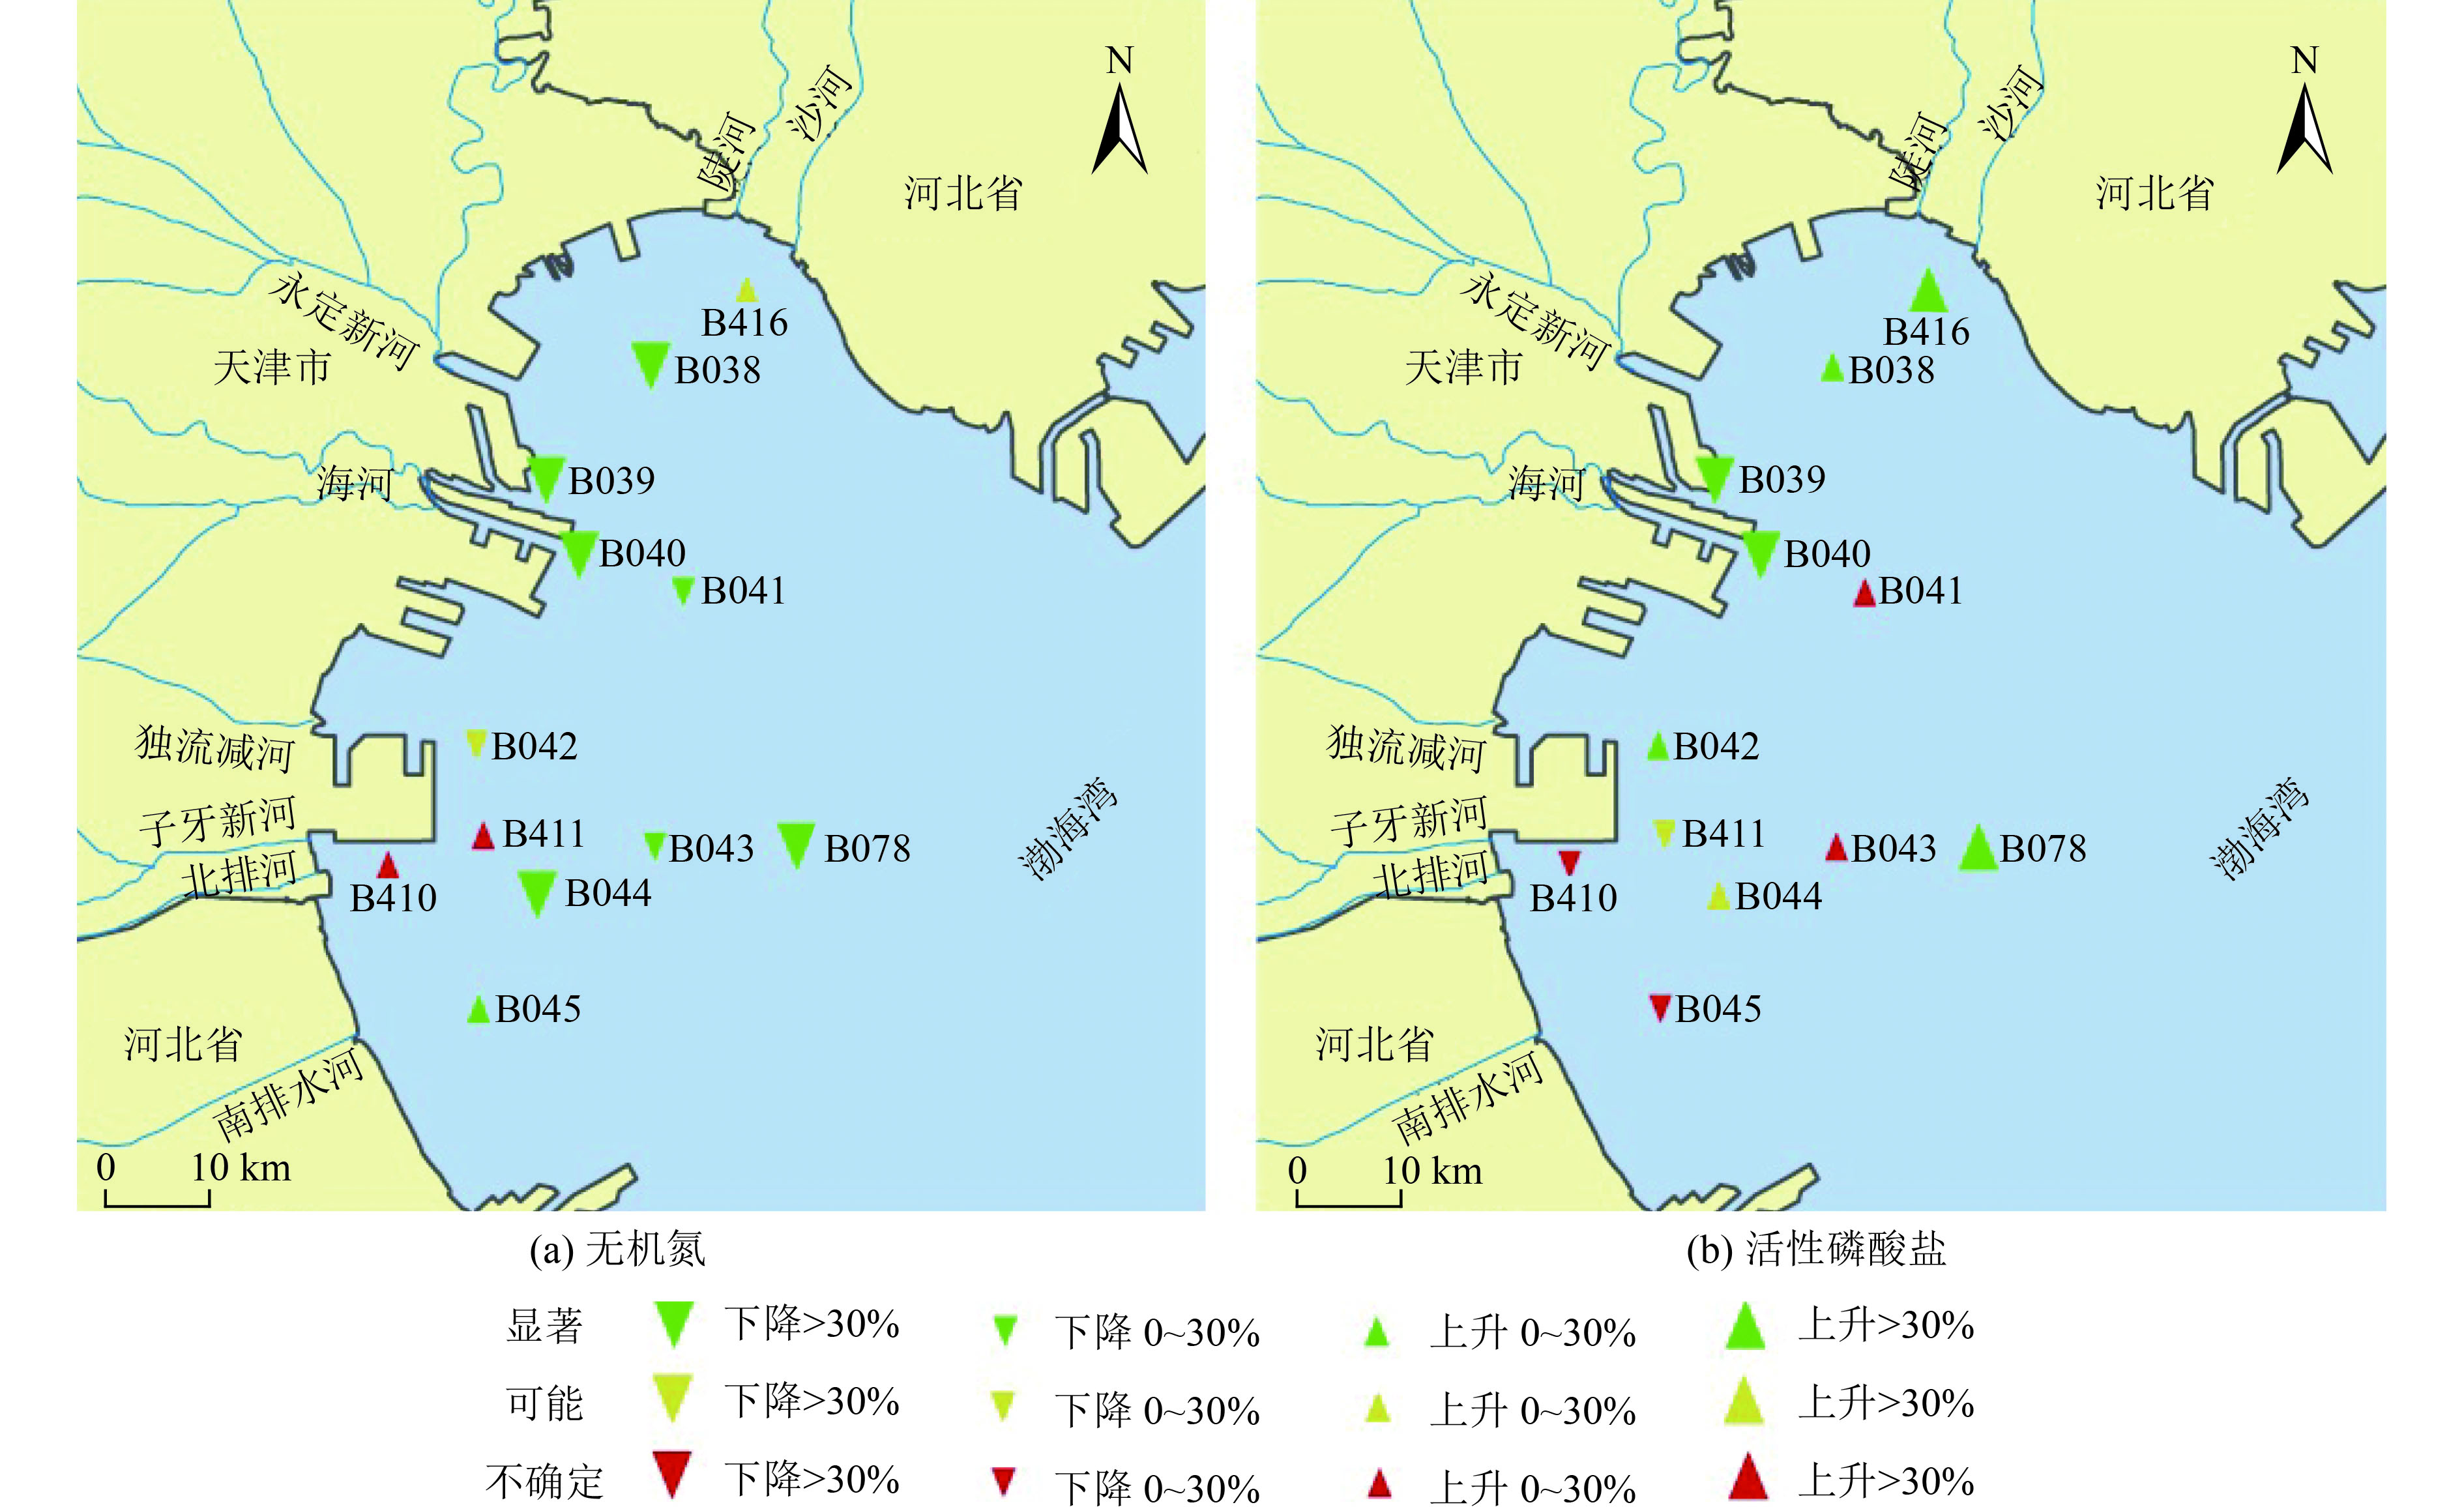
图 3 2007—2018年无机氮、活性磷酸盐浓度变化趋势
注:绿色三角形表示P≤0.05(显著);黄色三角形表示0.05<P≤0.25(可能);红色三角形表示P>0.25(不确定)。
Figure 3. Variation of concentration of inorganic nitrogen and reactive phosphorus in 2007-2018

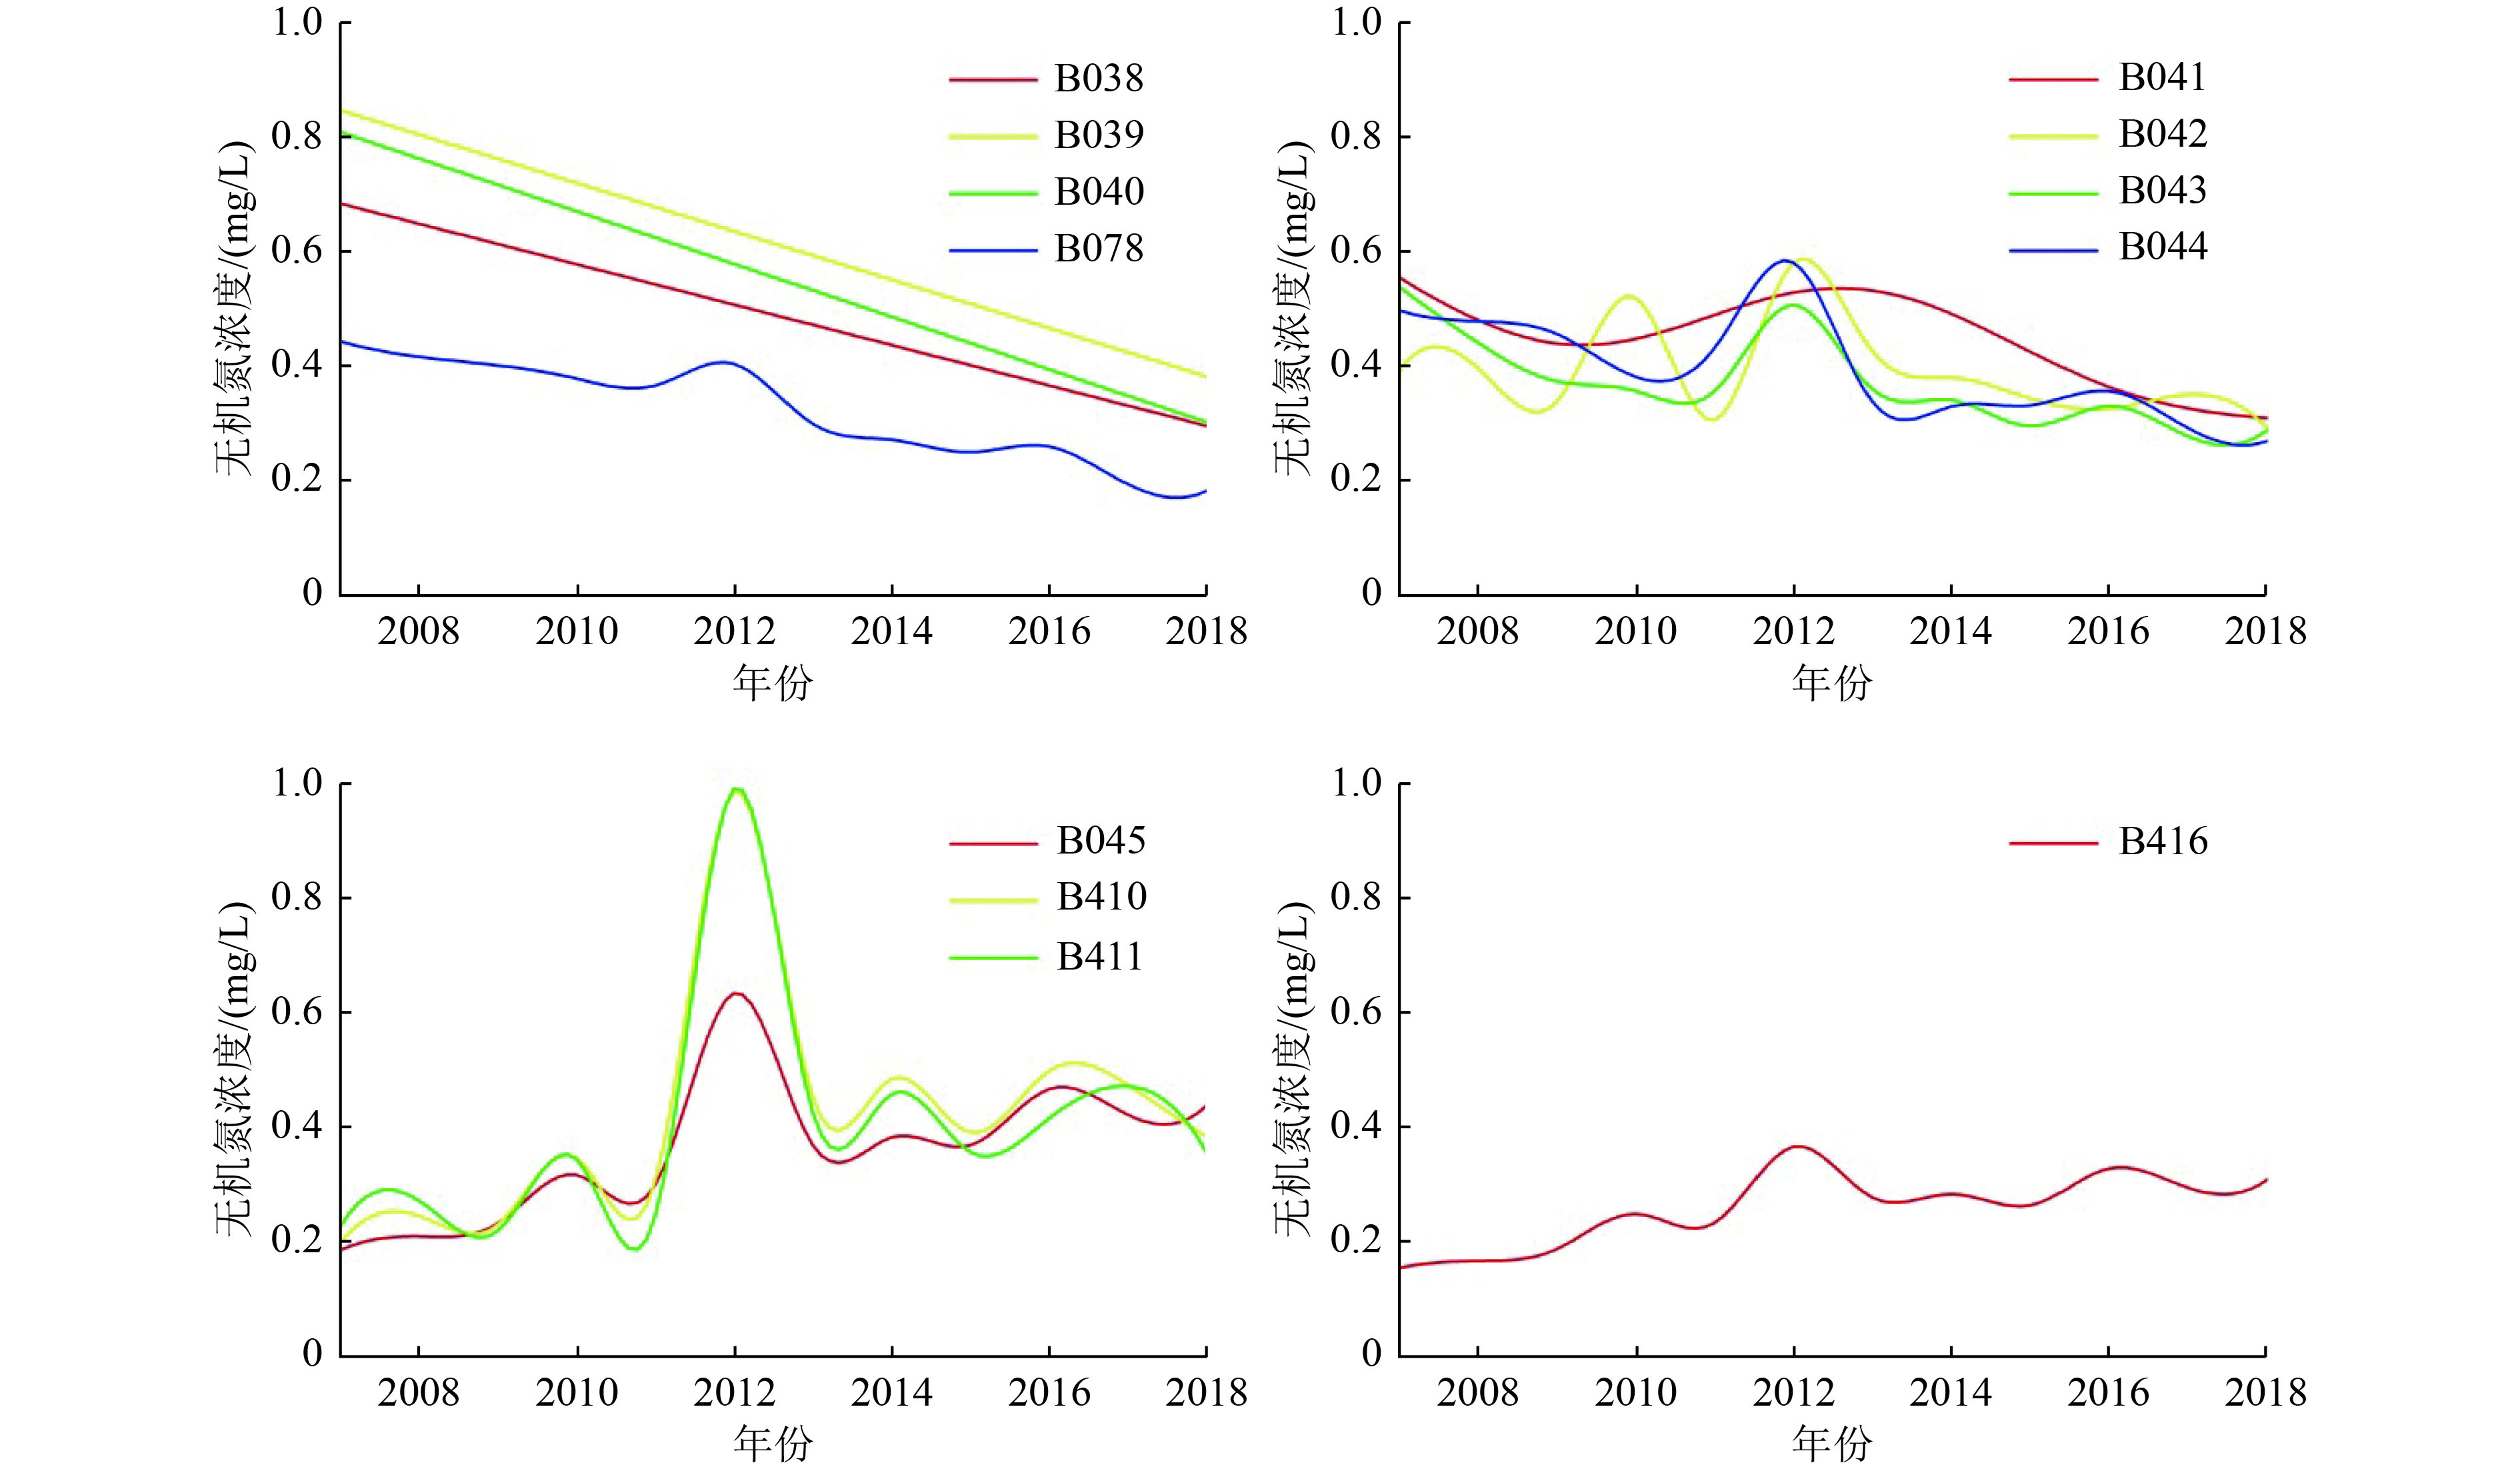
图 4 2007—2018年各监测站位无机氮模型模拟浓度随时间变化趋势
Figure 4. Variation of simulated concentration of inorganic nitrogen with time at each monitoring station in 2007-2018

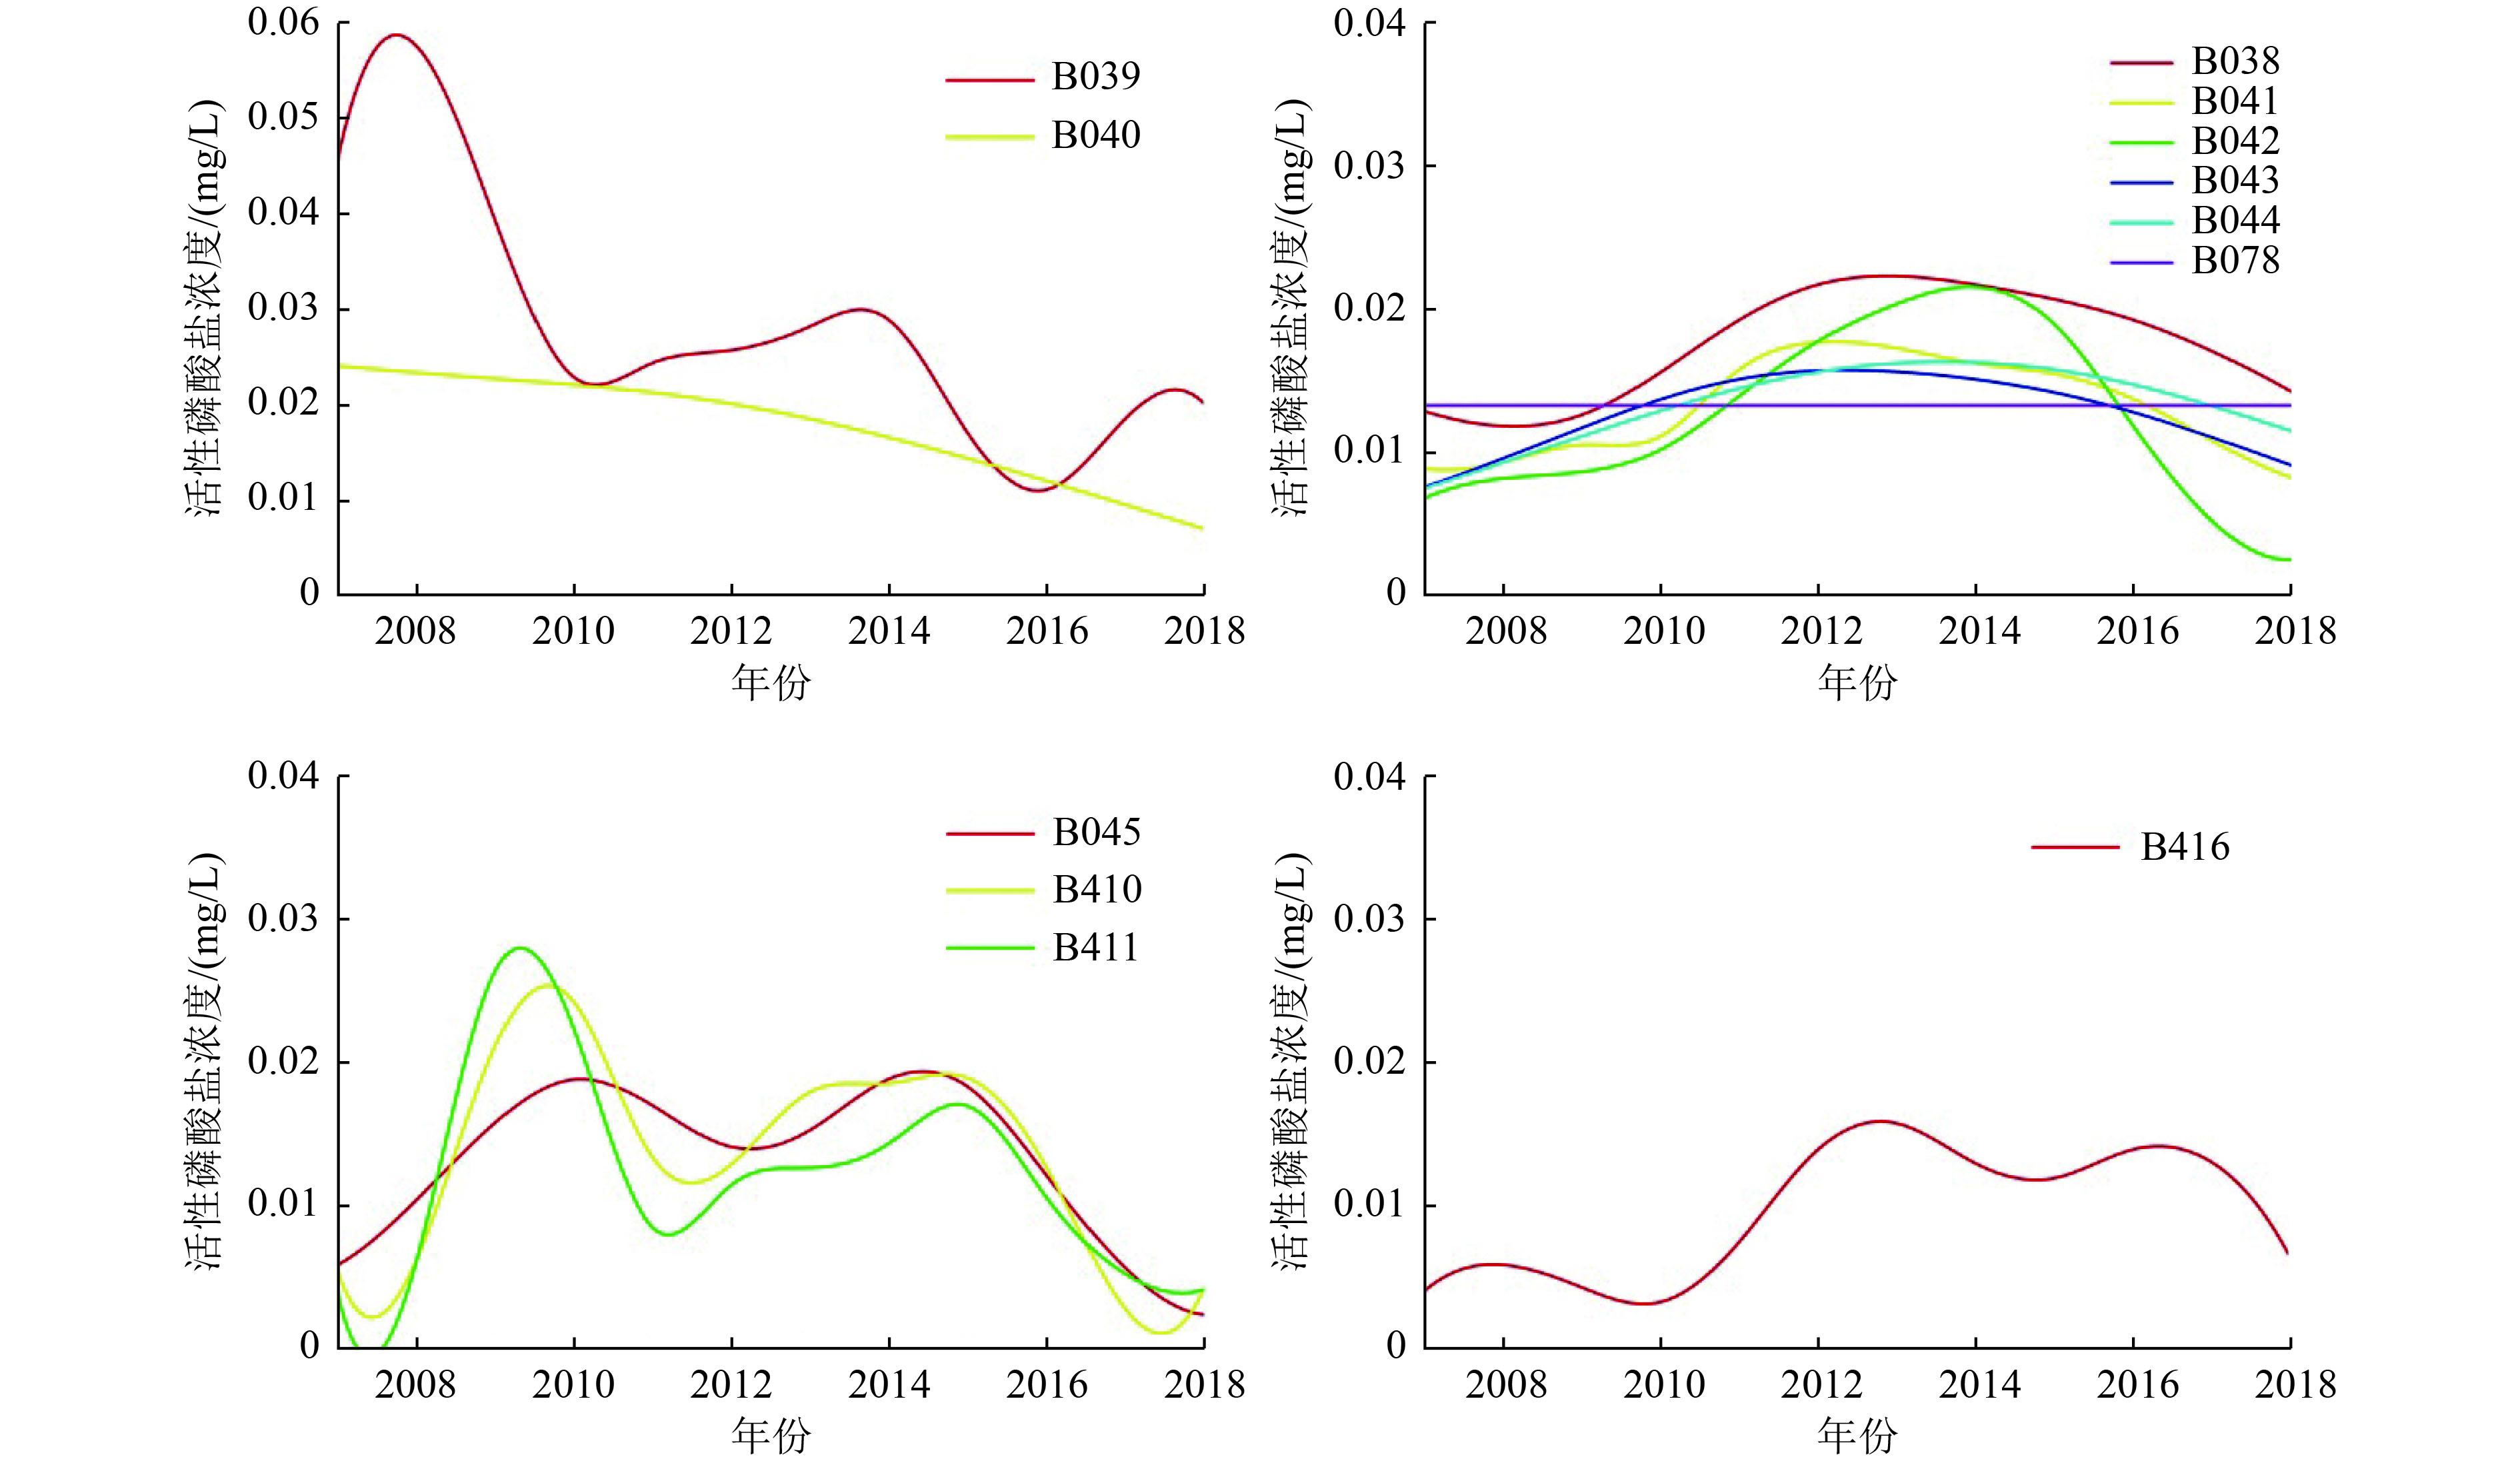
图 5 2007—2018年各监测站位活性磷酸盐模拟浓度时间变化趋势
Figure 5. Variation of simulated concentration of reactive phosphorus with time at each monitoring station in 2007-2018

图 6 2025年天津市近岸海域水质目标空间分布
Figure 6. Spatial distribution of water quality targets in Tianjin's coastal waters in 2025

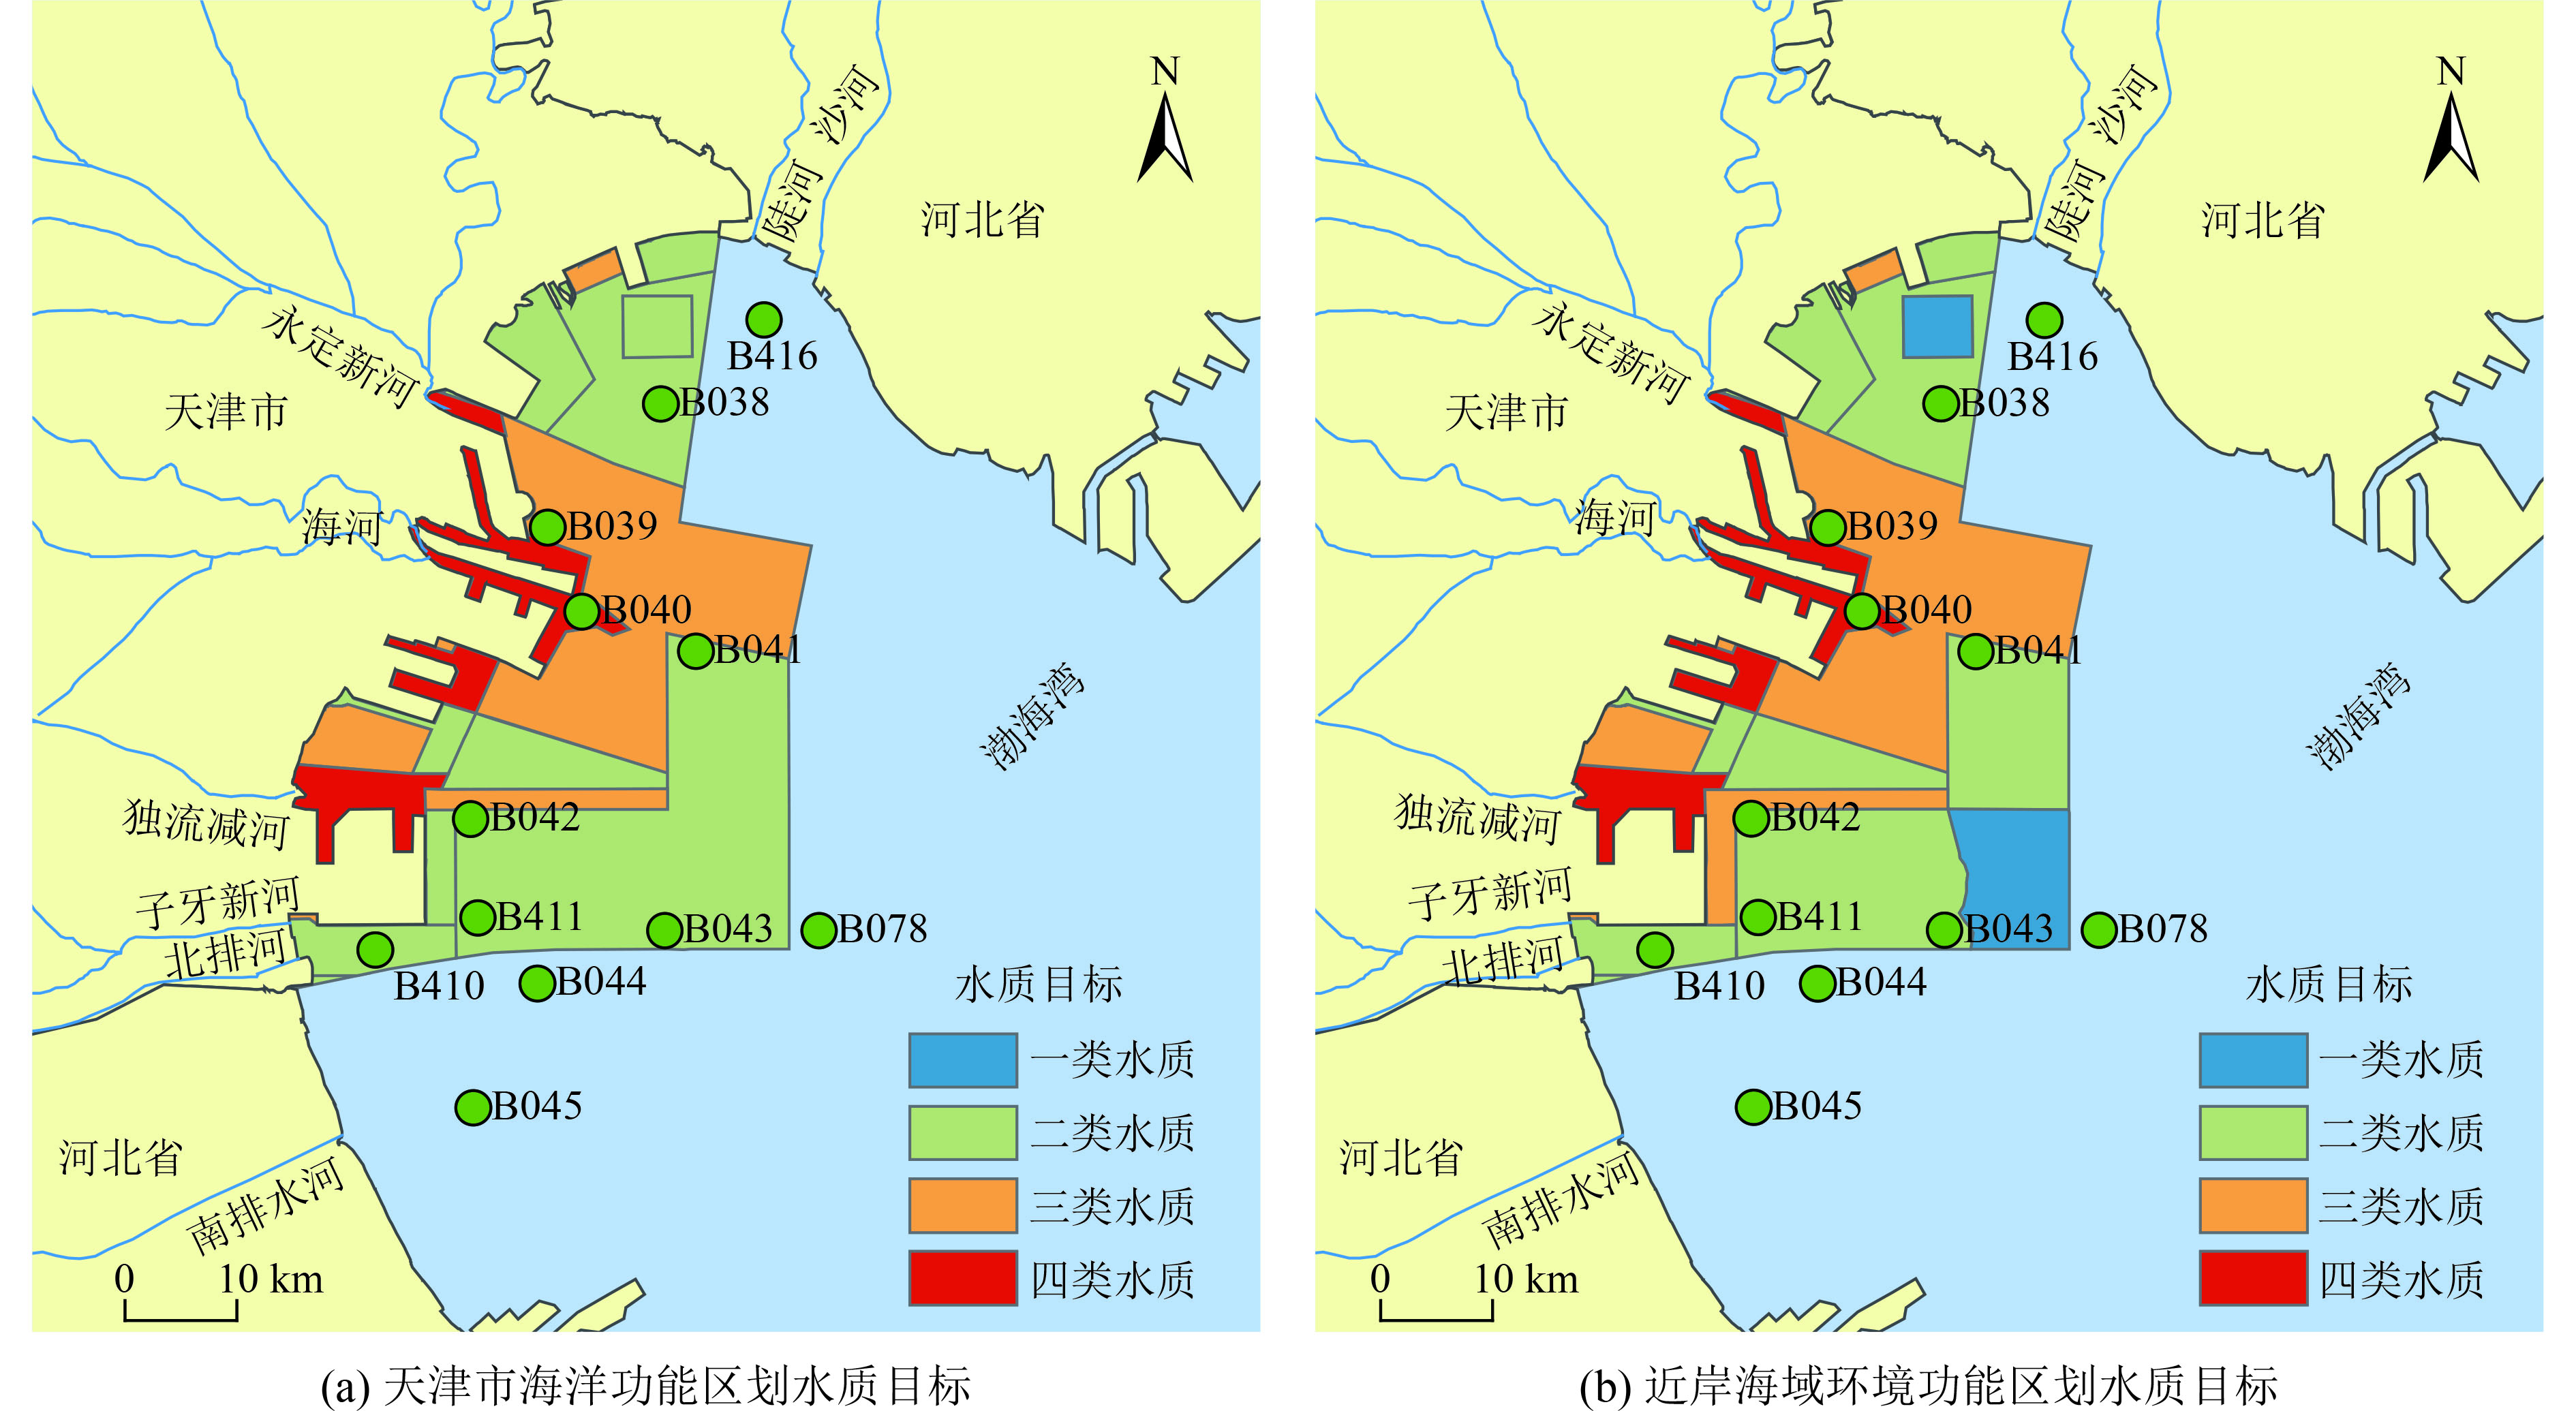
图 7 天津市海洋功能区划及近岸海域环境功能区划要求的水质目标
Figure 7. Water quality targets required by Tianjin marine functional zoning and coastal marine environmental functional division

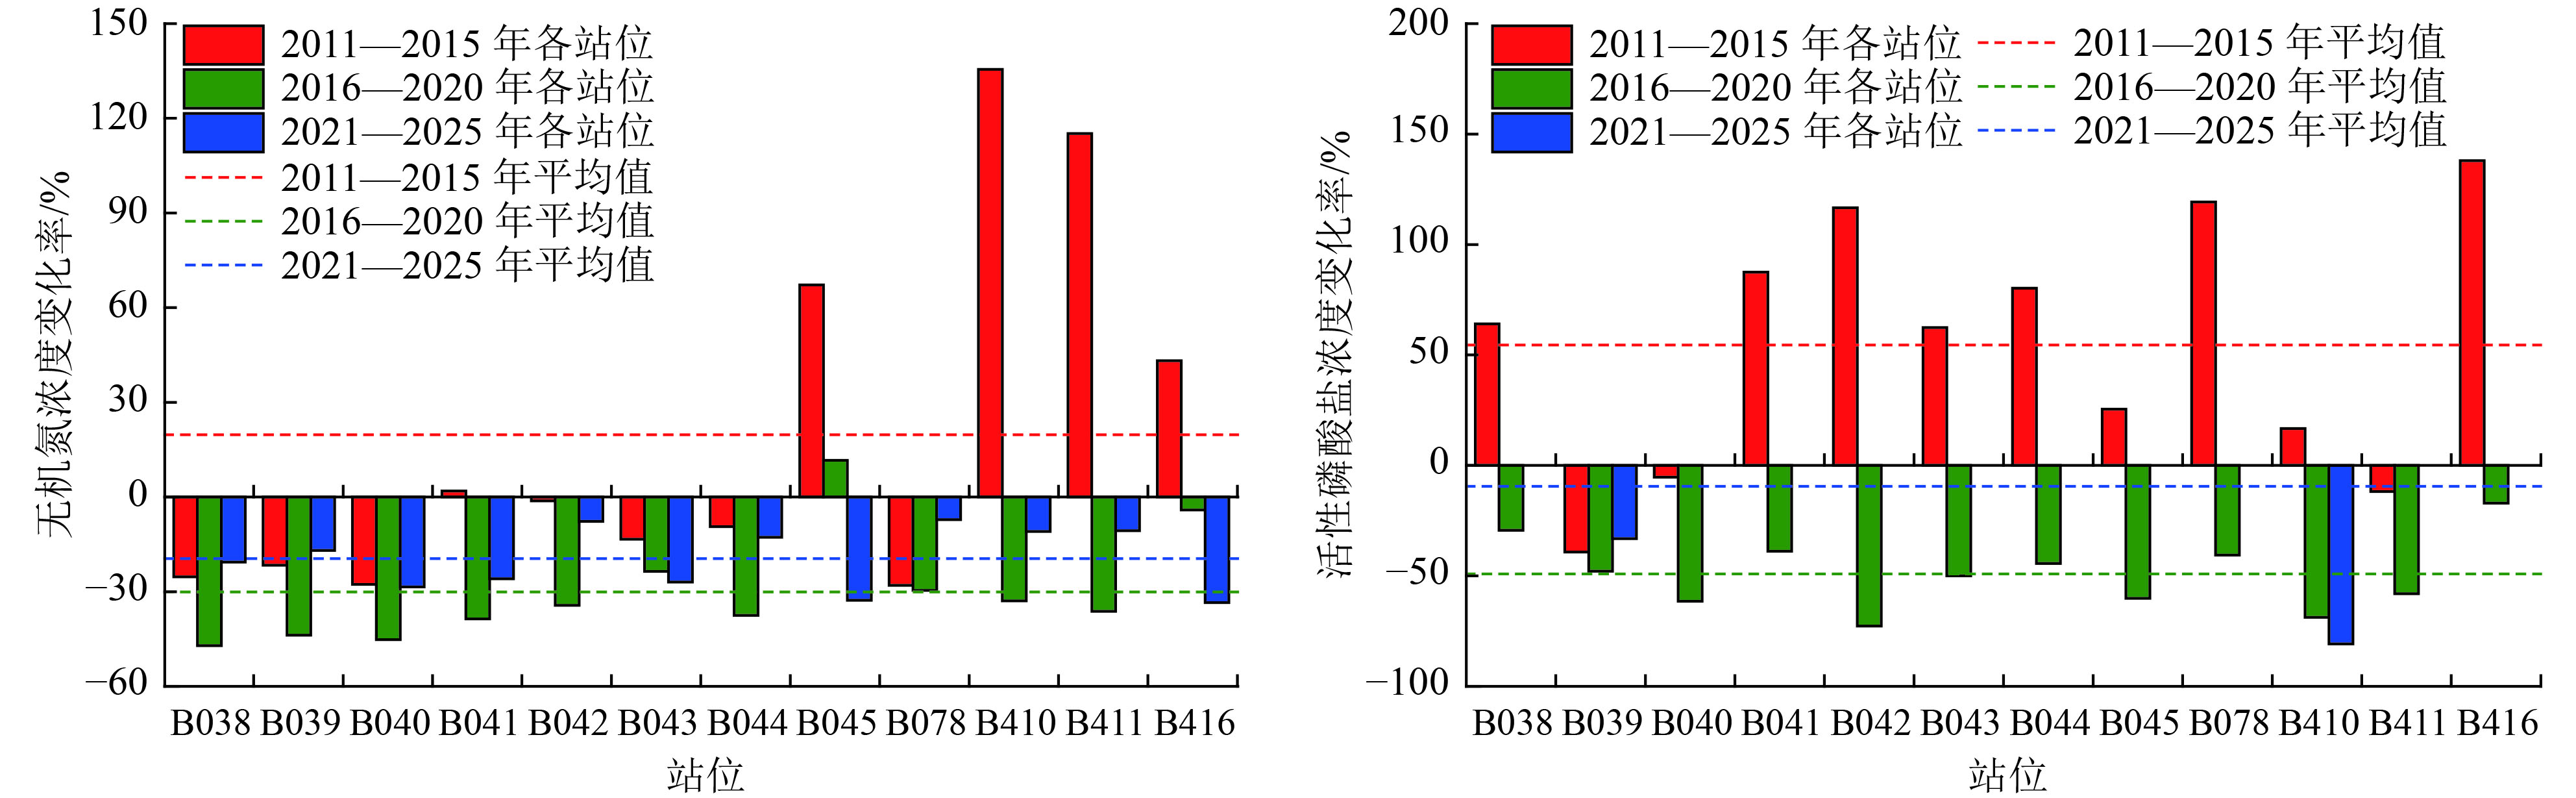
图 8 不同时间段无机氮、活性磷酸盐浓度变化率
注:浓度变化率是本阶段相较上阶段浓度的变化,如2011—2015年与2006—2010年相比,无机氮、活性磷酸盐平均浓度变化百分比。
Figure 8. Change percentage of inorganic nitrogen and active phosphate concentration in different time periods

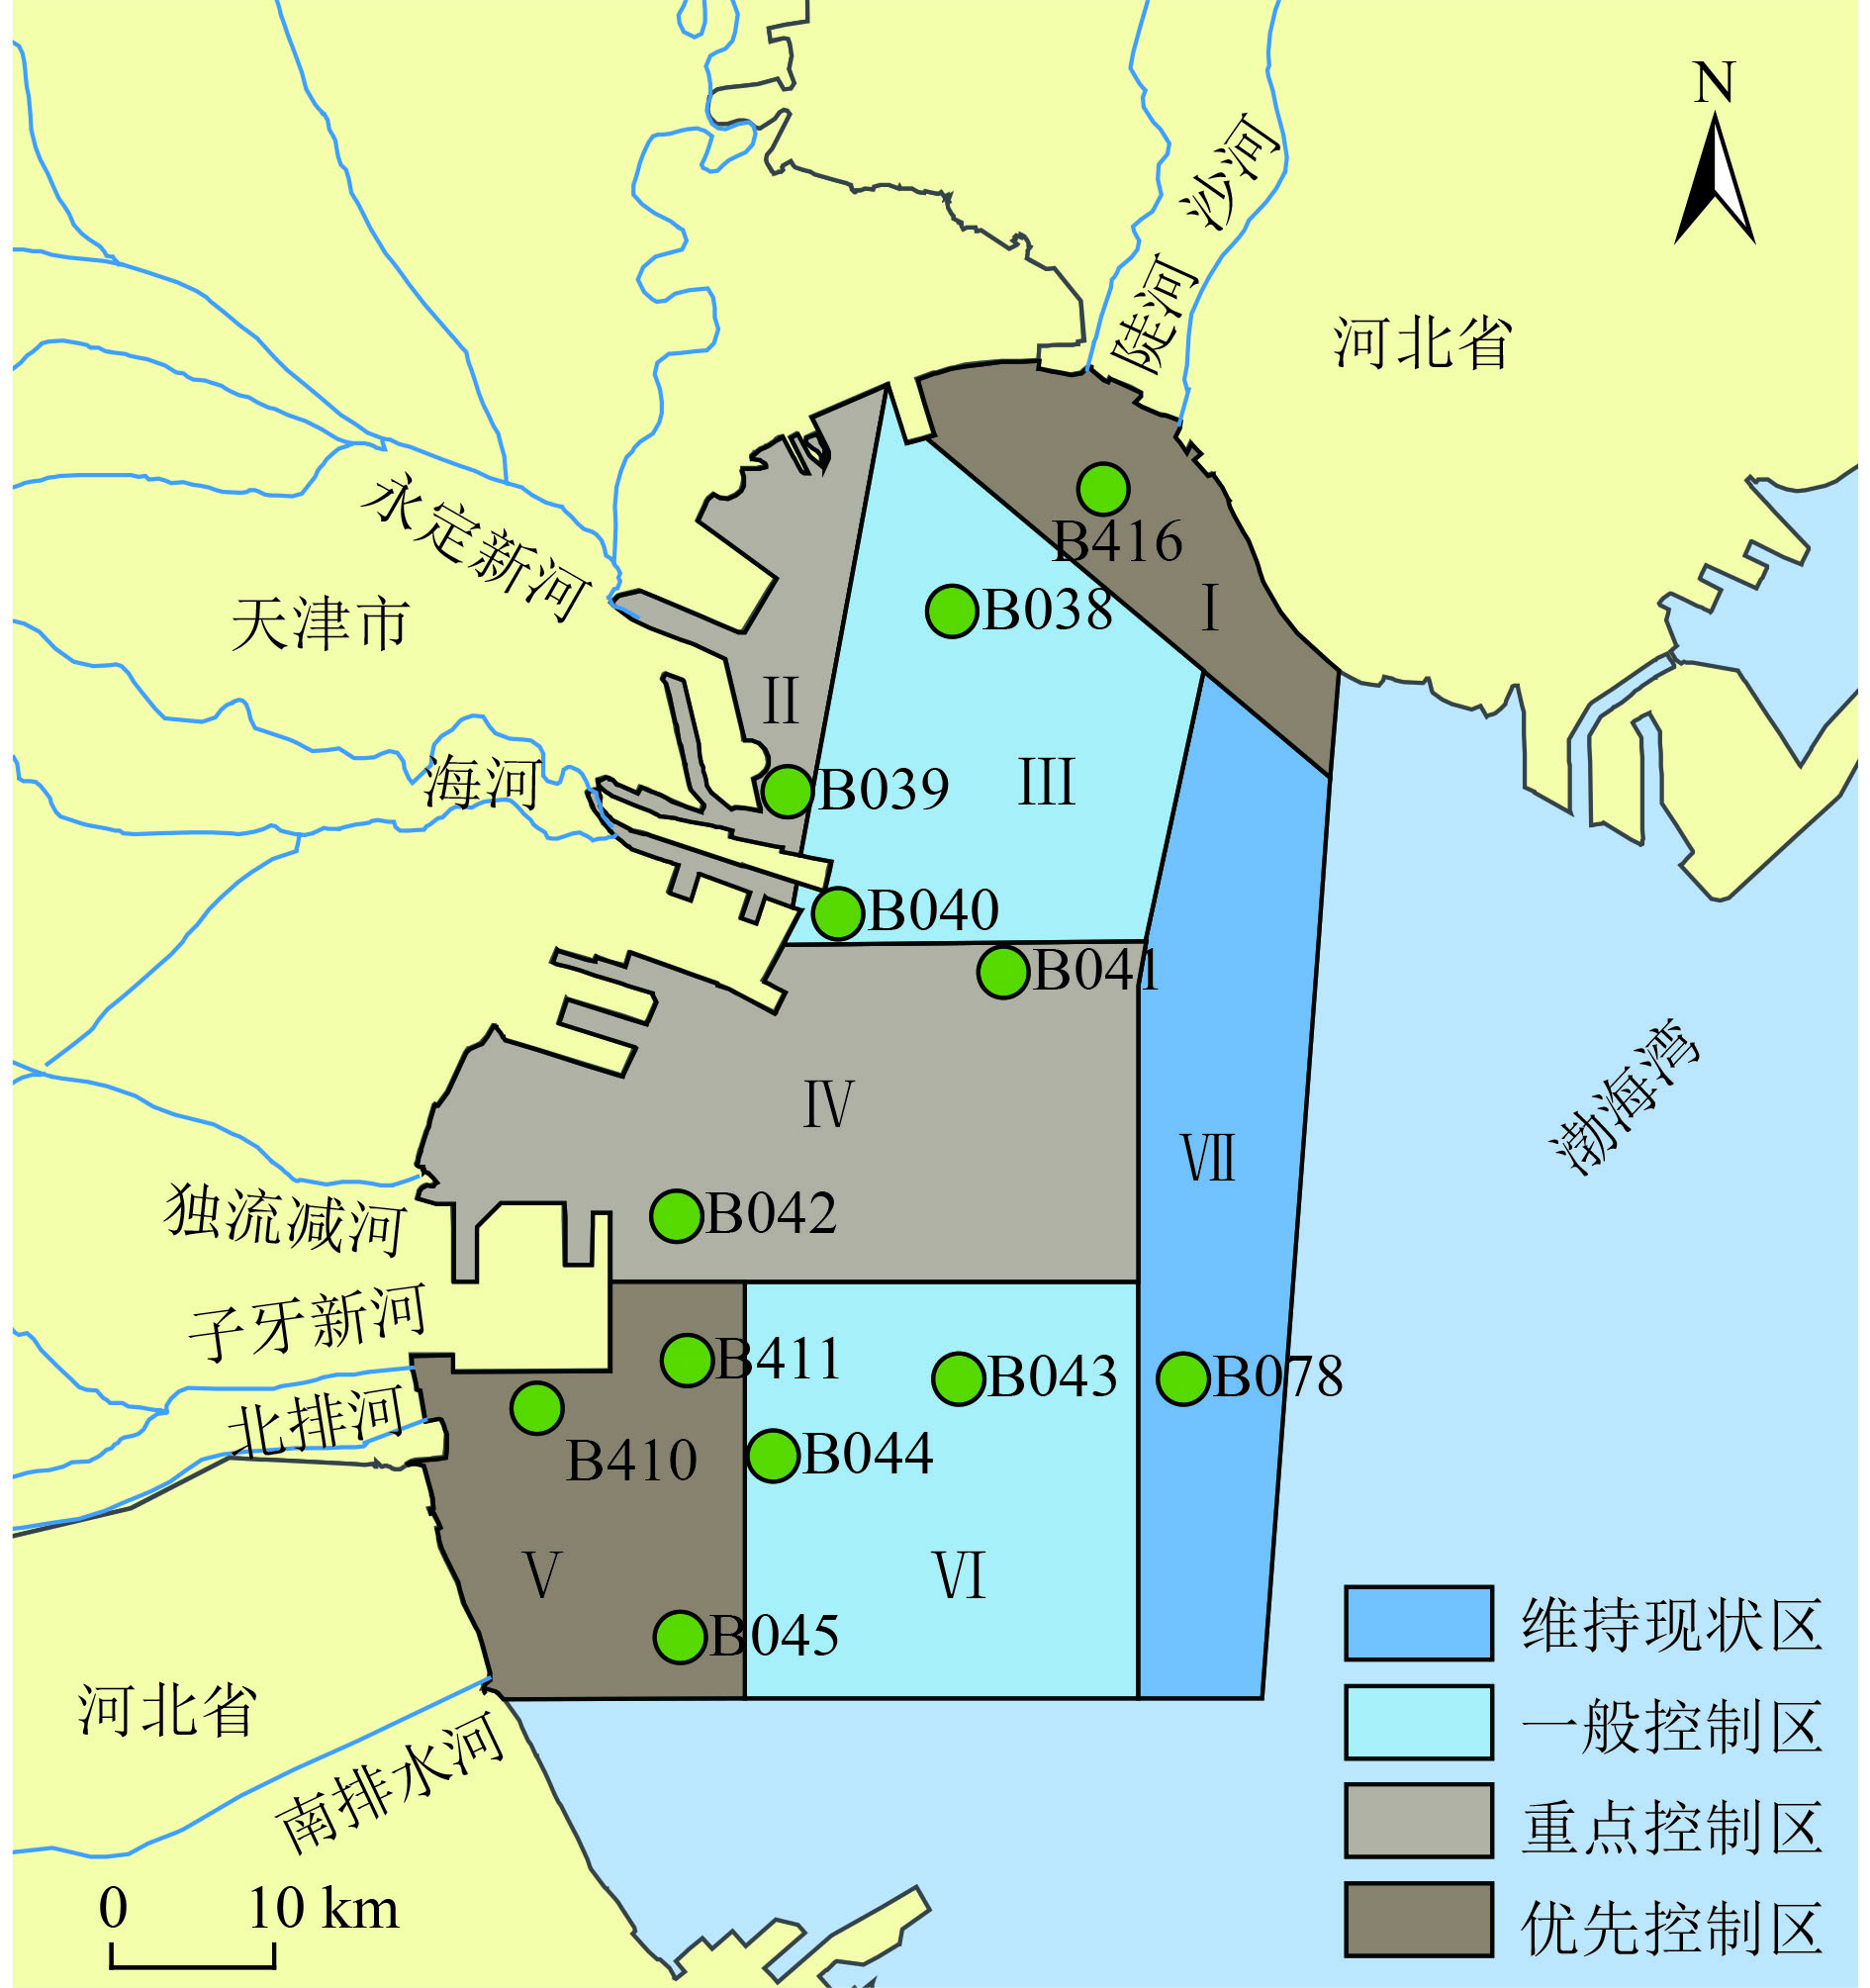
图 9 天津市近岸海域水质分区管控
Figure 9. Zoning management map of water quality in the coastal waters of Tianjin
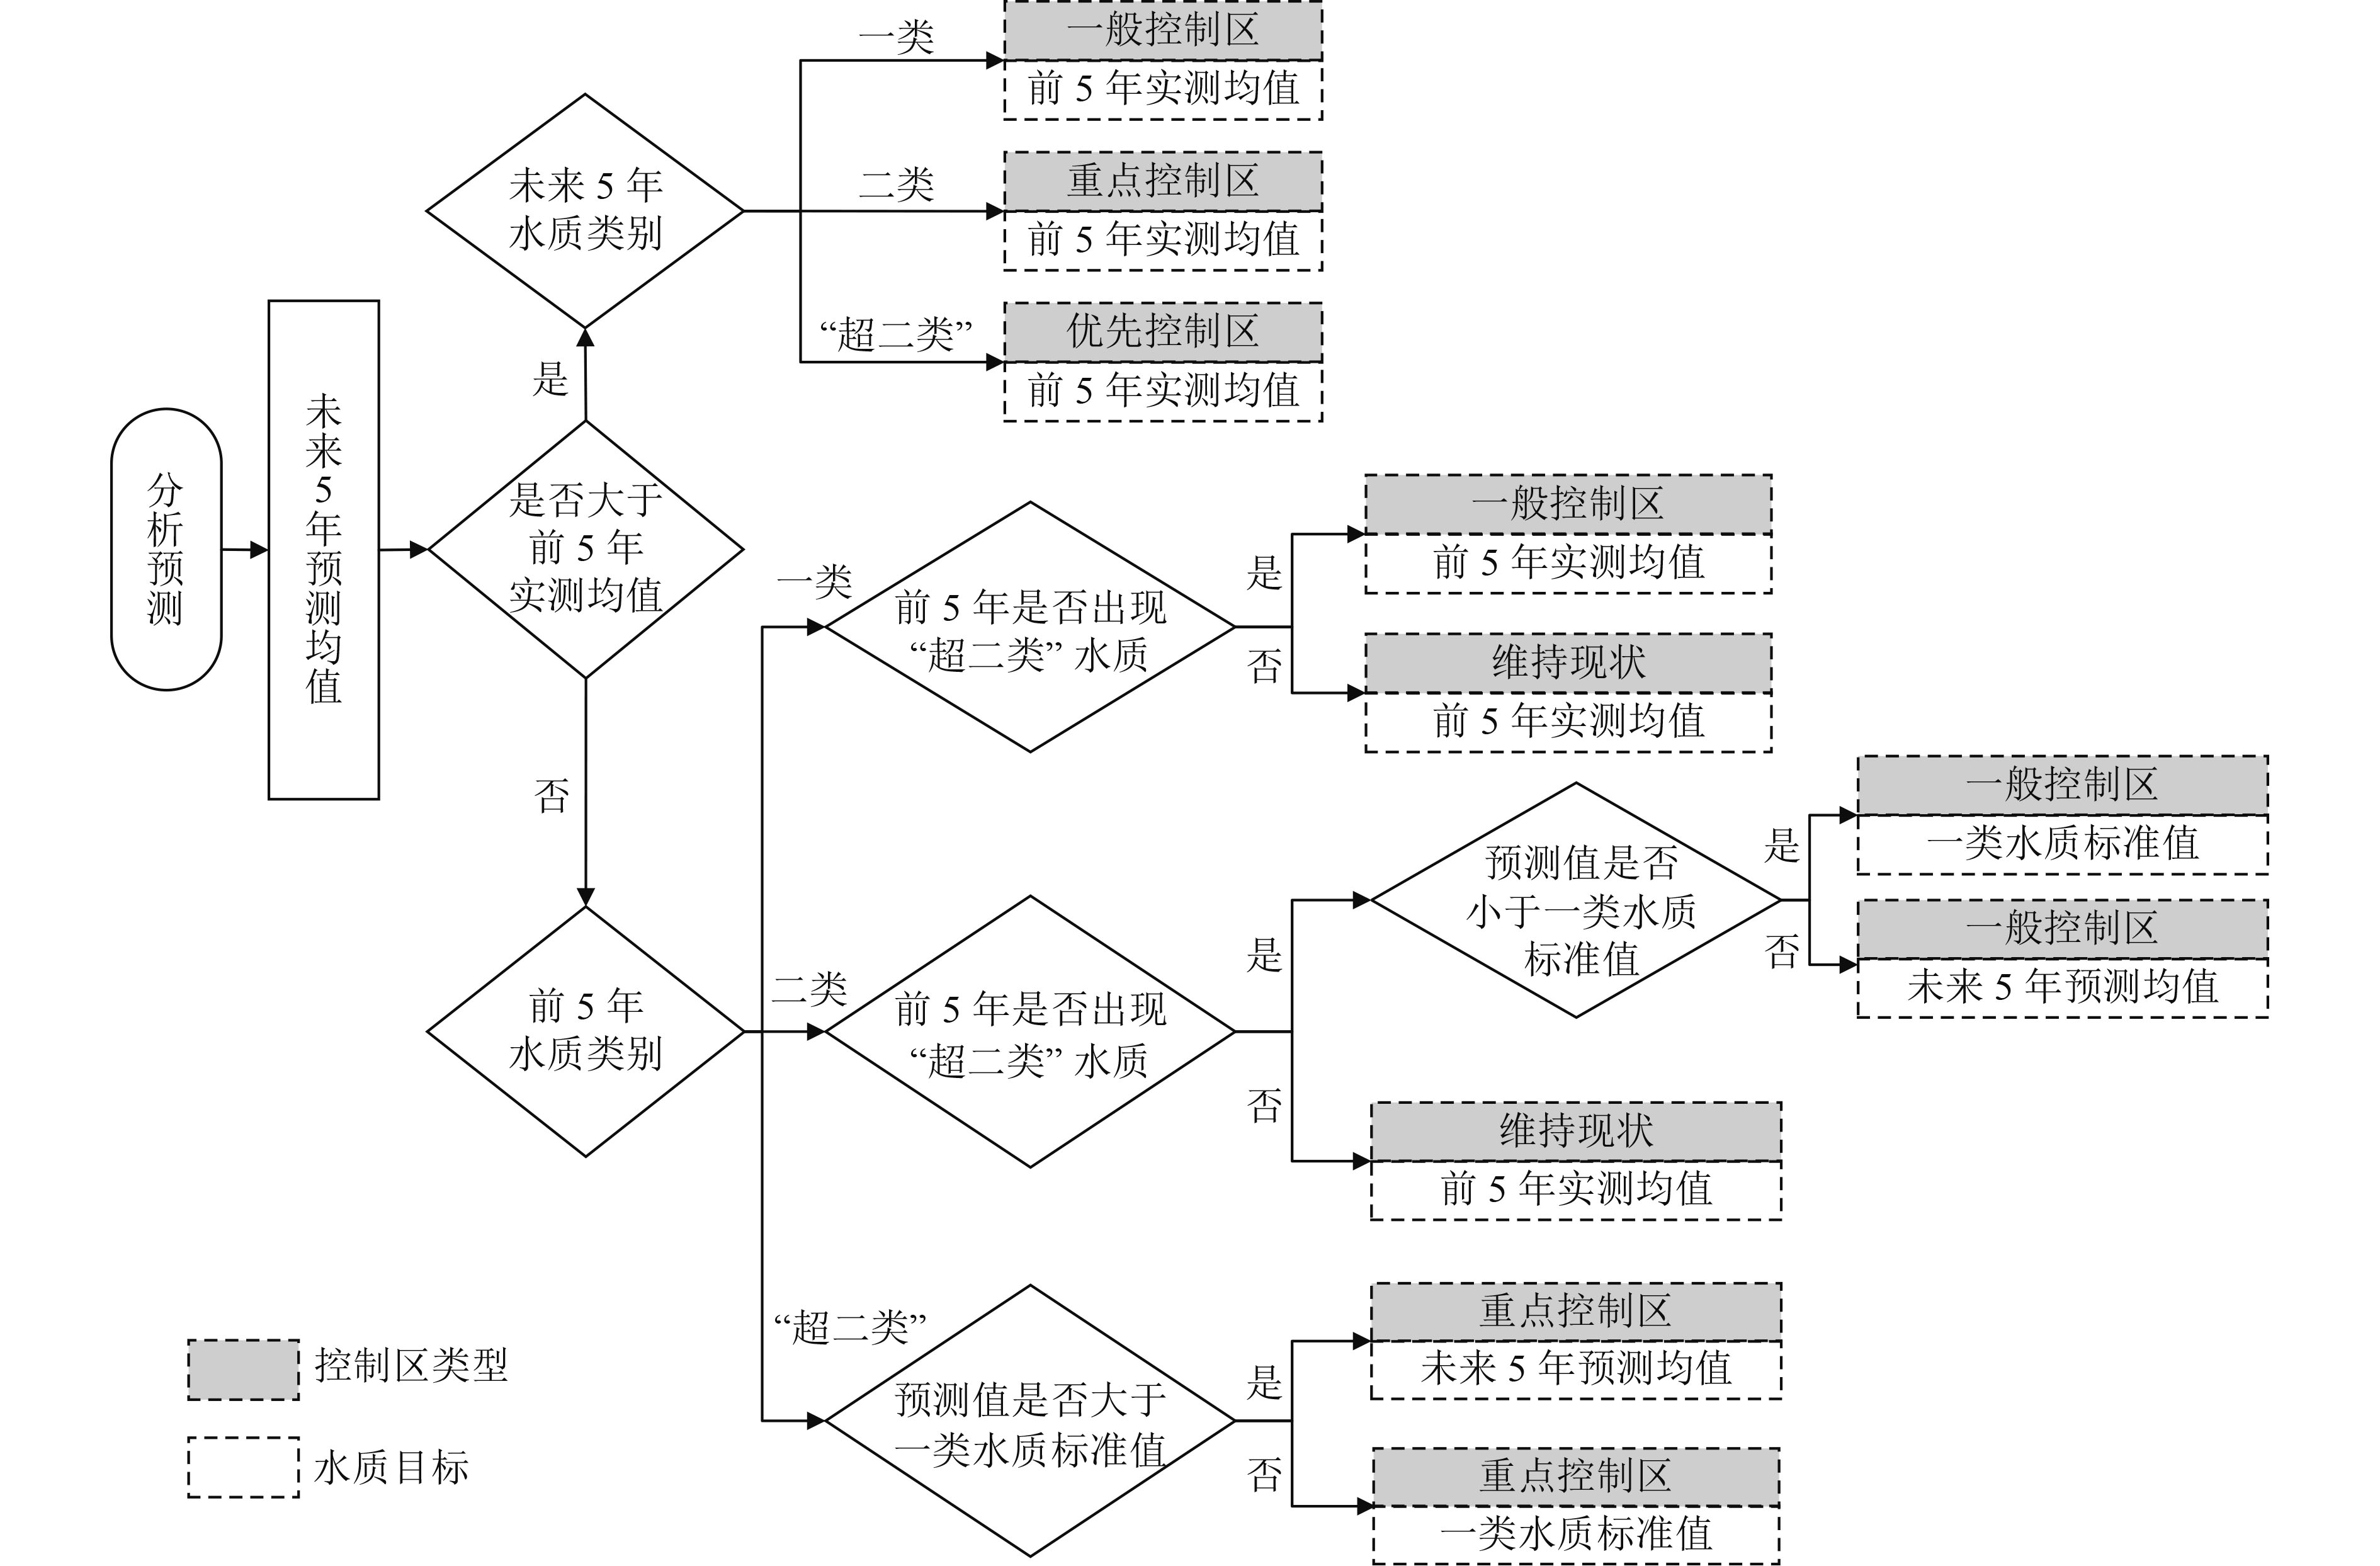
表 1 天津市近岸海域水质控制区分级
Table 1. Classification of water quality control areas in the coastal waters of Tianjin
控制区等级 分级原则 优先控制区 未来5年水质呈恶化趋势,且水质预测均值超出二类水质标准(“超二类”) 重点控制区 未来5年水质呈向好趋势,但前5年水质均值为“超二类”;或未来5年水质呈恶化趋势,且水质预测均值为二类水质 一般控制区 未来5年水质呈向好趋势,前5年水质均值为二类水质,且稳定;或未来5年水质呈向好趋势,前5年水质均值为一类水质,但其中至少1年出现“超二类”水质;或未来5年水质呈恶化趋势,但水质预测均值为一类水质 维持现状区 前5年水质优良、稳定,且未来5年水质呈向好趋势  下载: 导出CSV
表 2 模型模拟及验证结果
Table 2. Model simulation and verification results
监测站位 无机氮 活性磷酸盐 R2 Adj DE 2019—2020年误差均值/% R2 Adj DE 2019—2020年误差均值/% B038 0.57 0.61 24.36 0.89 0.93 −6.41 B039 0.57 0.61 49.21 0.97 0.99 71.40 B040 0.78 0.80 19.19 0.66 0.72 −8.22 B041 0.80 0.87 7.16 0.66 0.80 −76.17 B042 0.48 0.61 40.20 0.94 0.97 −79.03 B043 0.94 0.97 13.97 0.49 0.59 102.93 B044 0.71 0.80 61.17 0.49 0.58 38.86 B045 0.86 0.91 — 0.81 0.89 — B078 0.68 0.73 −18.30 0.93 0.97 174.63 B410 0.82 0.89 51.29 0.92 0.98 67.28 B411 0.83 0.89 69.79 0.92 0.96 −39.90 B416 0.50 0.63 127.73 0.82 0.90 −10.88 平均值 0.71 0.78 40.52 0.79 0.86 21.32 注:—表示无实测数据。
下载: 导出CSV
表 3 2025年天津市近岸海域监测站位水质目标及控制等级
Table 3. Results of water quality objectives and control classification in Tianjin's coastal waters in 2025
mg/L 监测站位 无机氮浓度 活性磷酸盐浓度 2016—2020年
实测均值2021—2025年
预测均值2025年
目标值控制
区等级2016—2020年
实测均值2021—2025年
预测均值2025年
目标值控制
区等级B038 0.25 0.20 0.20 一般 0.015 0.006 0.015 一般 B039 0.34 0.28 0.28 重点 0.013 0.020 0.013 重点 B040 0.30 0.21 0.21 一般 0.008 0.002 0.008 现状 B041 0.30 0.22 0.22 重点 0.011 <0.001 0.011 现状 B042 0.27 0.29 0.27 重点 0.005 <0.001 0.005 现状 B043 0.28 0.21 0.21 一般 0.008 0.004 0.008 现状 B044 0.25 0.22 0.22 重点 0.010 0.005 0.010 现状 B045 0.46 0.68 0.46 优先 0.007 0.001 0.007 现状 B078 0.22 0.13 0.20 现状 0.009 0.002 0.009 现状 B410 0.37 0.33 0.33 重点 0.005 0.027 0.005 重点 B411 0.34 0.38 0.34 优先 0.005 0.001 0.005 现状 B416 0.26 0.40 0.26 优先 0.011 <0.001 0.011 现状 平均值 0.30 0.30 0.27 0.009 0.006 0.009 注:现状指维持现状区;一般指一般控制区;重点指重点控制区;优先指优先控制区。
下载: 导出CSV
表 4 国外典型海域综合治理水质改善效果
Table 4. Water quality improvement effect of typical foreign regions with comprehensive management
下载: 导出CSV
-
[1] 韩文辉, 党晋华, 赵颖, 等.流域水质目标管理技术研究概述[J]. 环境与可持续发展,2020,45(5):133-137. doi: 10.19758/j.cnki.issn1673-288x.202005133HAN W H, DANG J H, ZHAO Y, et al. Research summary on the basin water quality target management technique[J]. Environment and Sustainable Development,2020,45(5):133-137. doi: 10.19758/j.cnki.issn1673-288x.202005133 [2] 国家环境保护局. 海水水质标准: GB 3097—1997[S]. 北京: 环境科学出版社, 2004. [3] 夏桂敏, 张思瑶.基于季节性Kendall检验法的白石水库水质变化趋势[J]. 南水北调与水利科技,2015,13(6):1069-1074. doi: 10.13476/j.cnki.nsbdqk.2015.06.010XIA G M, ZHANG S Y. Water quality variation in the Baishi Reservoir based on seasonal Kendall test method[J]. South-to-North Water Transfers and Water Science & Technology,2015,13(6):1069-1074. doi: 10.13476/j.cnki.nsbdqk.2015.06.010 [4] 林佳敏, 陈金良, 林晶晶, 等.BP神经网络和ARIMA模型对污水处理厂出水总氮浓度的模拟预测[J]. 环境工程技术学报,2019,9(5):573-578. doi: 10.12153/j.issn.1674-991X.2019.03.261LIN J M, CHEN J L, LIN J J, et al. The simulation and prediction of TN in wastewater treatment effluent using BP neural network and ARIMA model[J]. Journal of Environmental Engineering Technology,2019,9(5):573-578. doi: 10.12153/j.issn.1674-991X.2019.03.261 [5] 王英伟, 马树才.基于ARIMA和LSTM混合模型的时间序列预测[J]. 计算机应用与软件,2021,38(2):291-298. doi: 10.3969/j.issn.1000-386x.2021.02.047WANG Y W, MA S C. Time series forecasting based on ARIMA_DLSTM hybrid model[J]. Computer Applications and Software,2021,38(2):291-298. doi: 10.3969/j.issn.1000-386x.2021.02.047 [6] 李文静, 王潇潇.基于简化型LSTM神经网络的时间序列预测方法[J]. 北京工业大学学报,2021,47(5):480-488.LI W J, WANG X X. Time series prediction method based on simplified LSTM neural network[J]. Journal of Beijing University of Technology,2021,47(5):480-488. [7] HIRSCH R M, SLACK J R, SMITH R A. Techniques of trend analysis for monthly water quality data[J]. Water Resources Research,1982,18(1):107-121. doi: 10.1029/WR018i001p00107 [8] ZHANG Q, MURPHY R R, TIAN R, et al. Chesapeake Bay's water quality condition has been recovering: insights from a multimetric indicator assessment of thirty years of tidal monitoring data[J]. Science of the Total Environment,2018,637/638:1617-1625. doi: 10.1016/j.scitotenv.2018.05.025 [9] HASTIE T, TIBSHIRANI R. Generalized additive models[J]. Statistical Science,1986,1(3):297-310. [10] HARDING L W, GALLEGOS C L, PERRY E S, et al. Long-term trends of nutrients and phytoplankton in Chesapeake Bay[J]. Estuaries and Coasts,2016,39(3):664-681. doi: 10.1007/s12237-015-0023-7 [11] QIAO Y H, FENG J F, CUI S F, et al. Long-term changes in nutrients, chlorophyll a and their relationships in a semi-enclosed eutrophic ecosystem, Bohai Bay, China[J]. Marine Pollution Bulletin,2017,117(1/2):222-228. [12] RICHARDS R, CHALOUPKA M, STRAUSS D, et al. Using generalized additive modelling to understand the drivers of long-term nutrient dynamics in the broadwater estuary (a subtropical estuary), Gold Coast, Australia[J]. Journal of Coastal Research,2014,298:1321-1329. doi: 10.2112/JCOASTRES-D-12-00190.1 [13] VARANKA S, HJORT J. Spatio-temporal aspects of the environmental factors affecting water quality in boreal rivers[J]. Environmental Earth Sciences,2016,76(1):1-13. [14] ZHANG H X, HUO S L, YEAGER K M, et al. Phytoplankton response to climate changes and anthropogenic activities recorded by sedimentary pigments in a shallow eutrophied lake[J]. Science of the Total Environment,2019,647:1398-1409. doi: 10.1016/j.scitotenv.2018.08.081 [15] ECCLES R, ZHANG H, HAMILTON D, et al. Trends in water quality in a subtropical Australian river-estuary system: responses to damming, climate variability and wastewater discharges[J]. Journal of Environmental Management,2020,269:110796. doi: 10.1016/j.jenvman.2020.110796 [16] SONG W P, DAI Y Y, DONG Y B. Study of the water quality in Liaohe Park based on the model of GAM[J]. Marine Science Bulletin,2012,14(1):90-96. [17] ROBSON B J, DOURDET V. Prediction of sediment, particulate nutrient and dissolved nutrient concentrations in a dry tropical river to provide input to a mechanistic coastal water quality model[J]. Environmental Modelling & Software,2015,63:97-108. [18] 天津市规划和自然资源局. 2015年天津市生态环境状况公报[A/OL]. (2016-09-30)[2021-06-23]. http://ghhzrzy.tj.gov.cn/zwgk_143/tzgg/202012/t20201206_4496986.html. [19] PENG S T, DAI M X, HU Y D, et al. Long-term (1996-2006) variation of nitrogen and phosphorus and their spatial distributions in Tianjin coastal seawater[J]. Bulletin of Environmental Contamination and Toxicology,2009,83(3):416-421. doi: 10.1007/s00128-009-9680-1 [20] PENG S T. The nutrient, total petroleum hydrocarbon and heavy metal contents in the seawater of Bohai Bay, China: temporal-spatial variations, sources, pollution statuses, and ecological risks[J]. Marine Pollution Bulletin,2015,95(1):445-451. doi: 10.1016/j.marpolbul.2015.03.032 [21] LIU X H, LIU D Y, WANG Y J, et al. Temporal and spatial variations and impact factors of nutrients in Bohai Bay, China[J]. Marine Pollution Bulletin,2019,140:549-562. doi: 10.1016/j.marpolbul.2019.02.011 [22] 国家质量监督检验检疫总局, 中国国家标准化管理委员会. 海洋调查规范 第1部分: 总则: GB/T 12763.1—2007[S]. 北京: 中国标准出版社, 2008. [23] 国家质量监督检验检疫总局, 中国国家标准化管理委员会. 海洋监测规范 第4部分: 海水分析: GB 17378.4—2007[S]. 北京: 中国标准出版社, 2008. [24] 天津市统计局. 2014天津统计年鉴[M]. 北京: 中国统计出版社, 2014. [25] WOOD S N. Generalized Additive Models[M]. New York: Chapman and Hall/CRC, 2017. [26] WOOD S N. Mgcv: GAMs and generalized ridge regression for R[J]. R News,2001,1:20-25. [27] MARRA G, WOOD S N. Coverage properties of confidence intervals for generalized additive model components[J]. Scandinavian Journal of Statistics,2012,39(1):53-74. doi: 10.1111/j.1467-9469.2011.00760.x [28] WOOD S N. On p-values for smooth components of an extended generalized additive model[J]. Biometrika,2012,100(1):221-228. [29] CHU J T, XIA J, XU C Y, et al. Spatial and temporal variability of daily precipitation in Haihe River Basin, 1958-2007[J]. Journal of Geographical Sciences,2010,20(2):248-260. doi: 10.1007/s11442-010-0248-0 [30] ZHANG J P, ZHI M M. Effects of basin nutrient discharge variations coupled with climate change on water quality in Lake Erhai, China[J]. Environmental Science and Pollution Research International,2020,27(35):43700-43710. doi: 10.1007/s11356-020-09179-0 [31] MURPHY R R, PERRY E, HARCUM J, et al. A Generalized Additive Model approach to evaluating water quality: Chesapeake Bay case study[J]. Environmental Modelling & Software,2019,118:1-13. [32] RAO C R. Linear statistical inference and its applications[M]. Hoboken, NJ, USA: John Wiley & Sons, Inc. , 1973. [33] 宋兵魁, 齐树亭, 李斯, 等.渤海湾氮、磷营养盐在水体和沉积物中的分布特征及其相互关系[J]. 海洋学研究,2019,37(1):83-90. doi: 10.3969/j.issn.1001-909X.2019.01.011SONG B K, QI S T, LI S, et al. Spatial distribution of nitrogen and phosphorus in waters and sediments in Bohai Bay and their correlation[J]. Journal of Marine Sciences,2019,37(1):83-90. doi: 10.3969/j.issn.1001-909X.2019.01.011 [34] 乔延龙, 殷小亚, 孙艺, 等.天津市海洋生态文明建设研究[J]. 海洋开发与管理,2018,35(6):71-75. doi: 10.3969/j.issn.1005-9857.2018.06.016QIAO Y L, YIN X Y, SUN Y, et al. The construction of marine ecological civilization in Tianjin[J]. Ocean Development and Management,2018,35(6):71-75. doi: 10.3969/j.issn.1005-9857.2018.06.016 [35] 唐山统计年鉴委员会. 2019唐山市统计年鉴[J]. 北京: 中国统计出版社, 2019. [36] 李冕, 赵辉, 鲍晨光, 等.改进的IDW插值模型在海水水质评价中的应用[J]. 海洋环境科学,2014,33(2):258-261.LI M, ZHAO H, BAO C G, et al. Application of an improving IDW interpolation in seawater quality assessment[J]. Marine Environmental Science,2014,33(2):258-261. [37] 国务院关于印发《水污染防治行动计划》的通知[A/OL]. (2015-05-04)[2021-6-24]. http://www.hnsx.gov.cn/zwgk/40033/40043/40063/40068/content_2777912.html. [38] 生态环境部 发展改革委 自然资源部关于印发《渤海综合治理攻坚战行动计划》的通知[A/OL]. (2018-11-30)[2021-06-25]. http://www.mee.gov.cn/xxgk2018/xxgk/xxgk03/201812/t20181211_684232.html. [39] 天津市生态环境局. 2020年天津市生态环境状况公报[A/OL]. (2021-06-22)[2021-06-23]. http://sthj.tj.gov.cn/YWGZ7406/HJGL7886/HJTJ7803/202106/t20210622_5483949.html.pdf. [40] KUBO A, HASHIHAMA F, KANDA J, et al. Long-term variability of nutrient and dissolved organic matter concentrations in Tokyo Bay between 1989 and 2015[J]. Limnology and Oceanography, 2019, 64(Suppl 1): 209-222. [41] NISHIKAWA T, HORI Y, NAGAI S, et al. Nutrient and phytoplankton dynamics in Harima-nada, Eastern Seto Inland Sea, Japan during a 35-year period from 1973 to 2007[J]. Estuaries and Coasts,2010,33(2):417-427. doi: 10.1007/s12237-009-9198-0 [42] BERGSTRÖM L, AHTIAINEN H, AVELLAN L, et al. HELCOM state of the Baltic Sea: second HELCOM holistic assessment 2011-2016[R/OL]//Baltic Sea Environment Proceedings 155, 2018[2021-06-26].https://helcom.fi/media/publications/BSEP155.pdf. [43] HELCOM. Dissolved inorganic nitrogen (DIN) [R/OL]. HELCOM core indicator report. [2021-06-26].https://helcom.fi/media/core%20indicators/Dissolved-inorganic-nitrogen-DIN-HELCOM-core-indicator-2018.pdf. [44] HELCOM. Dissolved inorganic phosphorus (DIP) [R/OL]//HELCOM core indicator report. 2018[2021-06-26].https://helcom.fi/media/core%20indicators/Dissolved-inorganic-phosphorus-DIP-HELCOM-core-indicator-2018.pdf. [45] XU Z Z, JI Z X, LIANG B, et al. Estimate of nutrient sources and transport into Bohai Bay in China from a lower plain urban watershed using a SPARROW model[J]. Environmental Science and Pollution Research International,2021,28(20):25733-25747. ◇ doi: 10.1007/s11356-020-11932-4 -

 下载:
下载:

 点击查看大图
计量
- 文章访问数: 335
- HTML全文浏览量: 136
- PDF下载量: 42
- 被引次数: 0