

Study on the influencing factors of emptying time of bioretention facilities
-
摘要: 生物滞留设施是我国海绵城市建设中应用较为广泛的技术措施之一,在其设计和运行维护过程中,排空时间对雨水径流总量的控制效果、植物生长状况等具有重要影响,但目前尚缺乏排空时间影响因素的系统研究。通过实验室试验,研究了调蓄水深、降雨间隔、淹没区高度及构造类型对排空时间的影响。结果表明:试验条件下,不同构造类型生物滞留设施调蓄层排空时间为10~140 min,完全排空时间为6~47 h。调蓄层排空时间随调蓄水深和淹没高度的增加而增加,随降雨间隔的增加而降低,调蓄水深对调蓄层排空时间影响最大;完全排空时间随调蓄水深和降雨间隔的增加而增加,随淹没高度的增加而降低,降雨间隔对完全排空时间影响最大。研究结果可为海绵城市建设过程中生物滞留设施优化设计提供技术支撑。Abstract: Bioretention facilities are one of the measures widely used in sponge city construction in China. During the design, operation and maintenance of bioretention facilities, the emptying time has an important influence on the total runoff volume control efficiency and plant growth. However, there is a lack of systematic research on the influencing factors of emptying time. The effects of storage-layer height, rainfall interval, submerged-area height and structure type on the emptying time were investigated via laboratory experiments. The results showed that under the test conditions, the discharge time of the storage layer of different structure types of bioretention facilities was 10-140 min, and the complete discharge time was 6-47 h. The emptying time of the storage layer increased with the increase of the storage-layer water depth and the submerged-area height, and decreased with the increase of the rainfall interval. The emptying time of the storage layer water was affected most significantly by the storage height. The total emptying time increased with the increase of water storage water depth and rainfall interval, and decreased with the increase of submerged-area height. The rainfall interval had the greatest effect on the total emptying time. The research results could provide technical support for the design and optimization of bioretention facilities in the process of sponge city construction.
-
Key words:
- bioretention /
- emptying time /
- design parameters /
- rainfall interval /
- simulation experiment
-

图 1 不同类型生物滞留设施构造组成
Figure 1. Composition of different types of bioretention facilities

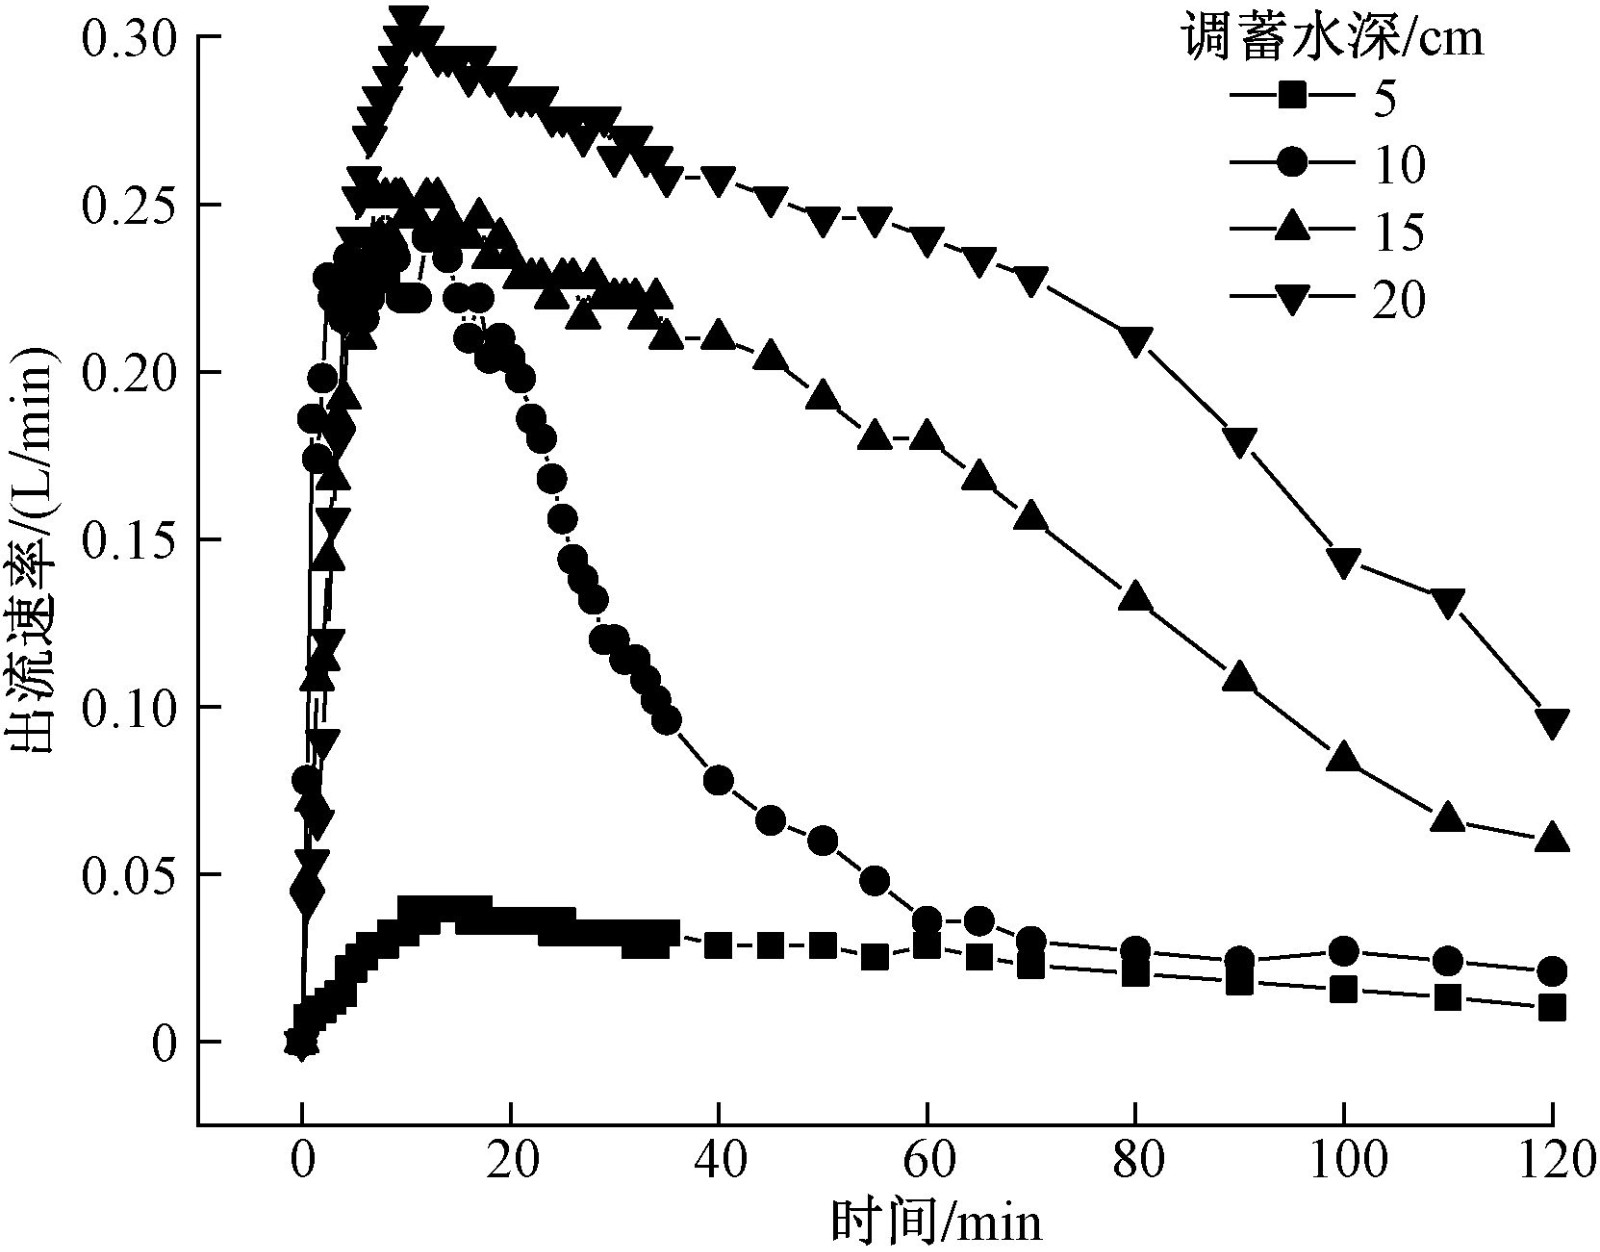
图 2 传统型不同调蓄水深出流过程线(T=2 h)
Figure 2. Outflow process of traditional bioretention at different retention water heights (T=2 h)

图 3 传统型不同降雨间隔时出流过程线(T=2 h)
Figure 3. Outflow process of traditional bioretention at different rainfall intervals (T=2 h)

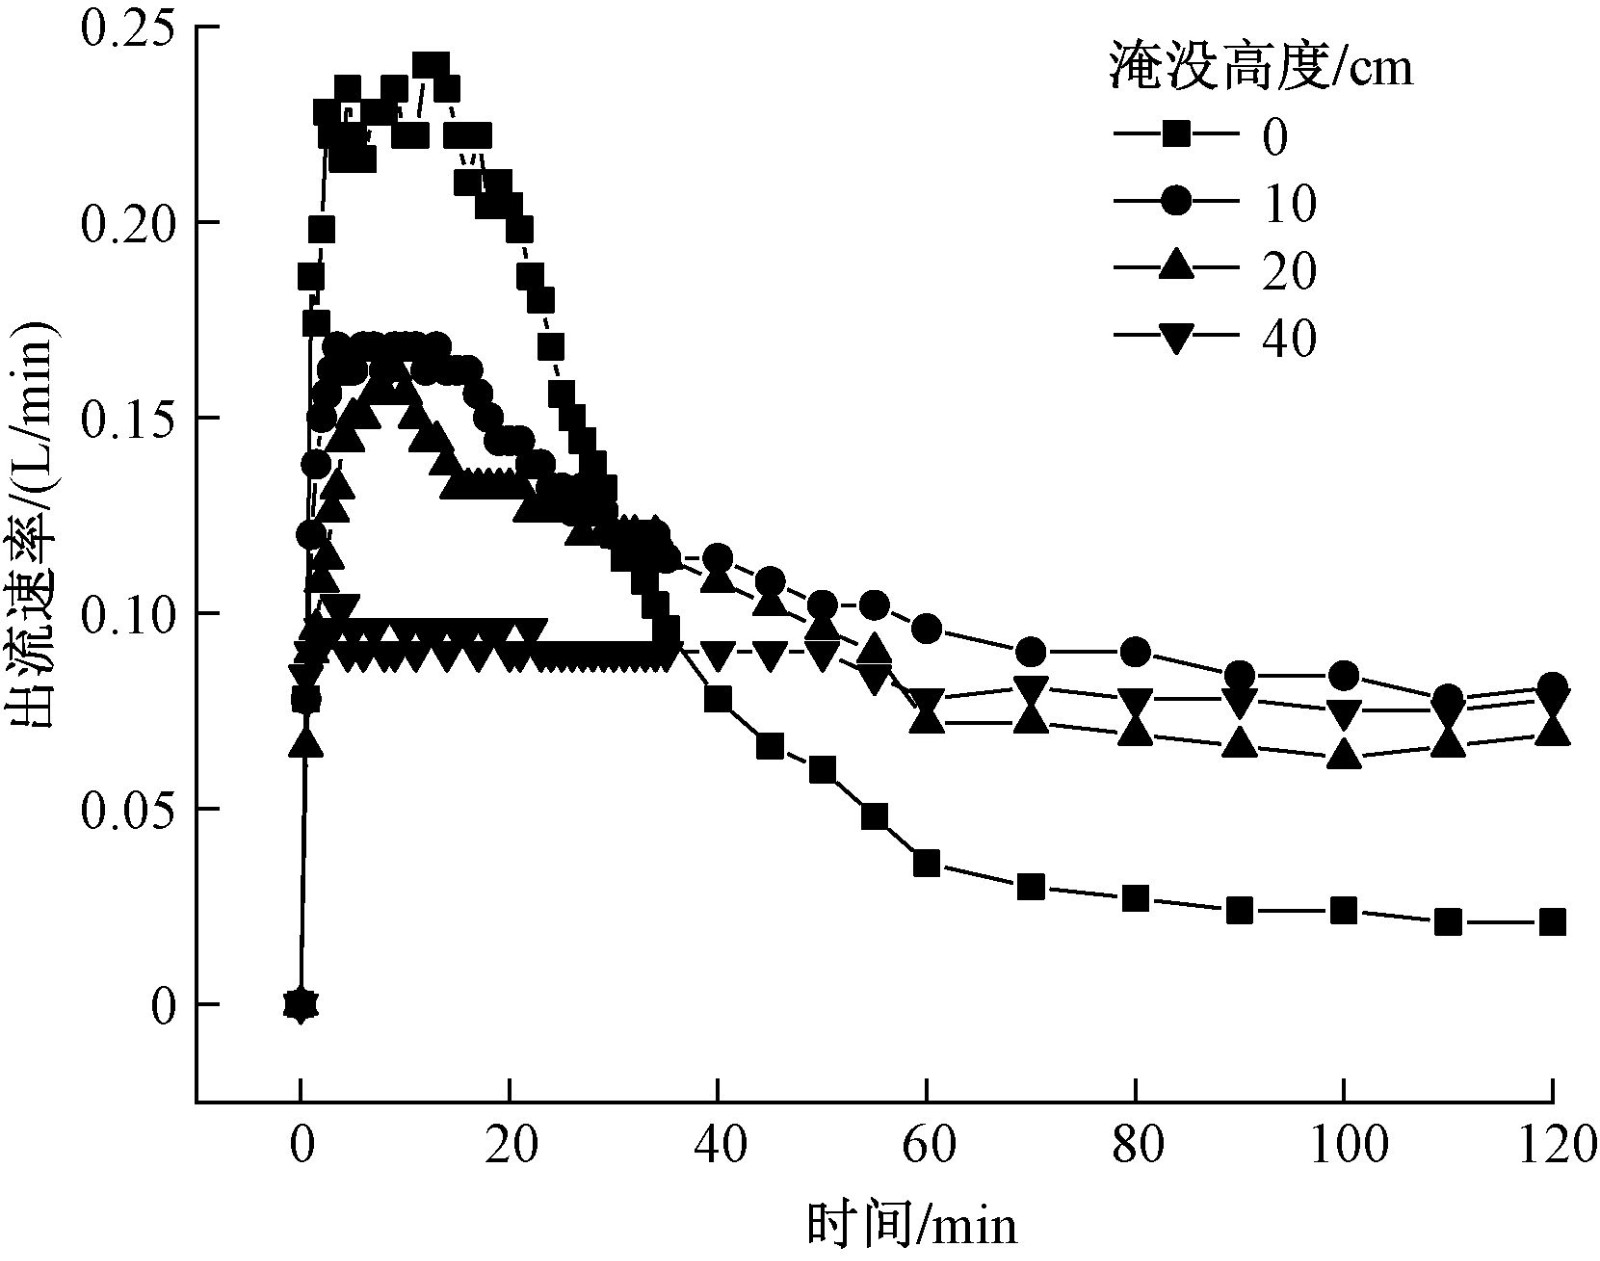
图 4 传统型不同淹没高度时出流过程线(T=2 h)
Figure 4. Outflow process of traditional bioretention at different submerged heights (T=2 h)

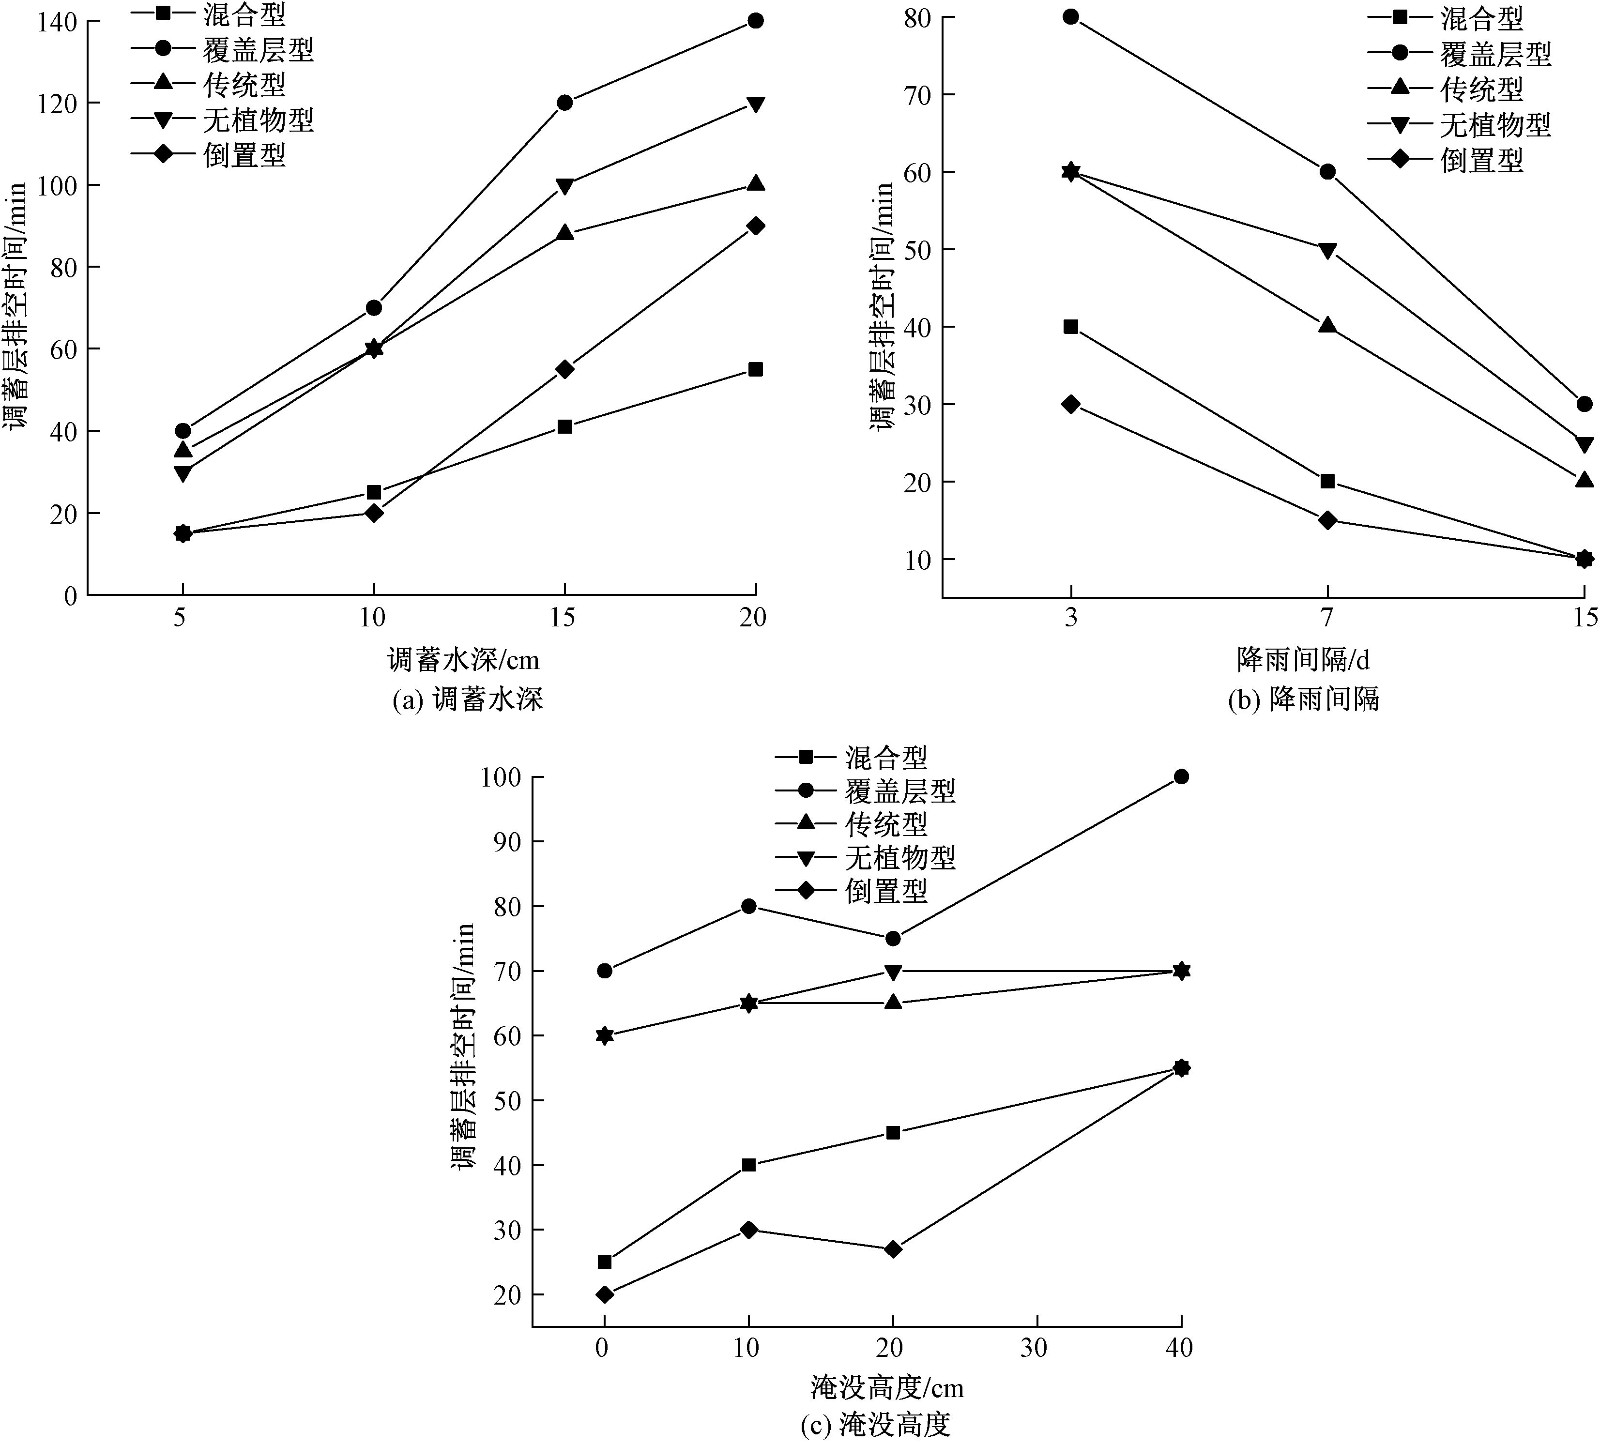
图 5 不同类型生物滞留设施调蓄层排空时间变化
Figure 5. Comparison of emptying time of storage layer among different types of bioretention facilities

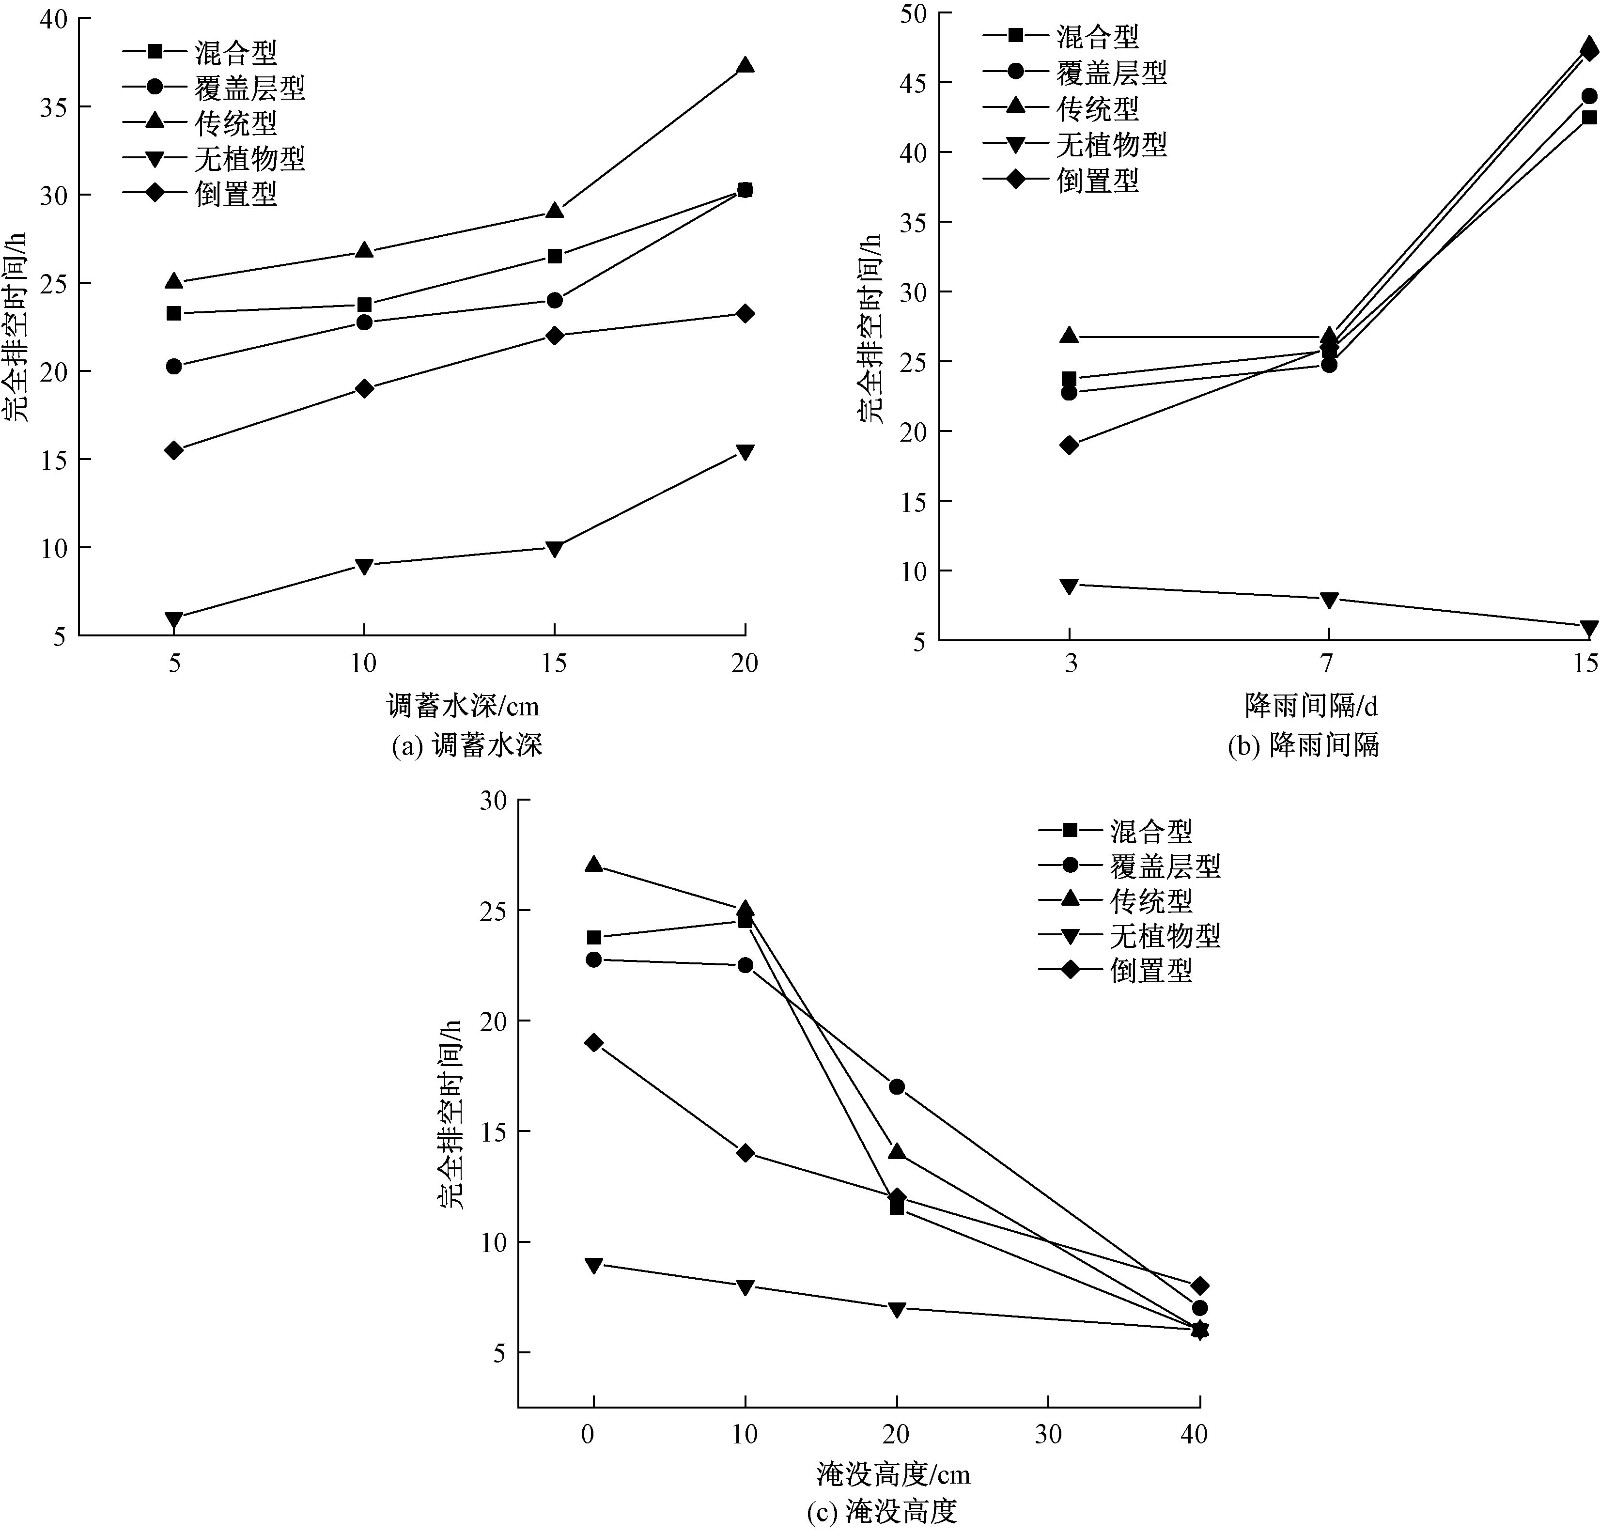
图 6 不同类型生物滞留设施完全排空时间变化
Figure 6. Comparison of complete emptying time of different types of bioretention facilities
表 1 美国部分地区生物滞留设施排空时间
Table 1. Emptying time of bioretention facilities in different districts of the United States
h  下载: 导出CSV
表 2 试验方案
Table 2. Experimental scheme
试验名称 试验内容 其他试验条件 调蓄水深 5、10、15、20 cm 淹没高度0 cm、降雨间隔3 d 淹没高度 0、10、20、40 cm 调蓄水深10 cm、降雨间隔3 d 降雨间隔 3、7、15 d 调蓄水深10 cm、淹没高度0 cm
下载: 导出CSV
表 3 生物滞留种植层不同深度渗透速率
Table 3. Permeation rates at different depths of planting layer of the bioretention
cm/h 项目 传统型 无植物型 倒置型 混合型 覆盖层型 q1 2.89 1.82 500.00 10.83 2.56 q2 3.25 2.31 6.47 11.82 3.03 q3 5.20 3.47 5.82 13.00 5.50 q4 3.25 2.17 4.16 5.91 3.56 Kequ 3.06 2.04 12.77 11.30 2.78 K 10.93 4.62 5.80 11.56 8.06 注:q1~q4分别为0~10、10~20、20~30、30~40 cm深度的雨水渗透速率; Kequ为种植层0 ~ 20 cm等效渗透系数; K为装置整体渗透系数。
下载: 导出CSV
表 4 传统型不同调蓄水深时排空时间
Table 4. Emptying time of traditional bioretention at different retention water heights
调蓄水深/
cm进水总量/
L开始出流
时间/min出流总量/
L调蓄层排空
时间/min完全排空
时间/h5 8 55 4.83 35 25 10 16 35 10.32 60 27 15 24 27 16.10 88 29 20 32 26 25.76 100 37
下载: 导出CSV
表 5 传统型不同降雨间隔条件时排空时间
Table 5. Emptying time of traditional bioretention under different rainfall intervals
降雨间隔/
d进水总量/
L开始出流
时间/min出流总量/
L调蓄层排空
时间/min完全排空
时间/h3 16 35 10.32 60 27 7 16 35 6.85 40 27 15 16 31 5.65 20 47
下载: 导出CSV
表 6 传统型不同淹没高度时排空时间
Table 6. Emptying time of traditional bioretention at different inundation heights
淹没高度/
cm进水总量/
L开始出流
时间/min出流总量/
L调蓄层排空
时间/min完全排空
时间/h0 16 35 10.32 60 27 10 16 35 9.35 65 25 20 16 44 7.34 65 14 40 16 60 6.68 70 6
下载: 导出CSV
表 7 调蓄层排空时间影响因素相关性分析
Table 7. Correlation analysis of factors influencing the emptying time of storage layer
项目 调蓄水深 淹没高度 降雨间隔 显著性(P) 0.012 0.044 0.021 相关系数 0.988 0.956 −0.982
下载: 导出CSV
表 8 完全排空时间影响因素相关性分析
Table 8. Correlation analysis of influencing factors of complete emptying time
项目 调蓄水深 淹没高度 降雨间隔 显著性(P) 0.019 0.049 0.029 相关系数 0.981 −0.971 0.996
下载: 导出CSV
-
[1] 北京市规划和自然资源委员会. 海绵城市建设设计标准: DB11/T 1743—2020[S]. 北京: 中国标准出版社, 2020. [2] 梁小光, 魏忠庆, 上官海东, 等.海绵城市建设中生物滞留设施排空时间研究[J]. 给水排水,2018,54(11):26-30. doi: 10.3969/j.issn.1002-8471.2018.11.004LIANG X G, WEI Z Q, SHANGGUAN H D, et al. Research on the emptying time of biological detention facility in sponge city construction[J]. Water & Wastewater Engineering,2018,54(11):26-30. doi: 10.3969/j.issn.1002-8471.2018.11.004 [3] 马越, 胡志平, 姬国强, 等.湿陷性黄土地区海绵城市建设雨水渗蓄风险防控若干问题探讨[J]. 给水排水,2020,56(9):70-77.MA Y, HU Z P, JI G Q, et al. Discussion on risk control of stormwater infiltration and detention for sponge city construction in collapsible loess area[J]. Water & Wastewater Engineering,2020,56(9):70-77. [4] 杨庆华, 杨乾, 唐雪芹. 基于低影响开发策略的雨水调蓄容积取值计算[C]//《环境工程》2018年全国学术年会论文集(下册).北京: 《环境工程》编辑部, 2018: 264-268. [5] 唐雪芹. 城市道路生物滞留带蓄渗效应研究[D]. 成都: 西南交通大学, 2018. [6] 住房和城乡建设部. 城镇内涝防治技术规范: GB 51222—2017[S]. 北京: 中国计划出版社, 2017. [7] GREG H, REBECCA C S, BRAIN V W. Draft district of Columbia stormwater management guidebook[R]. Ellicott City: Center for Watershed Protection, 2013. [8] BLICK S A, KELLY F, SKUPIEN J J. New Jersey stormwater best management practices manual[R]. Trenton:New Jersey:New Jersey Department of Environmental Protection, 2004. [9] MEAN P E, EFFICIENCIES B M P P R. Pennsylvania stormwater best management practices manual[R]. Harrisburg:Pennsylvania Department of Environmental Protection, 2006. [10] Center for Watershed Protection. New York State stormwater management design manual[R]. New York:New York State Department of Environmental Conservation, 2003. [11] Minnesota Stormwater Steering Committee. The Minnesota stormwater manual[R]. Saint Paul:Minnesota Pollution Control Agency, 2005. [12] JANIS B,ANDY B,THOMAS C.Low impact development manual for Michigan:a design guide for implementers and reviewers[M]. Detroit:Southeast Michigan Council of Governments (SEMCOG),2008. [13] NICK L, JEFF D, JOHN M. Maine Stormwater Management Design Manual[R]. Augusta:Maine Department of Environmental Protection, 2016. [14] CHENG M S, ZHEN J X, SHOEMAKER L. BMP decision support system for evaluating stormwater management alternatives[J]. Frontiers of Environmental Science & Engineering in China,2009,3(4):453-463. [15] Charlotte-Mecklenburg Storm Water Services.Charlotte-Mecklenburg BMP design manual[R].Raleigh:North Carolina Department of Environment and Natural Resources (NCDENR),2013. [16] KASPARI P, ALLEN S. Environmentally sound approaches for stormwater management on Pacific Island Nations[C]//World Environmental and Water Resources Congress 2008, Honolulu, Hawaii, USA: American Society of Civil Engineers, 2008: 1-11. [17] HAUBNER S M. Georgia stormwater management manual[R]. Atlanta:Georgia Institute of Technology, 2001. [18] Connecticut Department of Energy and Environmental Protection (CDEEP). Connecticut stormwater quality manual[R]. Hardford: CDEEP, 2004. [19] Clean Water Program’s Management Committee.Clean water program Alameda County[R/OL].2019.[2021-05-10].https://www.cleanwaterprogram.org/c3-guidance-table.html. [20] Urban Drainage and Flood Control District(UDFCD). Urban storm drainage criteria manual: volume 3: stormwater quality[R]. Washington DC: Environmental Protection Agency, 2018. [21] IOWA Department of Natural Resources. Iowa stormwater management manual[R].Des Moines: IOWA Department of Environmental Protection, 2007. [22] 冉阳, 付峥嵘, 马满英, 等.改良型生物滞留池在海绵城市雨水处理中的研究与应用[J]. 环境工程技术学报,2021,11(1):173-180. doi: 10.12153/j.issn.1674-991X.20200094RAN Y, FU Z R, MA M Y, et al. Research and application of amended bioretention tank in rainwater treatment of sponge city[J]. Journal of Environmental Engineering Technology,2021,11(1):173-180. doi: 10.12153/j.issn.1674-991X.20200094 [23] 谢瑶. 重庆市海绵城市建设技术模式研究[D]. 重庆: 重庆大学, 2016. [24] 林宏军, 王建龙, 赵梦圆, 等.倒置生物滞留技术水量水质控制效果研究[J]. 水利水电技术,2019,50(6):11-17.LIN H J, WANG J L, ZHAO M Y, et al. Study on water quantity and water quality control effect of inverted bioretention technology[J]. Water Resources and Hydropower Engineering,2019,50(6):11-17. [25] 仇付国, 王珂, 李林彬, 等.滞留时间和进水有机物对生物滞留系统除氮的影响[J]. 科学技术与工程,2018,18(4):197-202. doi: 10.3969/j.issn.1671-1815.2018.04.031QIU F G, WANG K, LI B B, et al. Effect of retention time and organic matter on the nitrogen removal by bioretention[J]. Science Technology and Engineering,2018,18(4):197-202. doi: 10.3969/j.issn.1671-1815.2018.04.031 [26] 刘霞, 张光灿, 李雪蕾, 等.小流域生态修复过程中不同森林植被土壤入渗与贮水特征[J]. 水土保持学报,2004,18(6):1-5. doi: 10.3321/j.issn:1009-2242.2004.06.001LIU X, ZHANG G C, LI X L, et al. Characteristics of soil infiltration and water-holding of different forest vegetation in ecological rehabilitation of small watershed[J]. Journal of Soil and Water Conservation,2004,18(6):1-5. doi: 10.3321/j.issn:1009-2242.2004.06.001 [27] 郭雷. 林灌草根系通道对土壤水分入渗的影响研究[D]. 咸阳: 西北农林科技大学, 2020. [28] LUO W Z, LI J H, SONG L, et al. Effects of vegetation on the hydraulic properties of soil covers: four-years field experiments in Southern China[J]. Rhizosphere,2020,16:100272. ⊗ doi: 10.1016/j.rhisph.2020.100272 -

 下载:
下载:


 点击查看大图

计量
- 文章访问数: 322
- HTML全文浏览量: 217
- PDF下载量: 18
- 被引次数: 0