| Citation: | LI Y Y,SHENG Q,DAI J.Spatio-temporal evolution characteristics of carbon emissions in Beijing-Tianjin-Hebei urban agglomeration derived from integrated data of DMSP-OLS and NPP-VIIRS[J].Journal of Environmental Engineering Technology,2023,13(2):447-454 doi: 10.12153/j.issn.1674-991X.20220089

|
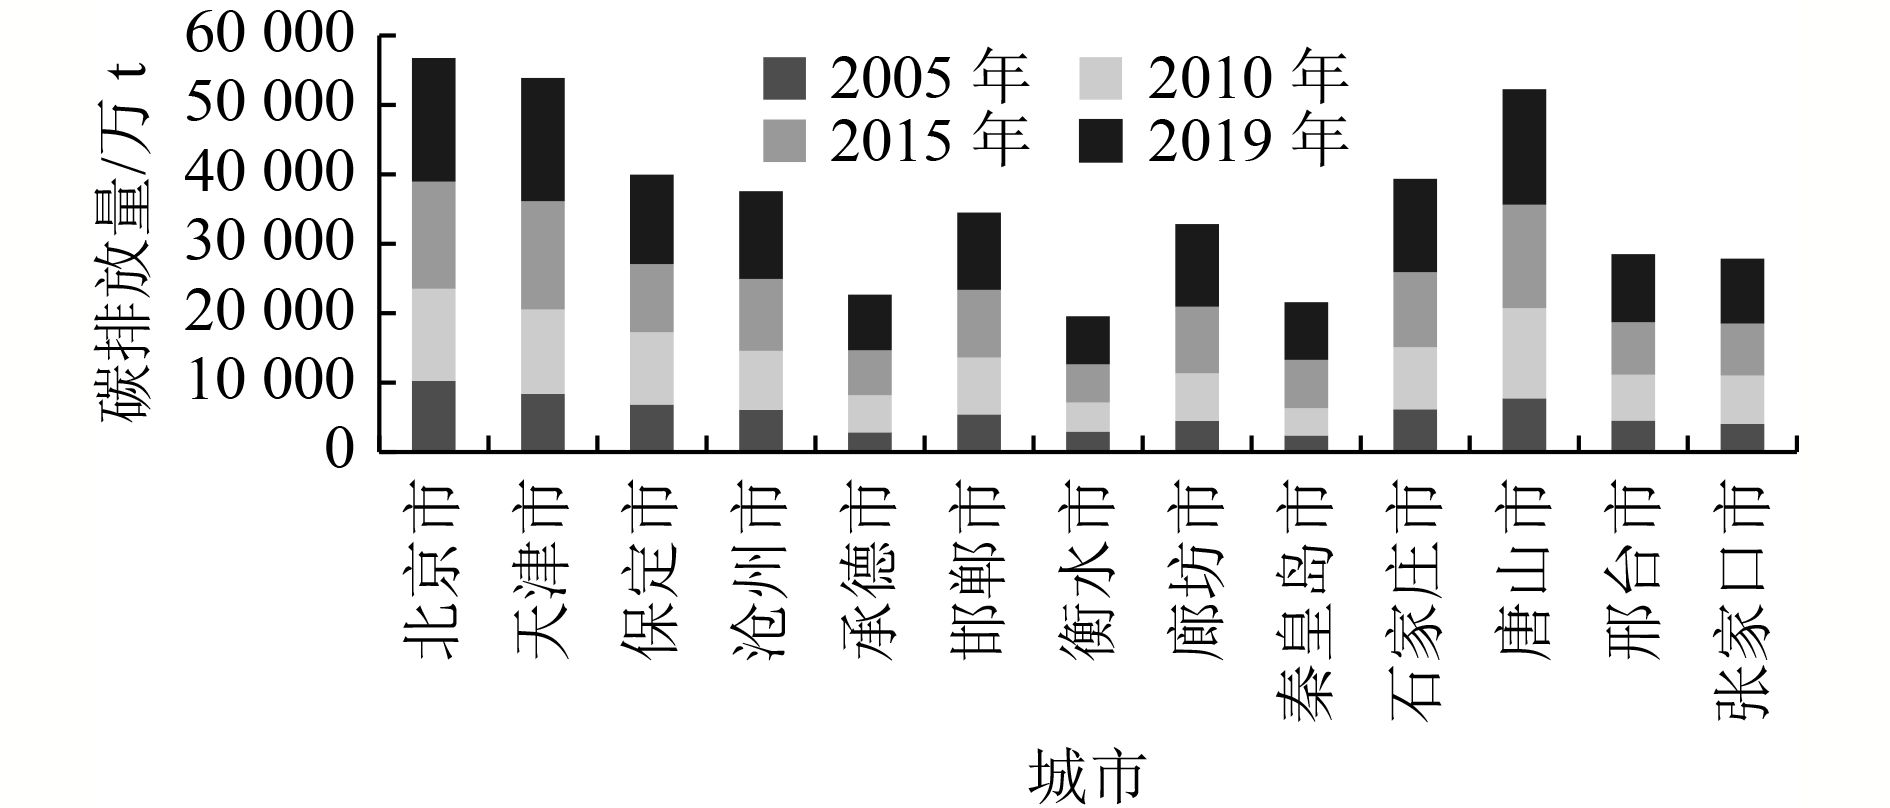
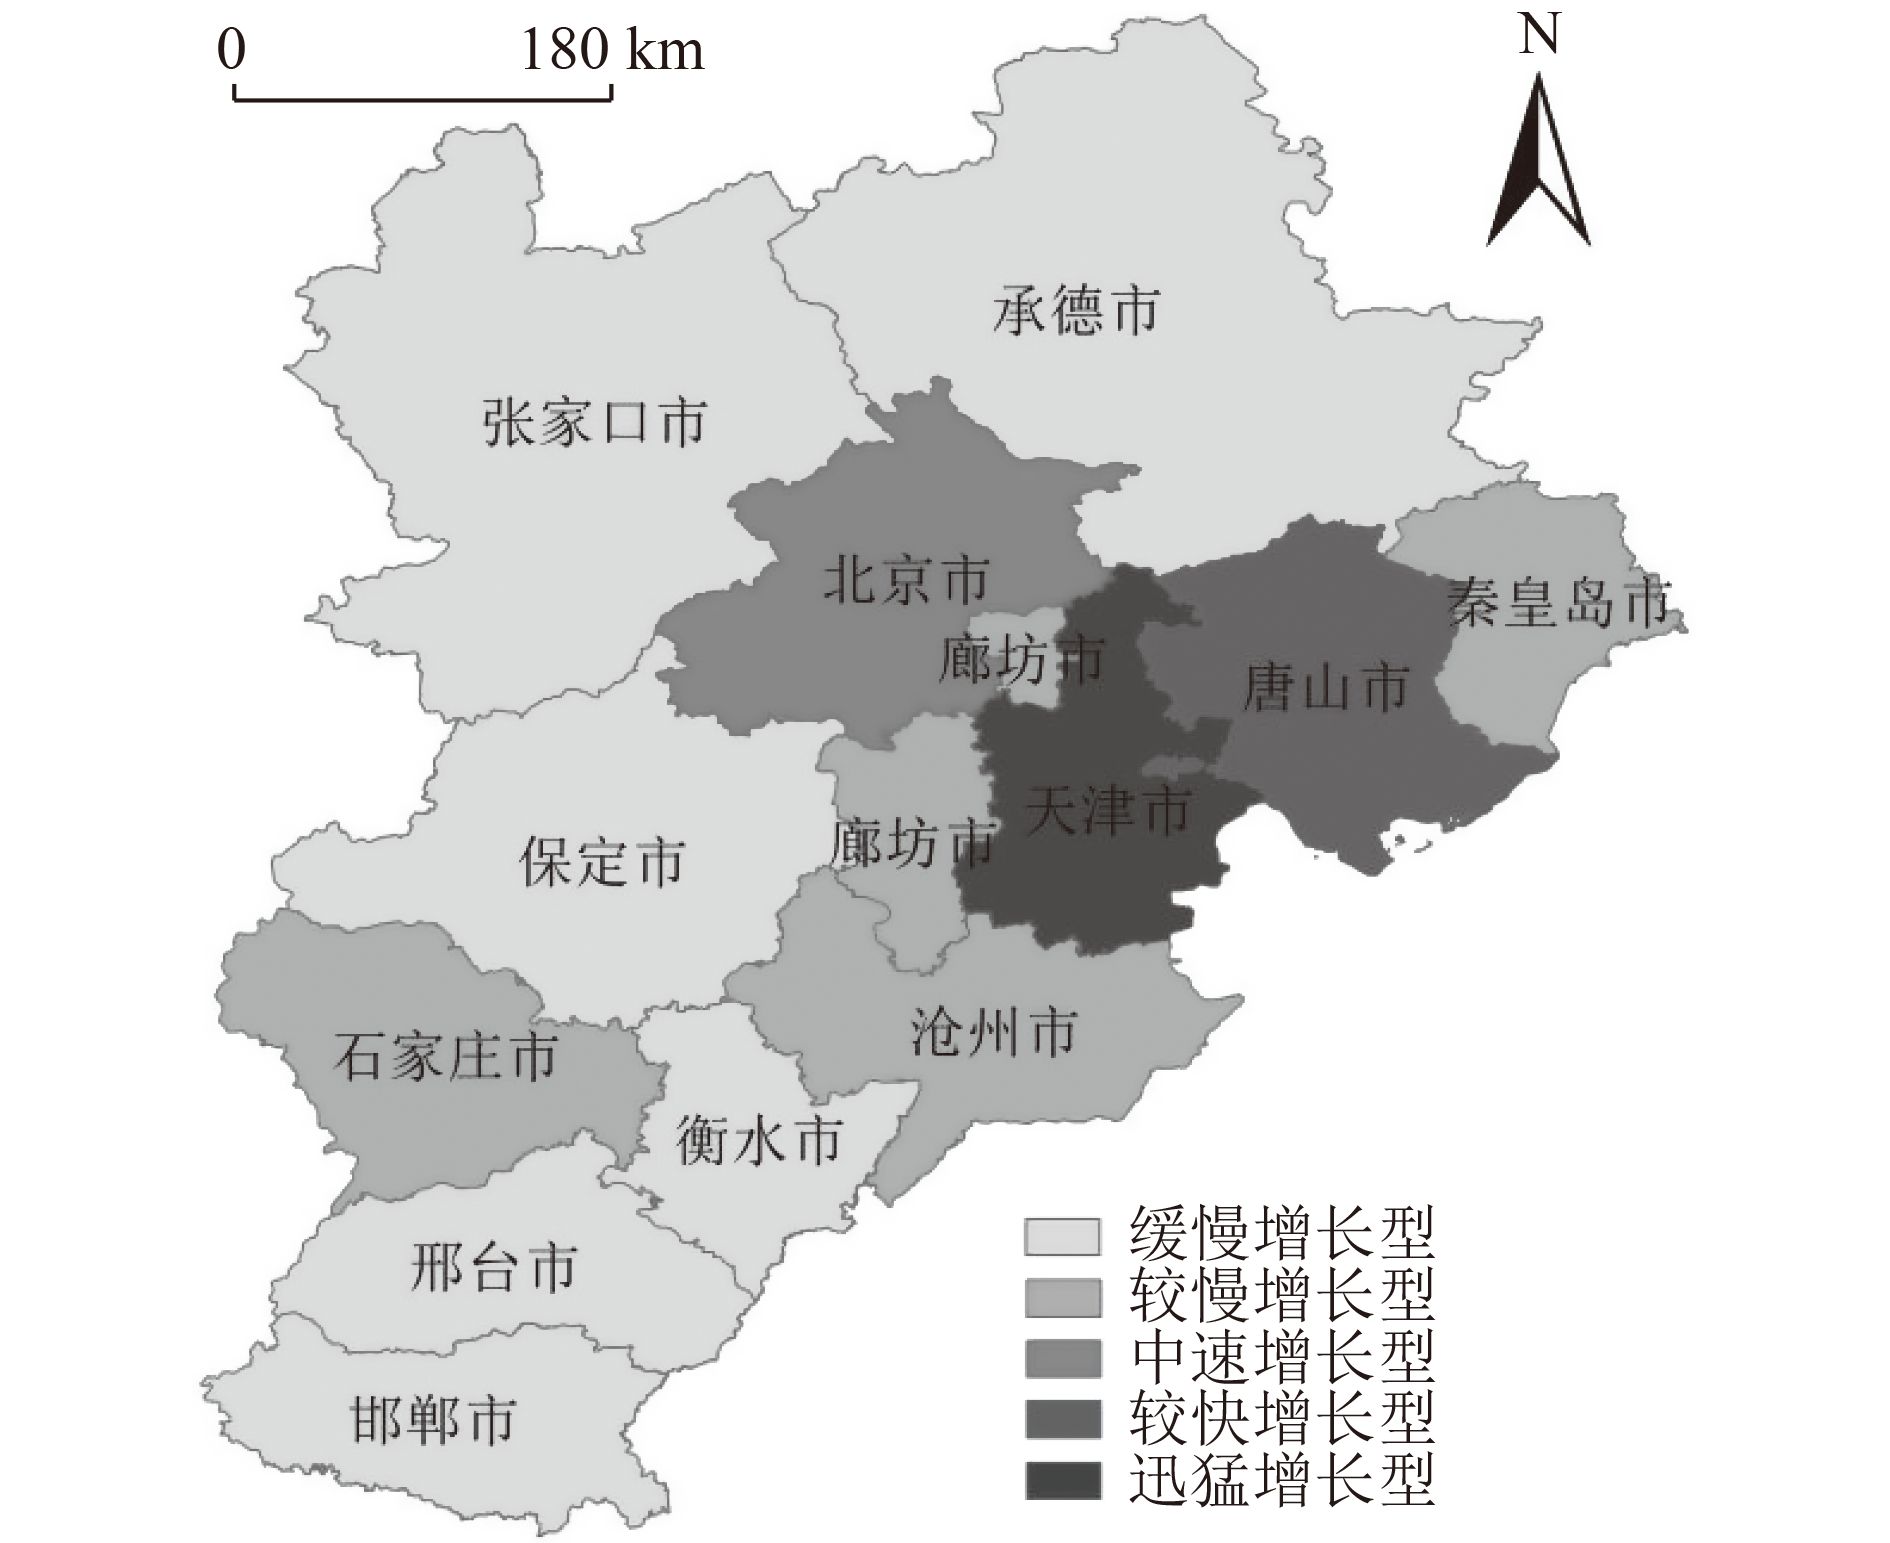
Beijing-Tianjin-Hebei urban agglomeration(BTHUA) was taken as the study area to explore the spatio-temporal evolution characteristics of carbon emissions at the city level and above. By fitting the optimal model, NPP-VIIRS data was transformed into DMSP-OLS scale nighttime light data, and the long-time series nightlight image set of BTHUA from 2005 to 2019 was obtained. Combined with the provincial energy consumption statistical and carbon emission data, a municipal scale carbon emission estimation model at the city level and above in BTHUA was constructed. The spatial distribution of carbon emissions in BTHUA was simulated, and the temporal and spatial evolution characteristics of carbon emissions were explored in combination with the tendency value method. The results showed that: From 2005 to 2019, the correlation between nighttime light data and carbon emissions of energy consumption in BTHUA was high, and the significance test of 1% was passed. From 2005 to 2019, the carbon emissions of 13 cities in BTHUA were basically increasing gradually. Overall, the growth rate of carbon emissions in BTHUA was relatively slow from 2005 to 2019. Among them, Beijing-Tianjin-Tangshan area had a rapid growth rate. In 2019, many of the 13 cities in BTHUA reduced their carbon emissions per unit of GDP by more than 40% compared with that in 2005. The research showed that the nighttime light data could be used to estimate the carbon emissions of BTHUA, and the carbon emissions in Beijing-Tianjin-Tangshan area were high and the growth rate was fast, so it should be regarded as a key carbon emission reduction area.

| [1] |
WISE M, CALVIN K, THOMSON A, et al. Implications of limiting CO2 concentrations for land use and energy[J]. Science,2009,324:1183-1186. doi: 10.1126/science.1168475
|
| [2] |
沈岩, 武彤冉, 闫静, 等.基于COPERT模型北京市机动车大气污染物和二氧化碳排放研究[J]. 环境工程技术学报,2021,11(6):1075-1082. doi: 10.12153/j.issn.1674-991X.20210289
SHEN Y, WU T R, YAN J, et al. Investigation on air pollutants and carbon dioxide emissions from motor vehicles in Beijing based on COPERT model[J]. Journal of Environmental Engineering Technology,2021,11(6):1075-1082. doi: 10.12153/j.issn.1674-991X.20210289
|
| [3] |
郭宇杰, 龚亚萍, 邹玉飞, 等. 天津市生活垃圾处理碳排放时间变化特征及影响因素[J]. 环境工程技术学报2022, 12(3): 834-842.
GUO Y, GONG Y P, ZOU Y F, et al. Temporal variation characteristics and influencing factors of carbon emissions from municipal solid waste treatment in Tianjin[J]. Journal of Environmental Engineering Technology, 2022, 12(3): 834-842.
|
| [4] |
何永贵, 于江浩.河北省碳排放及其影响因素变化趋势研究[J]. 环境科学与技术,2018,41(1):184-191.
HE Y G, YU J H. Study on the change trend of carbon emissions and its influencing factors in Hebei Province[J]. Environmental Science & Technology,2018,41(1):184-191.
|
| [5] |
李健, 李海霞.产业转移视角下京津冀石化产业碳排放因素分解与减排潜力分析[J]. 环境科学研究,2020,33(2):324-332. doi: 10.13198/j.issn.1001-6929.2019.05.05
LI J, LI H X. Analysis of carbon emission factors decomposition and emission reduction potential of Beijing-Tianjin-Hebei Regional petrochemical industry from the perspective of industrial transfer[J]. Research of Environmental Sciences,2020,33(2):324-332. doi: 10.13198/j.issn.1001-6929.2019.05.05
|
| [6] |
武娜, 沈镭, 钟帅.基于夜间灯光数据的晋陕蒙能源消费碳排放时空格局[J]. 地球信息科学学报,2019,21(7):1040-1050. doi: 10.12082/dqxxkx.2019.190010
WU N, SHEN L, ZHONG S. Spatio-temporal pattern of carbon emissions based on nightlight data of the Shanxi-Shaanxi-Inner Mongolia region of China[J]. Journal of Geo-Information Science,2019,21(7):1040-1050. doi: 10.12082/dqxxkx.2019.190010
|
| [7] |
林中立, 徐涵秋, 陈弘.我国东部沿海三大城市群热岛变化及其与城市群发展的关系[J]. 环境科学研究,2018,31(10):1695-1704.
LIN Z L, XU H Q, CHEN H. Urban heat island change and its relationship to the urbanization of three major urban agglomerations in China's eastern coastal region[J]. Research of Environmental Sciences,2018,31(10):1695-1704.
|
| [8] |
USTAOGLU E, BOVKR R, AYDNOGLU A C. Spatial distribution of GDP based on integrated NPS-VIIRS nighttime light and MODIS EVI data: a case study of Turkey[J]. Environment, Development and Sustainability,2021,23(7):10309-10343. doi: 10.1007/s10668-020-01058-5
|
| [9] |
CHANG S Z, WANG Z M, MAO D H, et al. Mapping the essential urban land use in Changchun by applying random forest and multi-source geospatial data[J]. Remote Sensing,2020,12(15):2488. doi: 10.3390/rs12152488
|
| [10] |
SAHOO S, GUPTA P K, SRIVASTAV S K. Comparative analysis between VIIRS-DNB and DMSP-OLS night-time light data to estimate electric power consumption in Uttar Pradesh, India[J]. International Journal of Remote Sensing,2020,41(7):2565-2580. doi: 10.1080/01431161.2019.1693077
|
| [11] |
STATHAKIS D, BALTAS P. Seasonal population estimates based on night-time lights[J]. Computers, Environment and Urban Systems,2018,68:133-141. doi: 10.1016/j.compenvurbsys.2017.12.001
|
| [12] |
何则, 杨宇, 宋周莺, 等.中国能源消费与经济增长的相互演进态势及驱动因素[J]. 地理研究,2018,37(8):1528-1540.
HE Z, YANG Y, SONG Z Y, et al. The mutual evolution and driving factors of China's energy consumption and economic growth[J]. Geographical Research,2018,37(8):1528-1540.
|
| [13] |
ELVIDGE C D, BAUGH K E, KIHN E A, et al. Relation between satellite observed visible-near infrared emissions, population, economic activity and electric power consumption[J]. International Journal of Remote Sensing,1997,18(6):1373-1379. doi: 10.1080/014311697218485
|
| [14] |
马忠玉, 肖宏伟.基于卫星夜间灯光数据的中国分省碳排放时空模拟[J]. 中国人口·资源与环境,2017,27(9):143-150.
MA Z Y, XIAO H W. Spatiotemporal simulation study of China's provincial carbon emissions based on satellite night lighting data[J]. China Population, Resources and Environment,2017,27(9):143-150.
|
| [15] |
施开放. 多尺度视角下的中国碳排放时空格局动态及影响因素研究: 基于DMSP-OLS夜间灯光遥感数据的分析[D]. 上海: 华东师范大学, 2017.
|
| [16] |
WANG S J, SHI C Y, FANG C L, et al. Examining the spatial variations of determinants of energy-related CO2 emissions in China at the city level using[J]. Applied Energy,2019,235:95-105. doi: 10.1016/j.apenergy.2018.10.083
|
| [17] |
于博, 杨旭, 吴相利. 哈长城市群县域碳排放空间溢出效应及影响因素研究: 基于NPP-VIIRS夜间灯光数据的实证[J]. 环境科学学报, 2020, 40(2): 697-706.
YU B,YANG X,WU X L. Study on spatial spillover effects and influencing factors of carbon emissions in county areas of Ha-Chang City Group: evidence from NPP-VIIRS nightlight data[J]. Acta Scientiae Circumstantiae, 2020, 40(2): 697-706.
|
| [18] |
牛亚文, 赵先超, 胡艺觉.基于NPP-VIIRS夜间灯光的长株潭地区县域土地利用碳排放空间分异研究[J]. 环境科学学报,2021,41(9):3847-3856. doi: 10.13671/j.hjkxxb.2021.0281
NIU Y W, ZHAO X C, HU Y J. Spatial variation of carbon emissions from county land use in Chang-Zhu-Tan area based on NPP-VIIRS night light[J]. Acta Scientiae Circumstantiae,2021,41(9):3847-3856. doi: 10.13671/j.hjkxxb.2021.0281
|
| [19] |
ZHANG X W, WU J S, PENG J, et al. The uncertainty of nighttime light data in estimating carbon dioxide emissions in China: a comparison between DMSP-OLS and NPP-VIIRS[J]. Remote Sensing,2017,9(8):797. doi: 10.3390/rs9080797
|
| [20] |
ZHAO J C, CHEN Y L, JI G X, et al. Residential carbon dioxide emissions at the urban scale for county-level cities in China: a comparative study of nighttime light data[J]. Journal of Cleaner Production,2018,180:198-209. doi: 10.1016/j.jclepro.2018.01.131
|
| [21] |
ZHAO J C, JI G X, YUE Y L, et al. Spatio-temporal dynamics of urban residential CO2 emissions and their driving forces in China using the integrated two nighttime light datasets[J]. Applied Energy,2019,235:612-624. doi: 10.1016/j.apenergy.2018.09.180
|
| [22] |
LÜ Q, LIU H B, WANG J T, et al. Multiscale analysis on spatiotemporal dynamics of energy consumption CO2 emissions in China: utilizing the integrated of DMSP-OLS and NPP-VIIRS nighttime light datasets[J]. Science of the Total Environment,2020,703:134394. doi: 10.1016/j.scitotenv.2019.134394
|
| [23] |
京津冀协同发展领导小组. 京津冀协同发展规划纲要 [R]. 北京: 中央财经领导小组, 2015.
|
| [24] |
LIU Z F, HE C Y, ZHANG Q F, et al. Extracting the dynamics of urban expansion in China using DMSP-OLS nighttime light data from 1992 to 2008[J]. Landscape and Urban Planning,2012,106(1):62-72. doi: 10.1016/j.landurbplan.2012.02.013
|
| [25] |
ZHAO M, ZHOU Y Y, LI X C, et al. Building a series of consistent night-time light data (1992-2018) in Southeast Asia by integrating DMSP-OLS and NPP-VIIRS[J]. IEEE Transactions on Geoscience and Remote Sensing,2020,58(3):1843-1856. doi: 10.1109/TGRS.2019.2949797
|
| [26] |
LI X, LI D R, XU H M, et al. Intercalibration between DMSP/OLS and VIIRS night-time light images to evaluate city light dynamics of Syria's major human settlement during Syrian Civil War[J]. International Journal of Remote Sensing,2017,38(21):5934-5951. doi: 10.1080/01431161.2017.1331476
|
| [27] |
董鹤松, 李仁杰, 李建明, 等.基于DMSP-OLS与NPP-VIIRS整合数据的中国三大城市群城市空间扩展时空格局[J]. 地球信息科学学报,2020,22(5):1161-1174. doi: 10.12082/dqxxkx.2020.190711
DONG H S, LI R J, LI J M, et al. Study on urban spatiotemporal expansion pattern of three first-class urban agglomerations in China derived from integrated DMSP-OLS and NPP-VIIRS nighttime light data[J]. Journal of Geo-Information Science,2020,22(5):1161-1174. doi: 10.12082/dqxxkx.2020.190711
|
| [28] |
吕倩, 刘海滨.基于夜间灯光数据的黄河流域能源消费碳排放时空演变多尺度分析[J]. 经济地理,2020,40(12):12-21.
LÜ Q, LIU H B. Multiscale spatio-temporal characteristics of carbon emission of energy consumption in Yellow River Basin based on the nighttime light datasets[J]. Economic Geography,2020,40(12):12-21.
|
| [29] |
苏泳娴, 陈修治, 叶玉瑶, 等.基于夜间灯光数据的中国能源消费碳排放特征及机理[J]. 地理学报,2013,68(11):1513-1526. doi: 10.11821/dlxb201311007
SU Y X, CHEN X Z, YE Y Y, et al. The characteristics and mechanisms of carbon emissions from energy consumption in China using DMSP/OLS night light imageries[J]. Acta Geographica Sinica,2013,68(11):1513-1526. ⊗ doi: 10.11821/dlxb201311007
|

Figures(5) / Tables(5)
Copyright © Editorial Department of Journal of Environmental Engineering Technology
Supported by: Beijing Renhe Information Technology Co., Ltd.


 DownLoad: