| Citation: | WENG Q R,LV X,SUN M D,et al.Spatial distribution and source analysis of pollutants in Daliao River Basin based on control unit division[J].Journal of Environmental Engineering Technology,2023,13(1):171-179 doi: 10.12153/j.issn.1674-991X.20210573

|
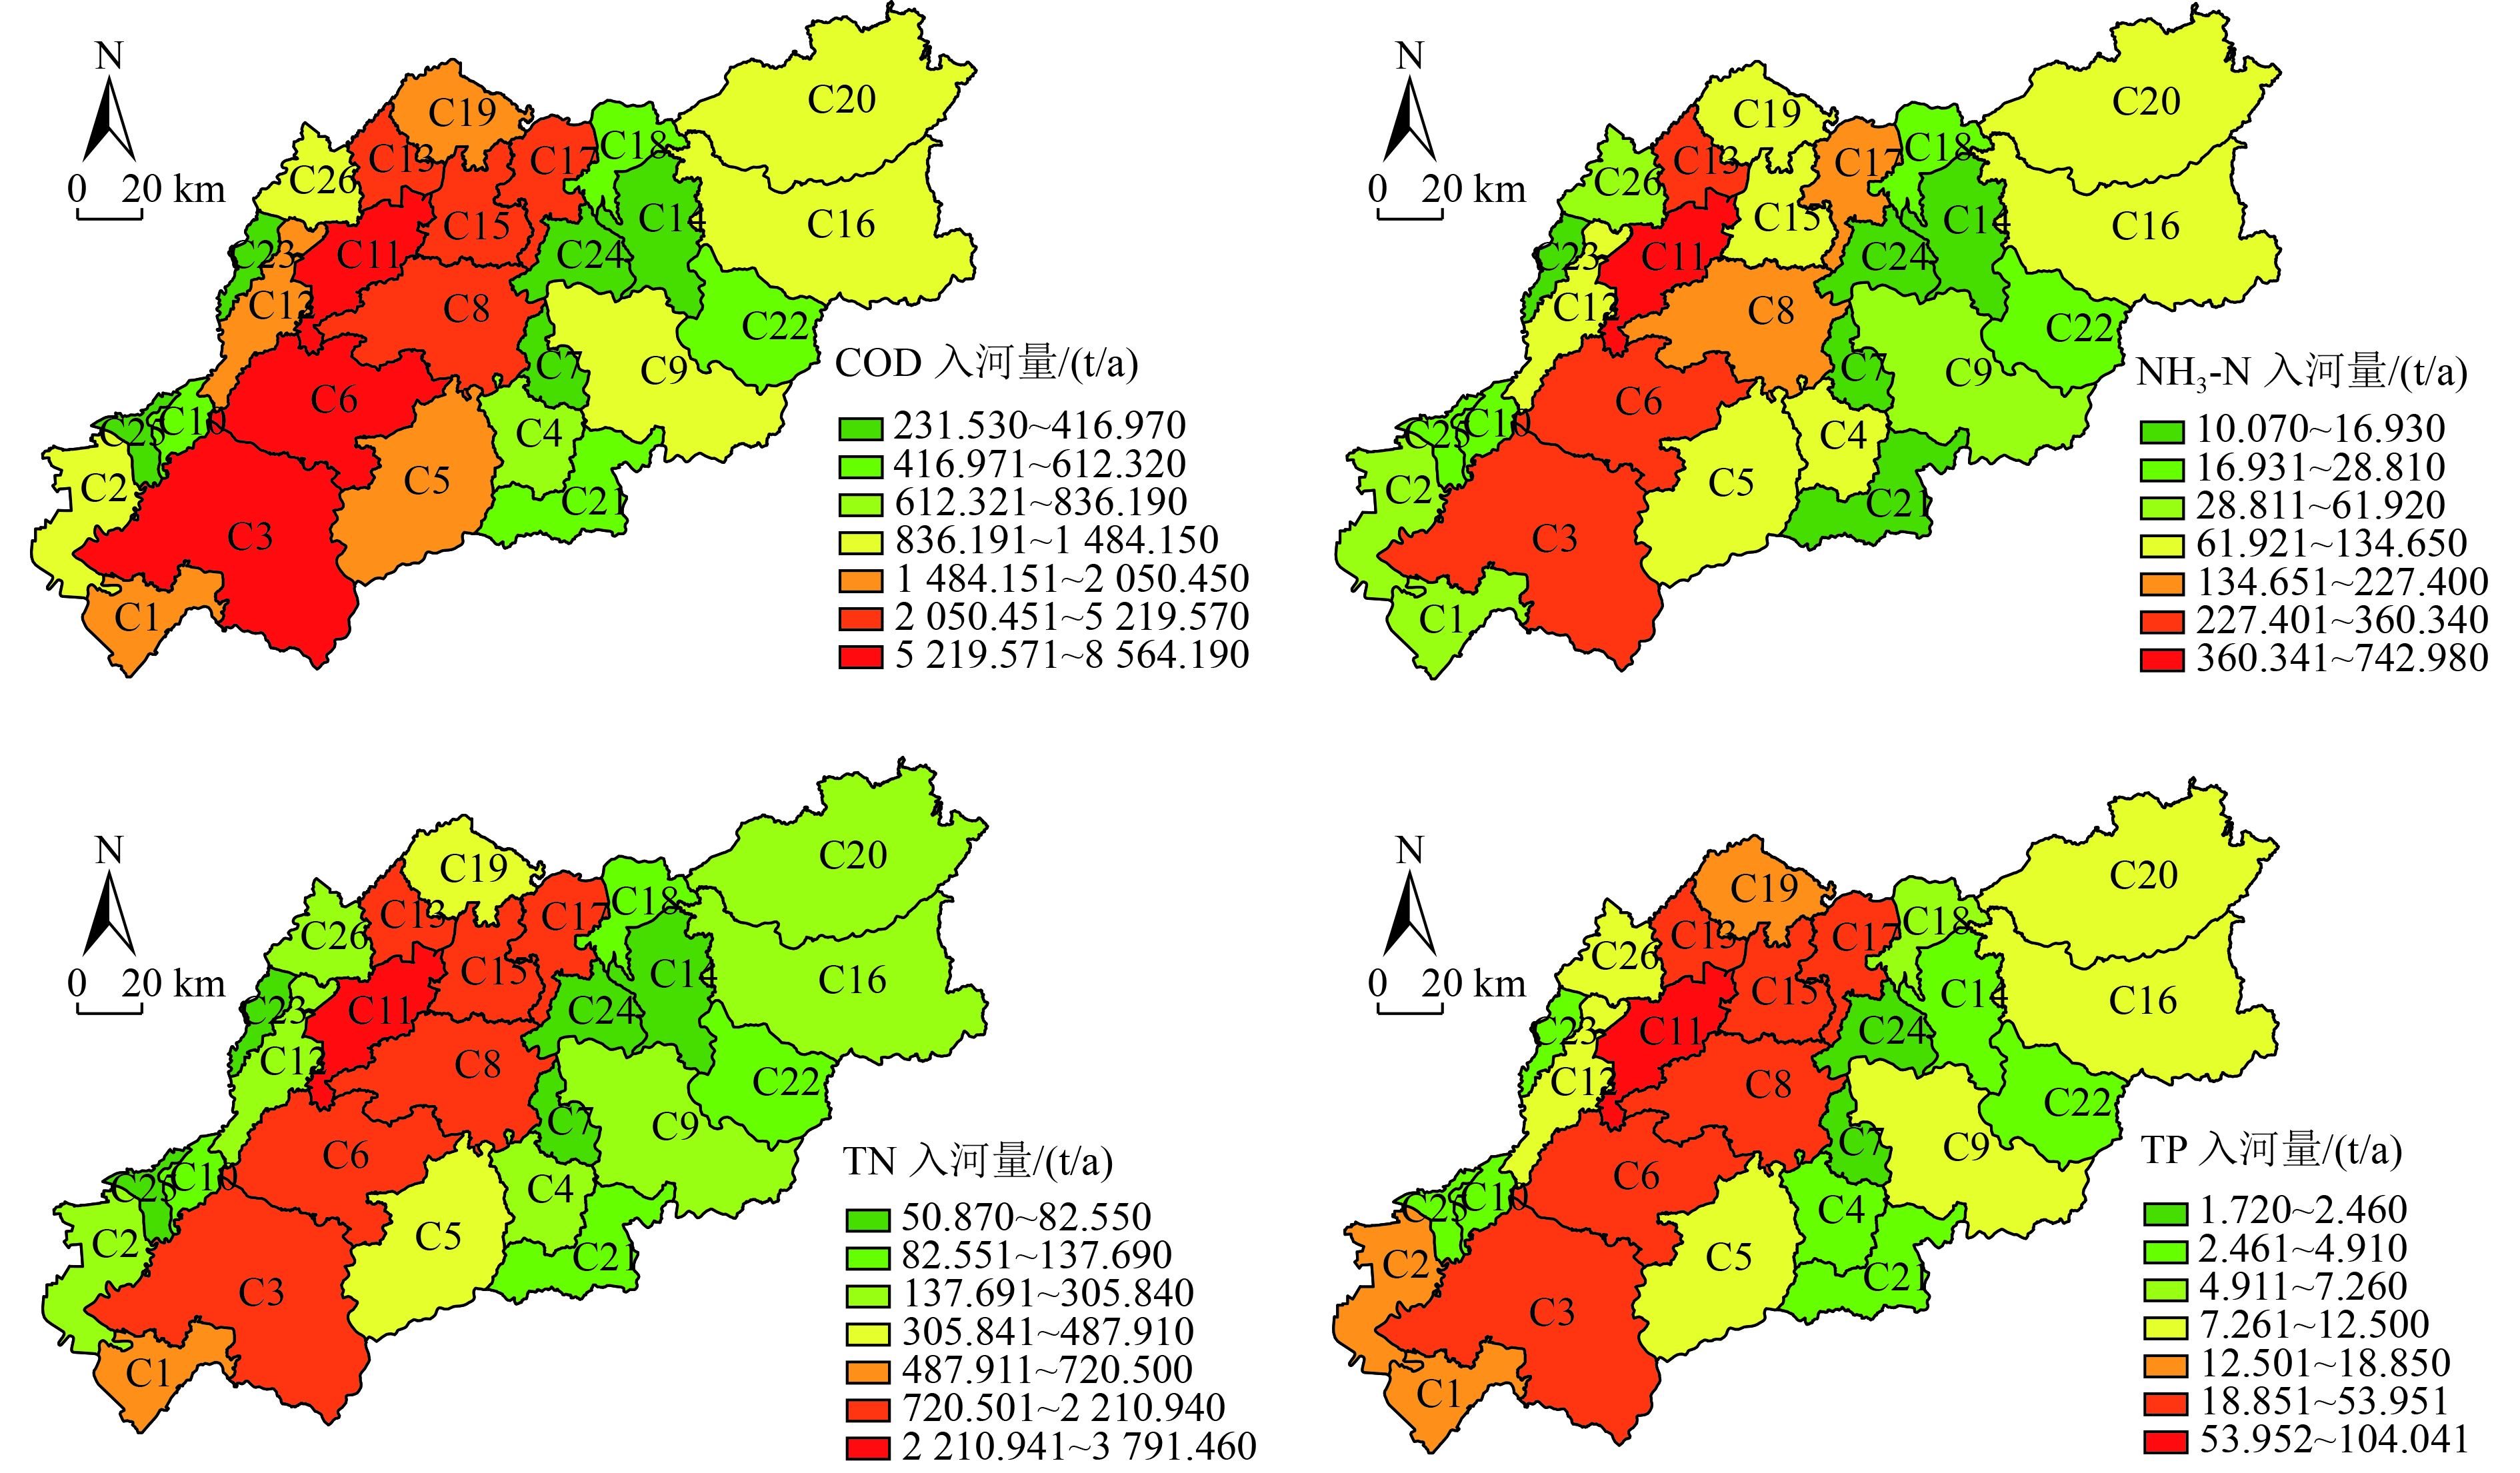
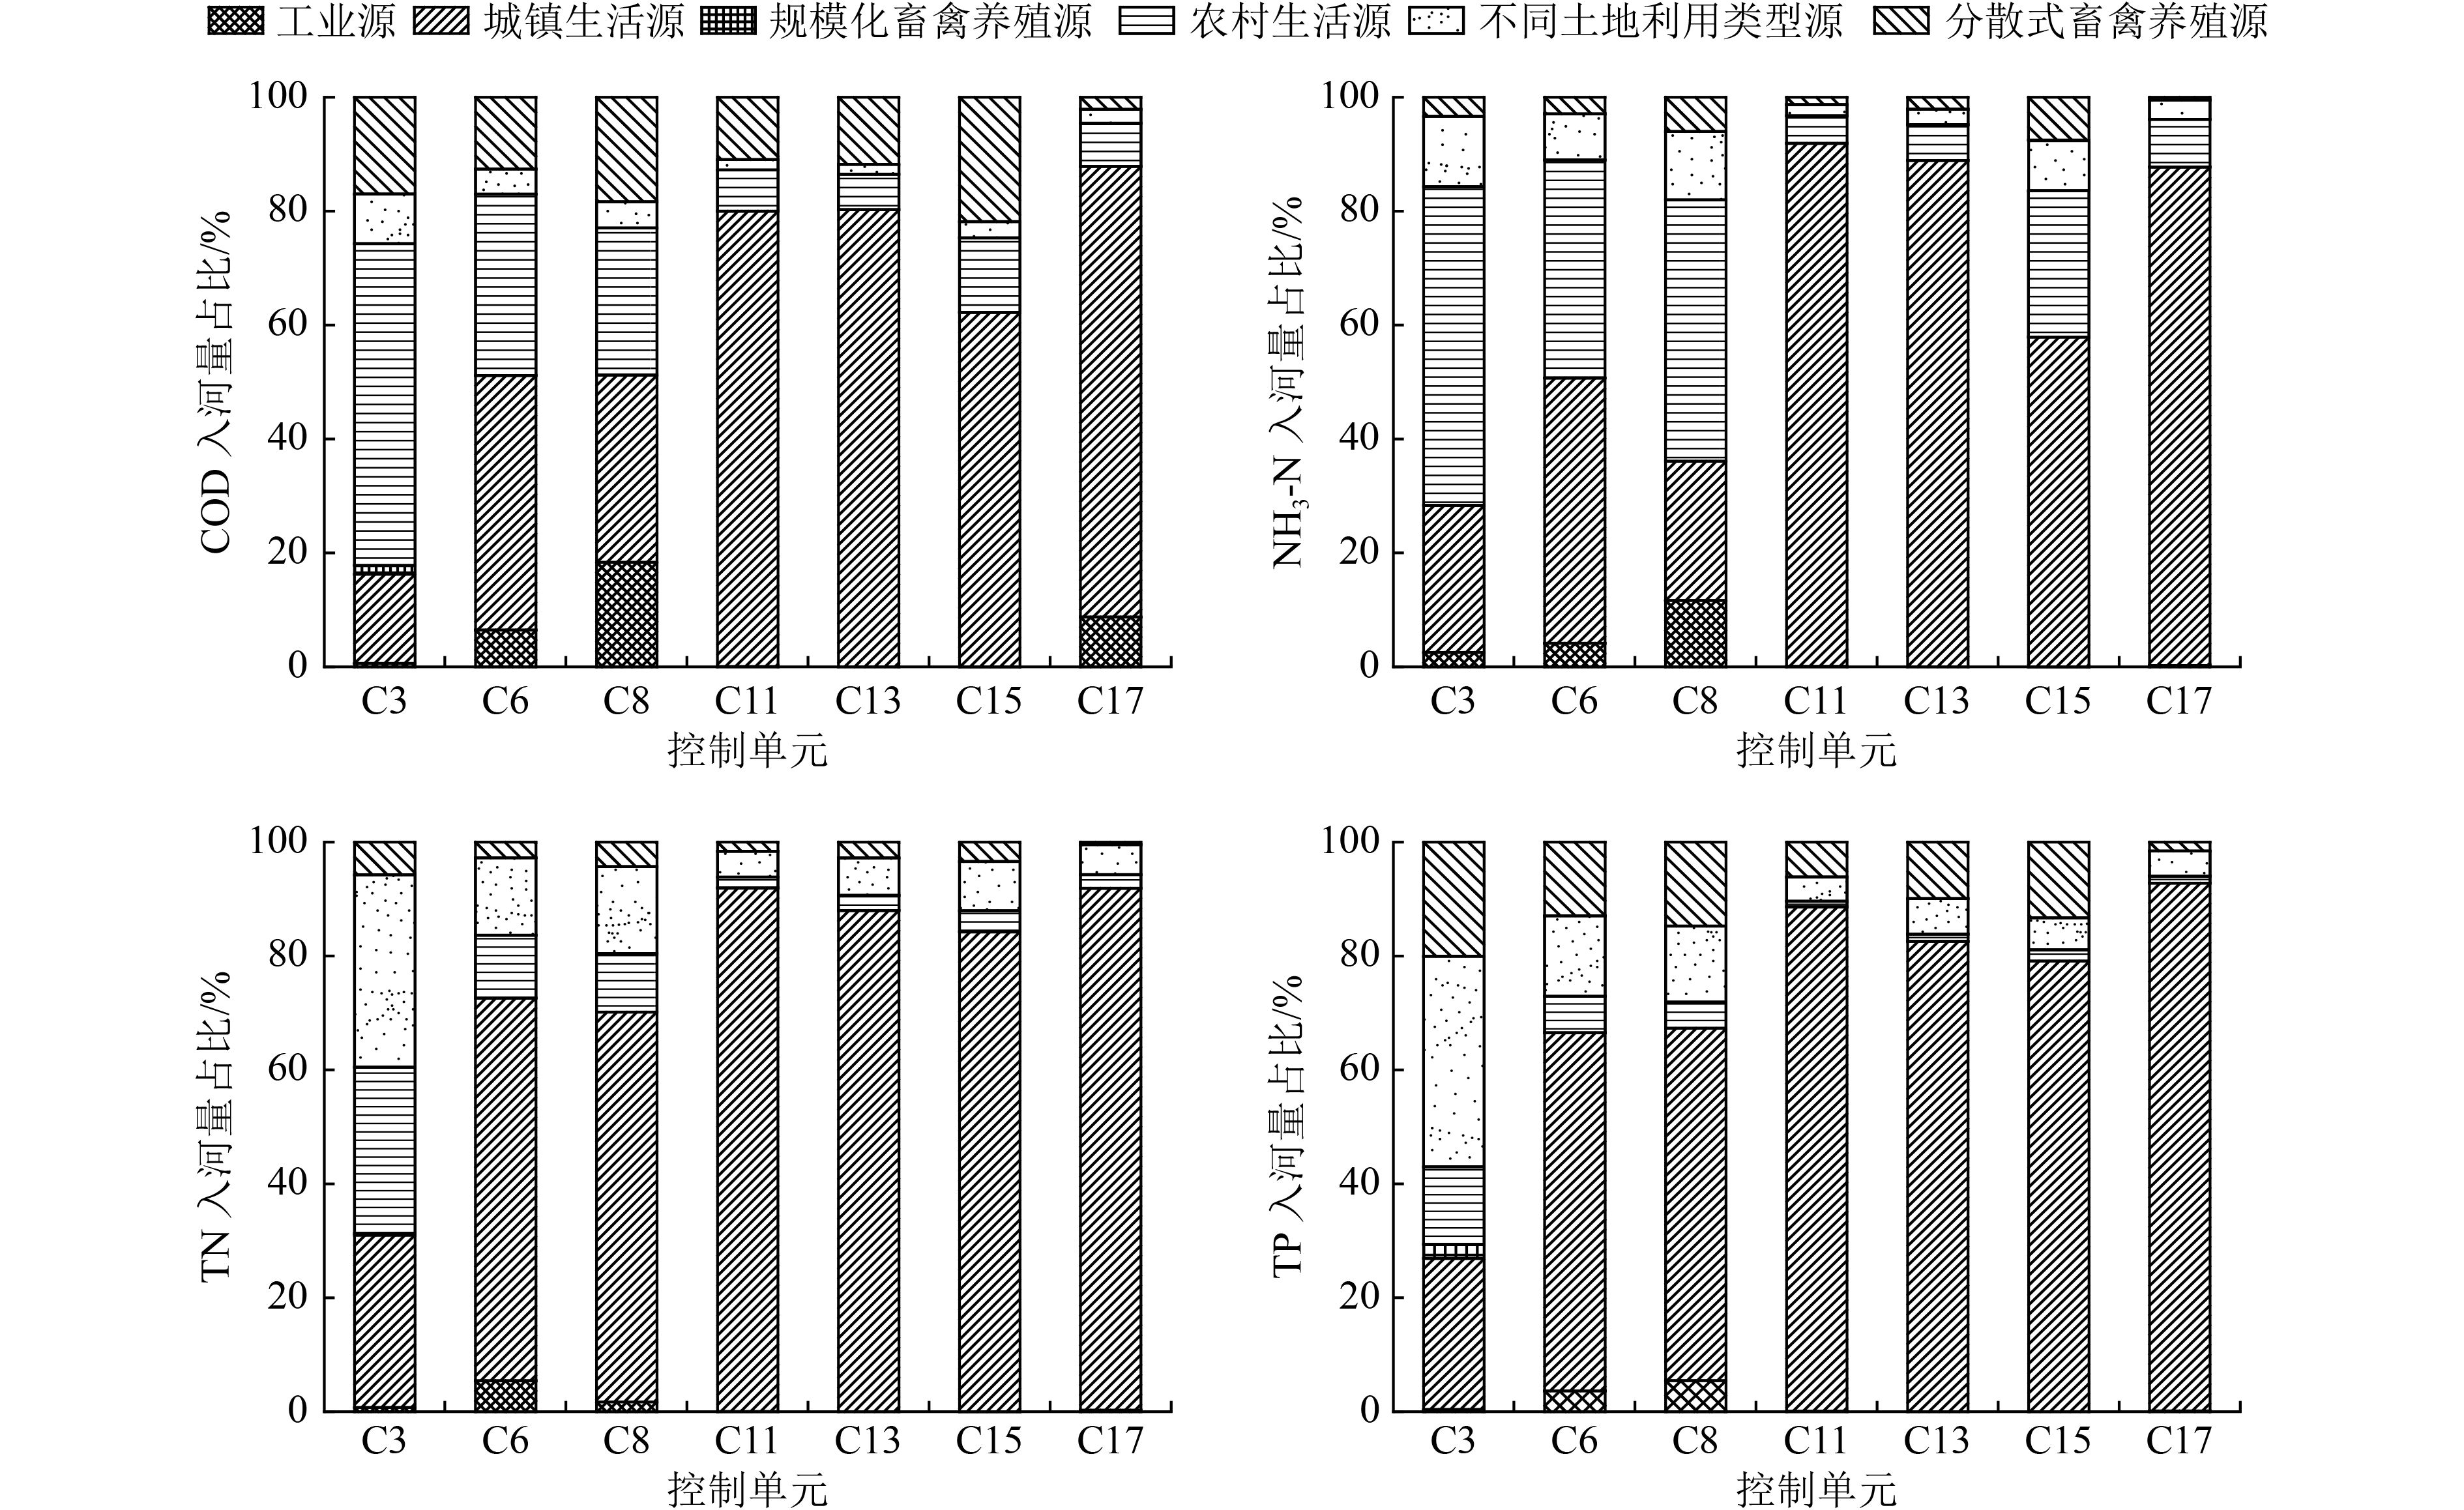
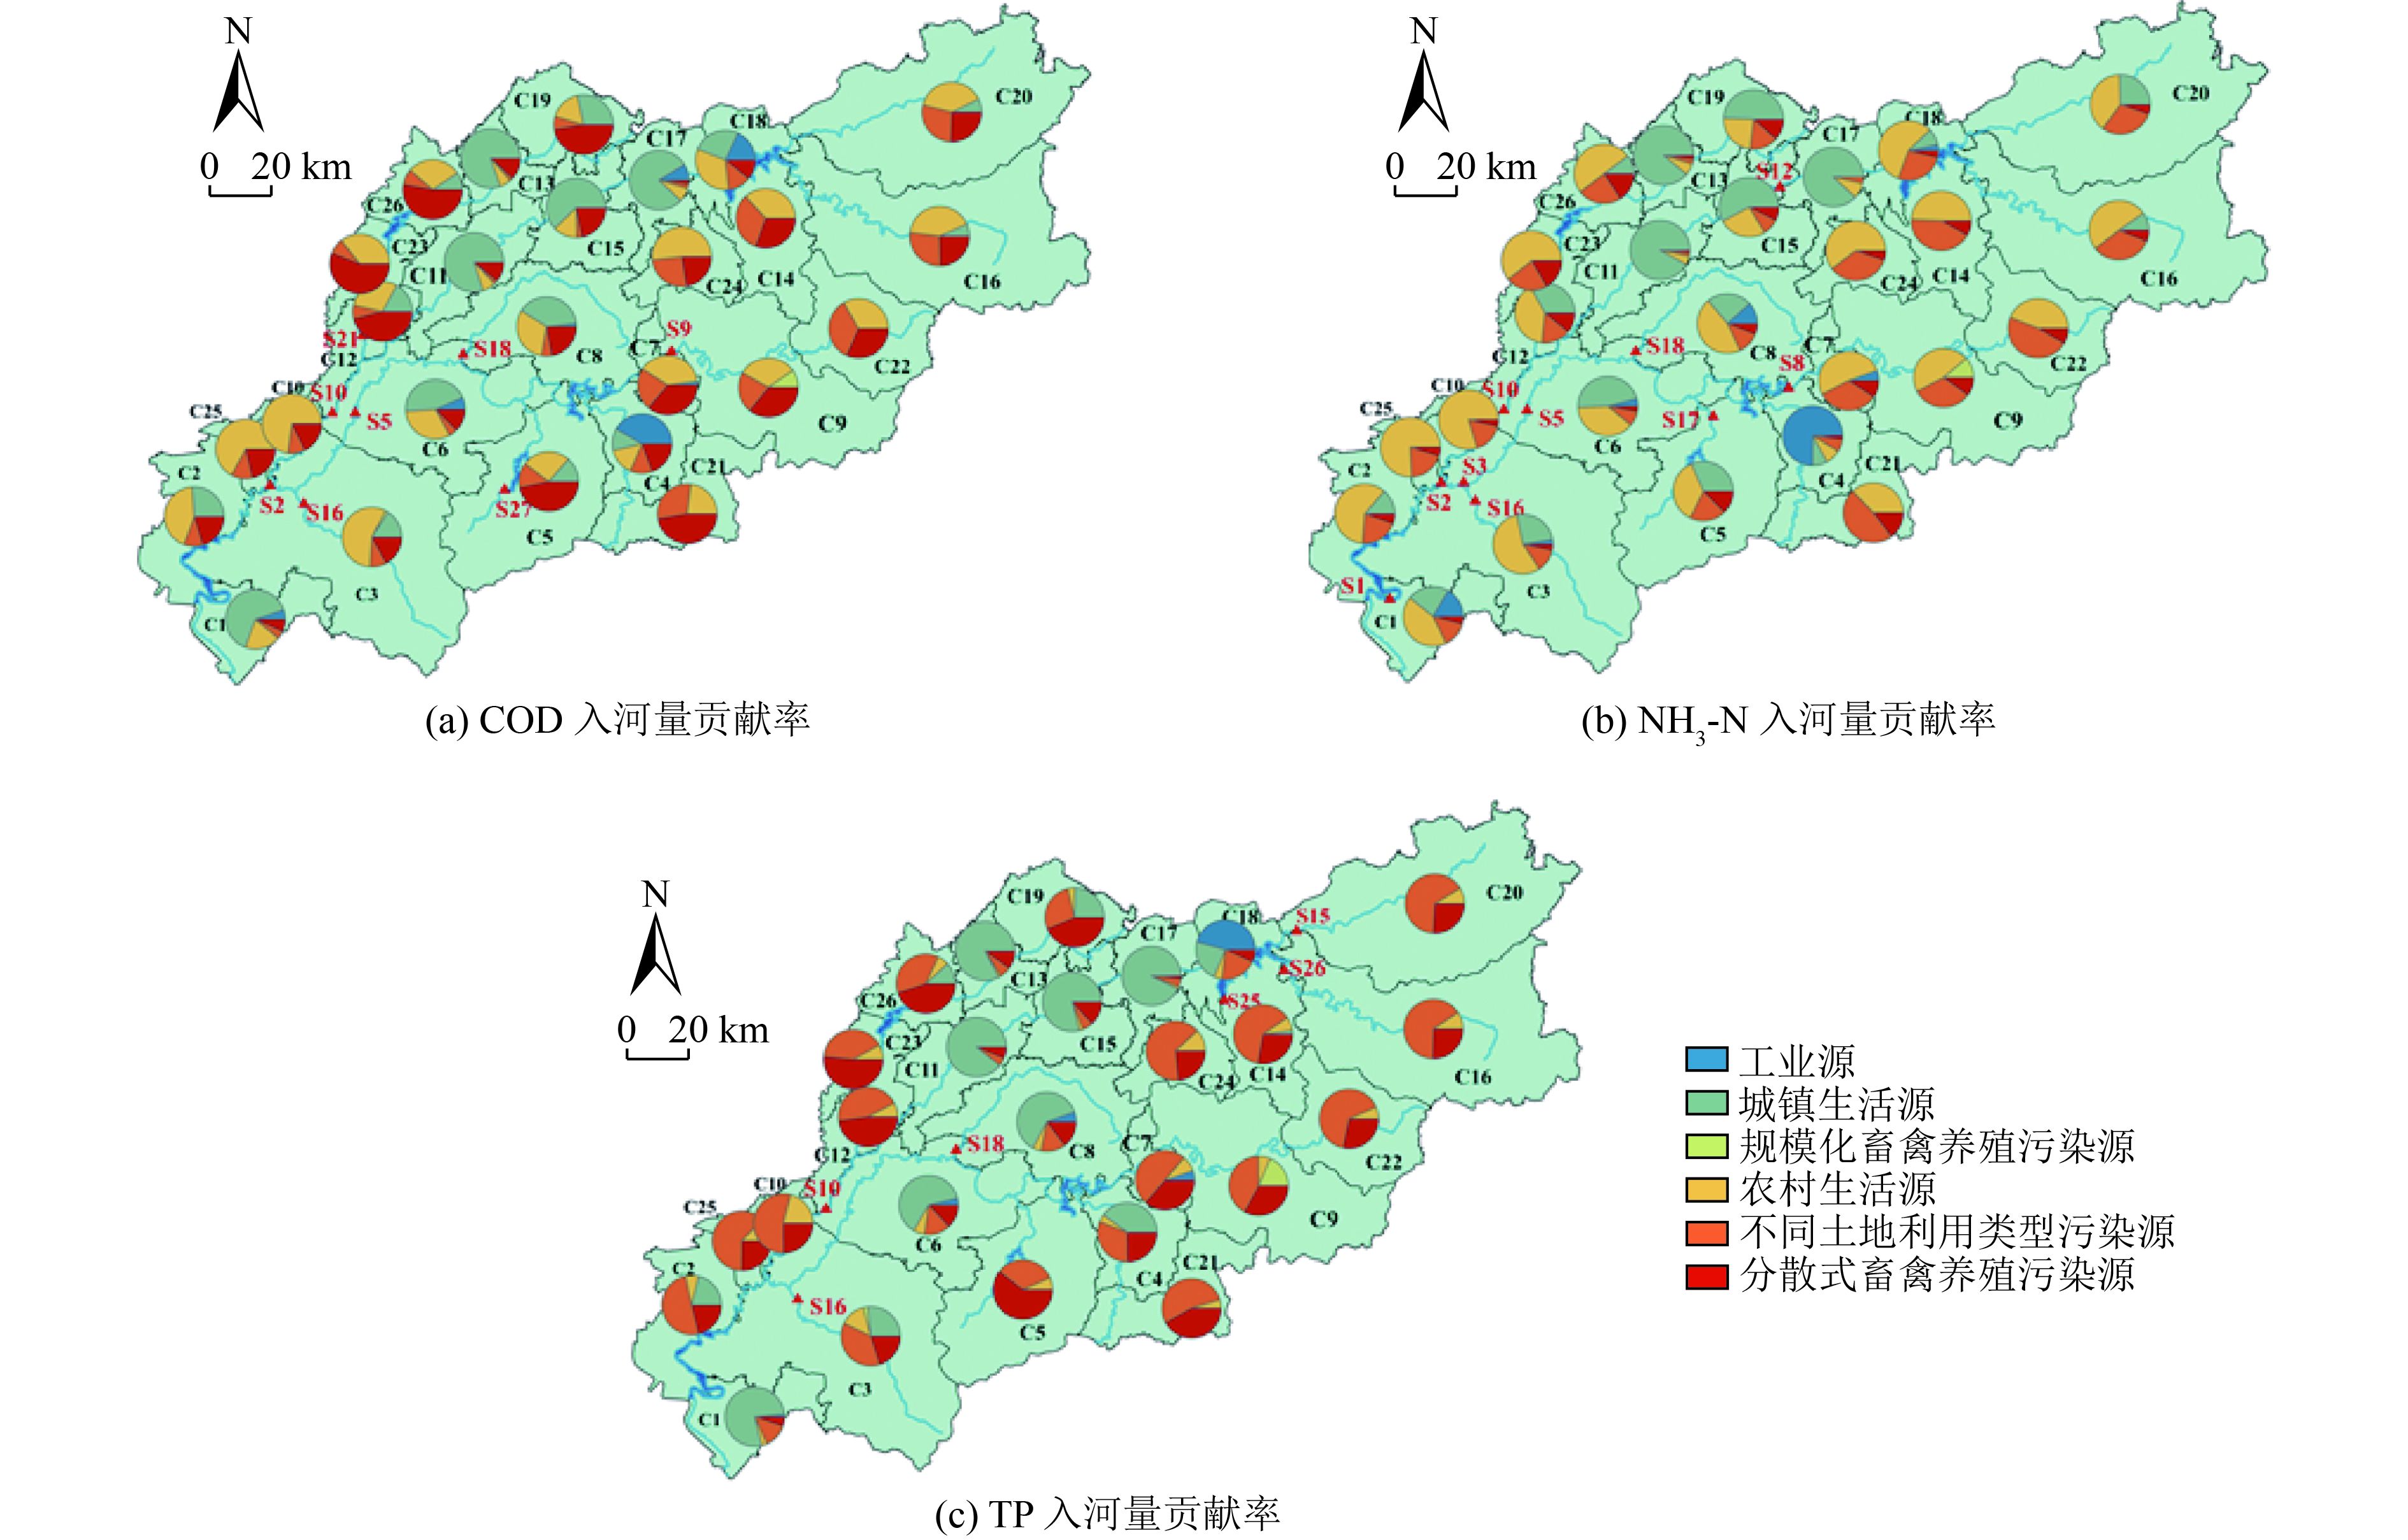
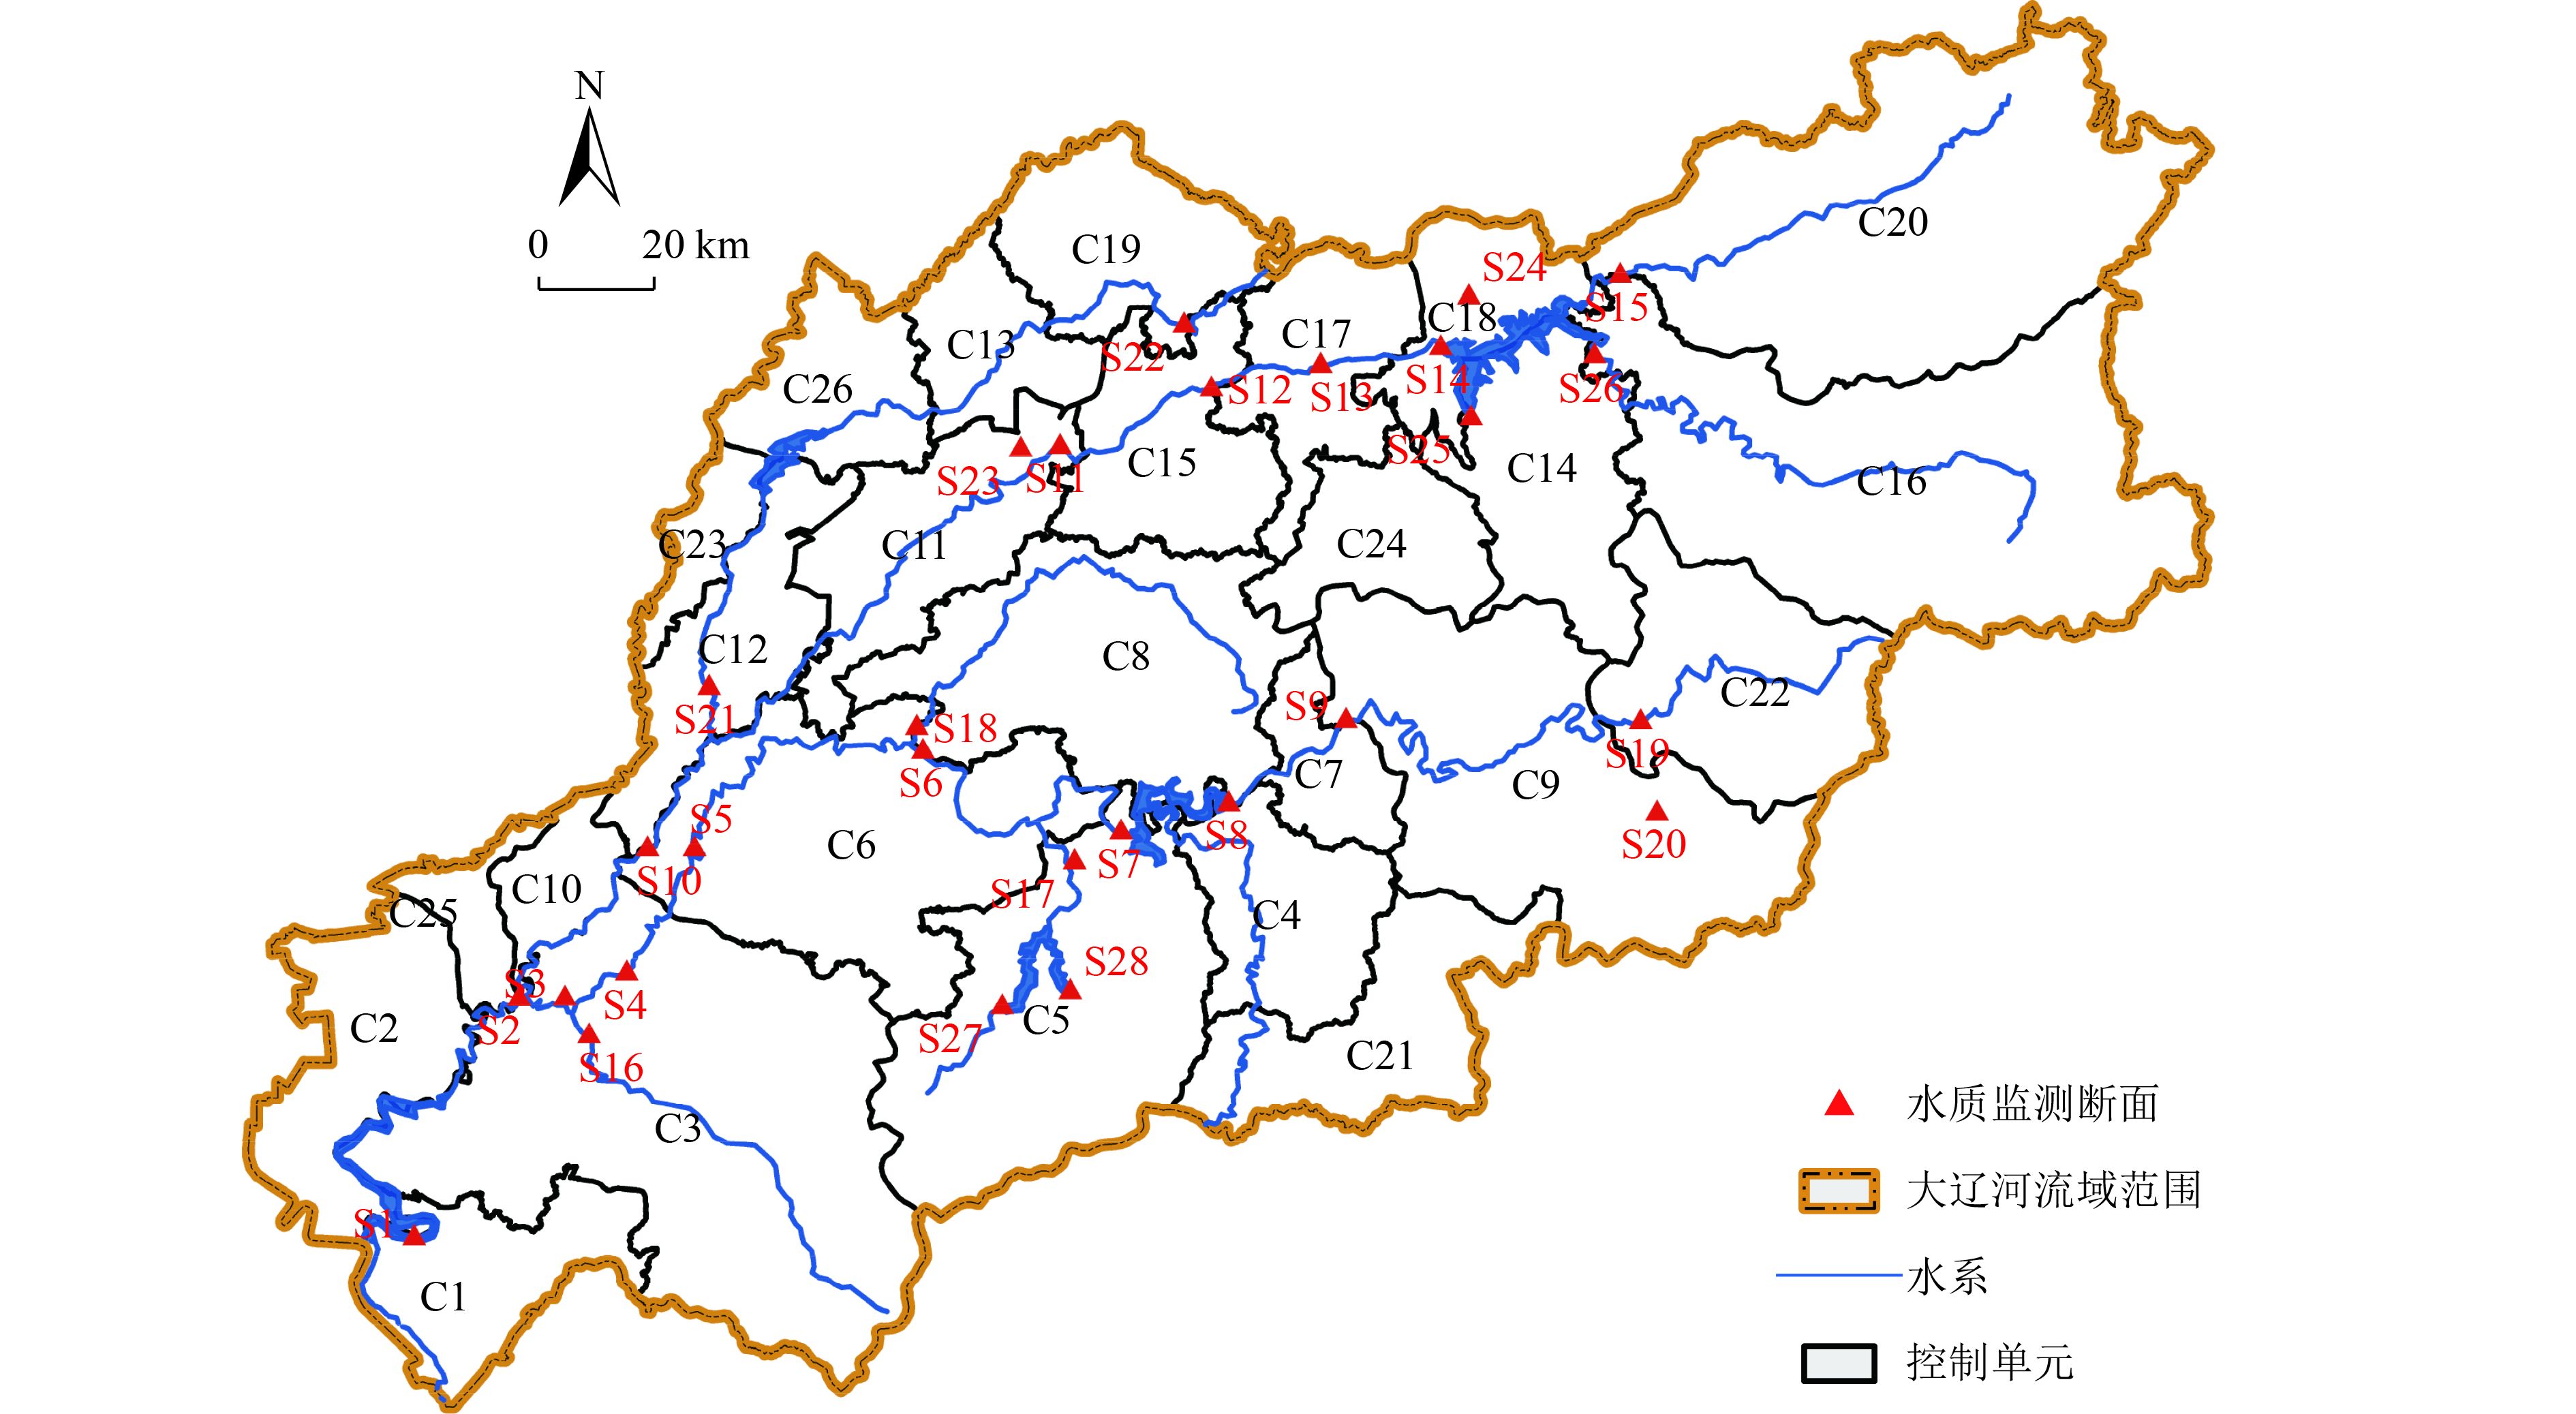
In order to better understand the characteristics and sources of pollutants in Daliao River Basin, the spatial topological relationship of "Watershed-Control unit-Administrative district" was established, the water quality of the state-controlled sections of Daliao River Basin, the amount of pollutants into the river in every control unit, and the spatial distribution characteristics in 2019 were analyzed. The results indicated that: 1) Among 28 water quality monitoring sections in Daliao River Basin, 29% of the monthly water quality could reach the targets of the Action Plan for Prevention and Control of Water Pollution. COD and NH3-N were the main pollutants that exceeded the standard. In the section exceeding the standard, the main sources of COD and NH3-N were urban life sources, rural life sources and decentralized livestock and poultry breeding, while TP mainly came from pollution sources of different land use types and urban life sources. 2) The amount of COD, NH3-N, TN, and TP pollutants into the river was 59 195.5, 3115.5, 18 229.7, and 538.3 t/a, respectively. The contribution rate in descending order was urban living source, rural living source, decentralized livestock and poultry breeding source, source of various landuse types (including woodland, grassland, farmland, urban land), industrial source, large-scale livestock and poultry breeding source. 3) The spatial distribution of the inflowing amount of pollutants into the river in descending order was central, southwest, and northeast, with C3, C6, C8, C11, C13, C15, C17 being the key control units. In the above key control units, the contribution rates of COD, NH3-N, TN, and TP into the river were 68%, 73%, 77%, and 72%, respectively. 4) The error between the estimation result of the inflowing amount of pollutant into the river and the flux simulation value were all less than 20%. The methods should be suitable for the estimation of pollution load in the study area.

| [1] |
KAZI T G, ARAIN M B, JAMALI M K, et al. Assessment of water quality of polluted lake using multivariate statistical techniques: a case study[J]. Ecotoxicology and Environmental Safety,2009,72(2):301-309. doi: 10.1016/j.ecoenv.2008.02.024
|
| [2] |
ZHANG P P, LIU R M, BAO Y M, et al. Uncertainty of SWAT model at different DEM resolutions in a large mountainous watershed[J]. Water Research,2014,53:132-144. doi: 10.1016/j.watres.2014.01.018
|
| [3] |
CHOI G C, LEE J H, YU J C, et al. Laboratory assessment of biofilm process and its microbial characteristics for treating nonpoint source pollution[J]. Korean Journal of Chemical Engineering,2011,28(5):1207-1213. doi: 10.1007/s11814-010-0479-x
|
| [4] |
ZHANG B L, CUI B H, ZHANG S M, et al. Source apportionment of nitrogen and phosphorus from non-point source pollution in Nansi Lake Basin, China[J]. Environmental Science and Pollution Research International,2018,25(19):19101-19113. doi: 10.1007/s11356-018-1956-8
|
| [5] |
YANG Y H, YAN B X, SHEN W B. Assessment of point and nonpoint sources pollution in Songhua River Basin, Northeast China by using revised water quality model[J]. Chinese Geographical Science,2010,20(1):30-36. doi: 10.1007/s11769-010-0030-3
|
| [6] |
EL-NAKIB S, ALAMEDDINE I, MASSOUD M, et al. Nutrient pollutant loading and source apportionment along a Mediterranean River[J]. Environmental Monitoring and Assessment,2020,192(5):274. doi: 10.1007/s10661-020-8220-7
|
| [7] |
MATEJ-ŁUKOWICZ K, NAWROT N, WOJCIECHOWSKA E. Estimate load of biogenic pollutants inflowing with water of Oliwa Stream to Gulf of Gdansk[J]. Inżynieria Ekologiczna,2018,19(2):1-8. doi: 10.12912/23920629/86042
|
| [8] |
高艳妮, 杨彩云, 冯朝阳, 等.辽河保护区退耕封育措施消减污染物入河量估算[J]. 环境工程技术学报,2020,10(4):539-544. doi: 10.12153/j.issn.1674-991X.20200028
GAO Y N, YANG C Y, FENG C Y, et al. Estimation of pollutants into river reduced by measures of returning cropland to enclosure in Liaohe Conservation Area[J]. Journal of Environmental Engineering Technology,2020,10(4):539-544. doi: 10.12153/j.issn.1674-991X.20200028
|
| [9] |
宋梓菡, 崔嵩, 付强, 等.哈尔滨市主城区河流污染物入河量初步估算与来源分析[J]. 灌溉排水学报,2020,39(3):134-144.
SONG Z H, CUI S, FU Q, et al. Origins and estimation of the pollutants in main rivers in urban area of Harbin[J]. Journal of Irrigation and Drainage,2020,39(3):134-144.
|
| [10] |
李艳红, 葛刚, 吴根林, 等.信江流域氮磷污染负荷估算及其控制对策[J]. 南昌大学学报(理科版),2021,45(2):176-181. doi: 10.13764/j.cnki.ncdl.2021.02.014
LI Y H, GE G, WU G L, et al. Estimation and control stategies of nitrogen and phosphorus pollution load in Xinjiang drainage basin[J]. Journal of Nanchang University (Natural Science),2021,45(2):176-181. doi: 10.13764/j.cnki.ncdl.2021.02.014
|
| [11] |
王晋虎, 古向前, 周曼.京杭运河(苏州段)污染负荷核算及源解析[J]. 能源与环保,2021,43(2):73-77.
WANG J H, GU X Q, ZHOU M. Pollution load calculation and source apportionment of Beijing-Hangzhou Canal (Suzhou section)[J]. China Energy and Environmental Protection,2021,43(2):73-77.
|
| [12] |
荆延德, 樊蕊.基于CNKI和WOS的非点源污染模型的研究热点及趋势分析[J]. 生态学报,2018,38(11):4077-4087.
|
| [13] |
CHENG H, LIN C, WANG L J, et al. The influence of different forest characteristics on non-point source pollution: a case study at Chaohu Basin, China[J]. International Journal of Environmental Research and Public Health,2020,17(5):1790. doi: 10.3390/ijerph17051790
|
| [14] |
PARK M, CHOI Y S, SHIN H J, et al. A comparison study of runoff characteristics of non-point source pollution from three watersheds in south Korea[J]. Water,2019,11(5):966. doi: 10.3390/w11050966
|
| [15] |
QIU J L, SHEN Z Y, CHEN L, et al. Quantifying effects of conservation practices on non-point source pollution in the Miyun Reservoir Watershed, China[J]. Environmental Monitoring and Assessment,2019,191(9):582. doi: 10.1007/s10661-019-7747-y
|
| [16] |
CLESCERI N L, CURRAN S J, SEDLAK R I. Nutrient loads to Wisconsin Lakes: part i. nitrogen and phosphorus export coefficients1[J]. JAWRA Journal of the American Water Resources Association,1986,22(6):983-990. doi: 10.1111/j.1752-1688.1986.tb00769.x
|
| [17] |
JOHNES P J. Evaluation and management of the impact of land use change on the nitrogen and phosphorus load delivered to surface waters: the export coefficient modelling approach[J]. Journal of Hydrology,1996,183(3/4):323-349.
|
| [18] |
李怀恩, 庄咏涛.预测非点源营养负荷的输出系数法研究进展与应用[J]. 西安理工大学学报,2003,19(4):307-312. doi: 10.3969/j.issn.1006-4710.2003.04.003
LI H E, ZHUANG Y T. The export coefficient modeling approach for load prediction of nutrient from nonpoint source and its application[J]. Journal of Xi'an University of Technology,2003,19(4):307-312. doi: 10.3969/j.issn.1006-4710.2003.04.003
|
| [19] |
李政道, 刘鸿雁, 姜畅, 等.基于输出系数模型的红枫湖保护区非点源污染负荷研究[J]. 水土保持通报,2020,40(2):193-198.
LI Z D, LIU H Y, JIANG C, et al. Non-point source pollution load of Hongfeng Lake reserve based on export coefficient model[J]. Bulletin of Soil and Water Conservation,2020,40(2):193-198.
|
| [20] |
孙宇.基于多方法的浑河流域水质模拟研究[J]. 陕西水利,2021(3):77-80.
SUN Y. Research on water quality simulation of Hunhe River Basin based on multiple methods[J]. Shaanxi Water Resources,2021(3):77-80.
|
| [21] |
李晓连. 基于水环境容量的辽河铁岭段污染负荷总量分配[D]. 沈阳: 沈阳理工大学, 2016.
|
| [22] |
史美玲. 辽河盘锦段废水污染物减排对水环境质量的影响[D]. 沈阳: 沈阳理工大学, 2020.
|
| [23] |
王永.辽河污染物允许排放量分配分析研究[J]. 陕西水利,2020(1):95-97.
|
| [24] |
张利民, 刘伟京, 尤本胜, 等.太湖流域漕桥河污染物来源特征[J]. 环境科学研究,2009,22(10):1150-1155. doi: 10.13198/j.res.2009.10.40.zhanglm.004
ZHANG L M, LIU W J, YOU B S, et al. Characteristics of pollutant sources of Caoqiao River in Taihu Lake Basin[J]. Research of Environmental Sciences,2009,22(10):1150-1155. doi: 10.13198/j.res.2009.10.40.zhanglm.004
|
| [25] |
付意成, 魏传江, 臧文斌, 等.浑太河污染物入河控制量研究[J]. 水电能源科学,2010,28(12):21-25. doi: 10.3969/j.issn.1000-7709.2010.12.009
FU Y C, WEI C J, ZANG W B, et al. Research on contaminant control quantity of entering into Huntai River[J]. Water Resources and Power,2010,28(12):21-25. doi: 10.3969/j.issn.1000-7709.2010.12.009
|
| [26] |
娄保锋, 卓海华, 周正, 等.近18年长江干流水质和污染物通量变化趋势分析[J]. 环境科学研究,2020,33(5):1150-1162.
LOU B F, ZHUO H H, ZHOU Z, et al. Analysis on alteration of water quality and pollutant fluxes in the Yangtze mainstem during recently 18 years[J]. Research of Environmental Sciences,2020,33(5):1150-1162.
|
| [27] |
郝晨林, 邓义祥, 汪永辉, 等.河流污染物通量估算方法筛选及误差分析[J]. 环境科学学报,2012,32(7):1670-1676.
HAO C L, DENG Y X, WANG Y H, et al. Study on the selection and error analysis of riverine pollutant flux estimation methods[J]. Acta Scientiae Circumstantiae,2012,32(7):1670-1676.
|
| [28] |
富国.河流污染物通量估算方法分析(Ⅰ): 时段通量估算方法比较分析[J]. 环境科学研究,2003,16(1):1-4. doi: 10.3321/j.issn:1001-6929.2003.01.001
FU G. Analysis of the estimation methods for the river pollutant fluxes(Ⅰ): comparison and analysis of the estimation methods of period fluxes[J]. Research of Environmental Sciences,2003,16(1):1-4. ⊕ doi: 10.3321/j.issn:1001-6929.2003.01.001
|
Figures(4) / Tables(6)
Copyright © Editorial Department of Journal of Environmental Engineering Technology
Supported by: Beijing Renhe Information Technology Co., Ltd.


 DownLoad: